Energy Crisis?
As we get ready to say goodbye to June, I do wonder where the year has gone and how markets have changed from an orderly bull market to high volatility stakes. It could be said it’s a great time to be trading markets, but there is always some market out there that’s doing something that I know I shouldn’t be surprised by, but some part of me is.
Its human to experience emotions and have the emotions of others rub off on us. The market talk becomes increasingly bearish with the same old chestnuts being rolled out to illicit a response. Too much inflation, interest rates too high, everyone leaving markets for some new investment scheme. Ultimately stocks, property, and the new fad of crypto have all seen small to large resets in price. The rise of some currencies and commodities means they are in vogue but will also face a revaluation at some point. We must challenge ourselves to be on the right asset class at the right time and in the right direction. Should be a piece of cake?
David through the Ultimate Gann Course provides us with the framework of Time, Price, Pattern, Position and Volatility. It’s a broad construct and can be used to lay a foundation to build from. It can also, in the right circumstances, be used as a laser level to have great confidence of what the market will do next. How you see it will often depend on where you are in your own cycle of learning and if the market is at one of those defining turning points.
On page 16 of the Ultimate Gann Course David describes how “form reading, position of the market and the swing charts are the basis from which I determine if conditions are right for a trading decision around my key times and prices.”
That small sentence tells a great deal, the prep work and how well you know your market could be seen as the main drivers behind whether or not you pull the trigger. There is much to be discussed on crude oil in the current economic space but also in terms of its history. The threat of blackouts affecting our electricity grids in Australia and the buck passing of government, regulators and energy producers really highlights how in 2022 we can still see energy insecurity as being a major concern. If we throw in the effects of the northern hemisphere pressure due to Ukraine and we really do have the melting pot for a significant opportunity in energy markets.
This article will focus on crude, but don’t forget natural gas as a market deserving of your study.
The bigger cycles that exist in your market that are years and months long can provide us the “time” element of what David is telling us in the Ultimate Gann Course. I won’t repeat my work that has been discussed previously but if you are serious about trading crude, we should understand the impact of Seasonal Dates on this market and we are right on June’s as I type.
We could examine the impact of the June seasonal date on crude and in what years it has produced tradeable turns. The first areas that may jump out to you are the lows of June in 2017 and 2012. They both came in around seasonal time and produced strong bullish moves. There is also the time frame from the bear market low of 2008 to now as a time frame in months, we see approximately 161 months have passed since the GFC Low on oil. This time frame is large and requires some push and pull with our thinking but helps us understand we are in an area of potential.
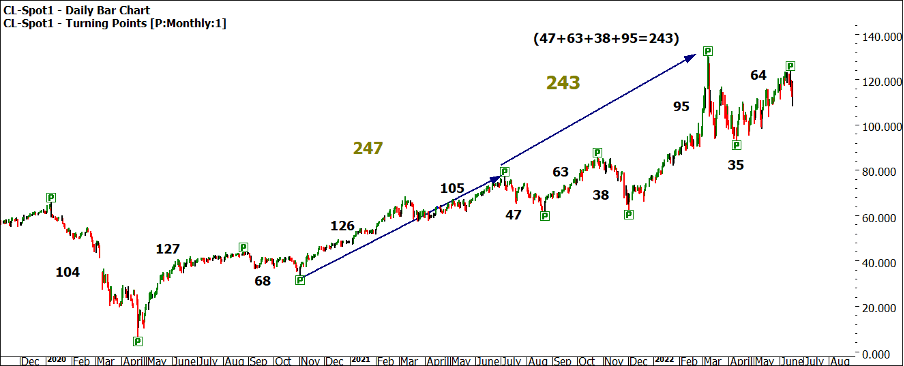
Chart 1 continues the theme of time with calendar day counts being used to identify repetition and “symmetry of number”. They are just building blocks and I encourage you to see what else you can measure and overlay.
Chart 1 – Daily Bar Chart CL-Spot1
The price component again offers an endless amount of techniques and numbers to watch. The danger here is we become overwhelmed and see every price as important. I suggest using lows squares as a good starting point.
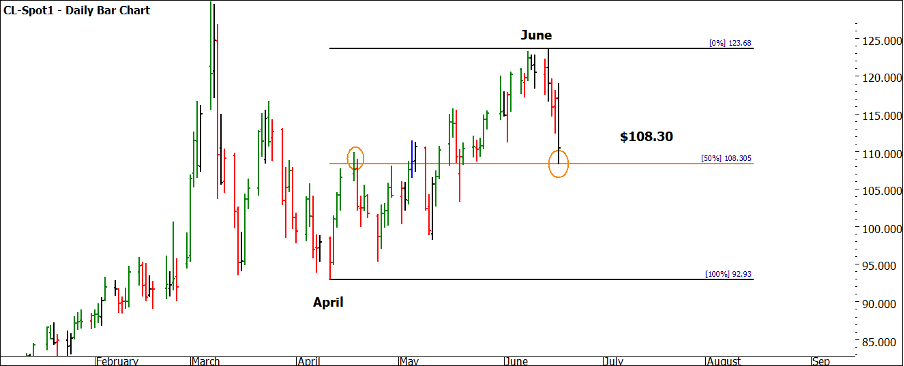
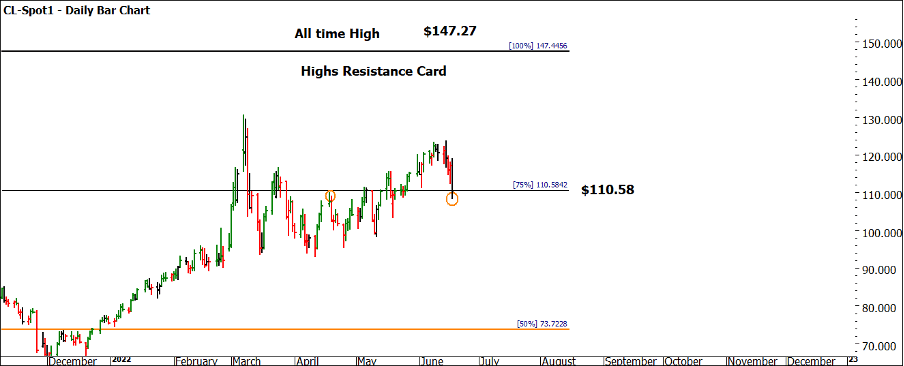
Chart 2 shows the recent price action coming back to sit on the 50%-point, Chart 3 uses the All-Time High of $147.27 as our reference point for the Highs Resistance Card.
Chart 2 – Daily Bar Chart CL-Spot1
Chart 3 – Daily Bar Chart CL-Spot1
From a pattern perspective, I have been noticing the return of signal days more and more in the crude market around market turns. Again, a course of action would be to study the bar patterns on major turns (especially lows) in the last few years. You might also wish to link these to seasonal dates and see if there is any assistance here.
The position of the market is always open to debate, and I won’t dip my toe into the water here as it’s not a major requirement for me. Suffice to say I think we could well see a third leg up in energy markets, but the question will be, have we had enough of a retracement to date to be looking for a third leg up?
Finally, the volatility question is a simple one to consider. This can be as simple as looking at swing ranges, the average range indicator, the volatility indicator or simply the recent bars and patterns. All align with the view that the markets are moving and swinging. Our aim will be to harness that volatility and use trading rules to be a part of those moves.
Good Trading
Aaron Lynch


