Ferrari Market – Price Forecasting
The ABC Trading Plan was taught to you as the foundation of bigger picture learning. From the day you started learning the Smarter Starter Pack, David has created concepts that can be applied to both the minor and major trend. Like any skill, you must first learn to find the ABC patterns on your swing charts. Unfortunately, as you start learning about time and the third dimension, the basics can often get put to the side and forgotten. This month’s article won’t recap on ABC trading, we’ll look instead at how you can apply an ABC to explore the bigger picture target zones within a market, meaning you can apply the same ABC trade concept to the bigger picture setups that will help identify future support and resistance levels.
Regardless of your level as a trader and experience, it is essential to keep your foundations strong, and therefore review the basics often. That doesn’t mean you have to intensely study old grounds again, but more so review priceless knowledge chapters such as the Price Forecasting section of the Number One Trading Plan. It seems that this chapter in particular often provides more insight every time it is read and applied to a new market.
No doubt by now you have a very strong understanding around how an ABC Trade is completed by using the ABC Trading Plan. If we take this process of completing the ABC Trading Plan a step further and apply it to a bigger picture perspective (such as a weekly or monthly chart) we can start to analyse a market’s bigger picture position, and then use the ABC setups with smaller trading opportunities. This ultimately makes a price forecast or roadmap based on the position of the overall market. The benefit of this is to gather an understanding about where in the current market cycle we are placed, so we can therefore trade with the major trend.
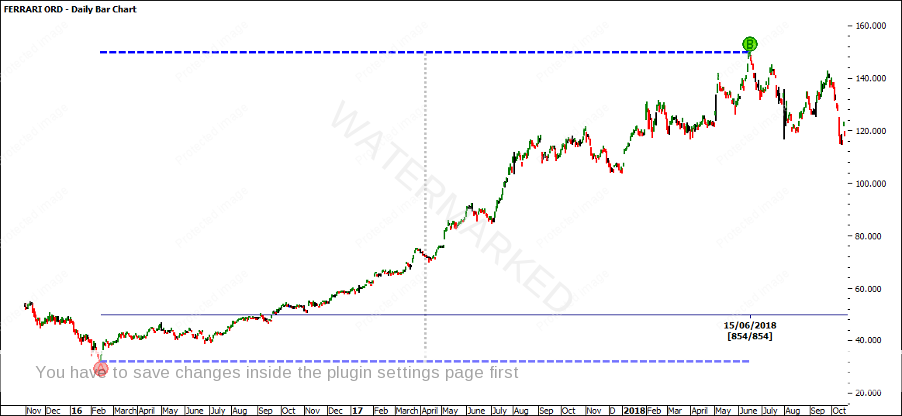
If we turn our attention to the weekly chart on FERRARI listed on the NYSE (ProfitSource Code: RACE), we can start to apply a major ABC range in order to make a price forecast. The All-Time Low was in 2016 on the 12th of February at a price of $32.17. If we apply Point B to the next major top, on the 15th of June 2018 at $149.85 we can calculate our AB Range. We get a range of $117.68 ($149.85 – $32.17). The distance in time between the AB Range is 854 Calendar Days OR 581 Trading Days. These figures are not meant to mean anything at this stage. This is more data collection in order to put together our road map for the position of the market.
Please note that in this example we are not applying the ABC ranges to the swing chart. We are more so looking at the major structure of the market. Gann said to look for the three potential sections, which was similar to how David Bowden did it with the Share Price Index in Chapter Nine of the Number One Trading Plan. You can turn your Turning Points Tool on in the ProfitSource software to help you identify these points.
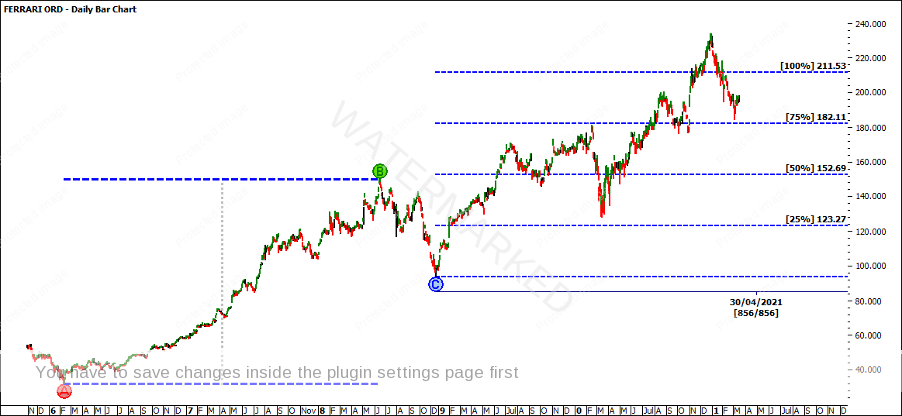
As we have the AB range we can now break down our range into halves, thirds and quarters to generate our milestones. $117.68 divided by 4 gives us the quarters. Therefore, our quarter milestones of $29.42 ($117.68/4) can be added to the low of Point C. Once again, we do the math to generate the data. You will be surprised by knowing the quarters, halves and thirds, how often those numbers pop up in the market.
The next major low, which we will project Point C from was on the 26th of December 2018 at $93.85. Projecting $29.42 (the quarters) from this low will identify pressure points in the market. As you can see in the chart below based on the ABC trading checklist, we can call this market strong as it has repeated over 100%. The market has also respected the milestones.
Note that the milestones are not guaranteed turning points, they are high probability areas in which the market can turn. Never look at a milestone as a ‘must’.
| QUARTERS | THIRDS | ||
|---|---|---|---|
| Point C: $117.68 + $29.42 | Point C: $117.68 + $39.22 | ||
| 25%: $123.27 | 33%: $156.90 | ||
| 50%: $152.69 | 66%: $196.12 | ||
| 75%: $182.11 | 100%: $211.53 | ||
| 100%: $211.53 | |||
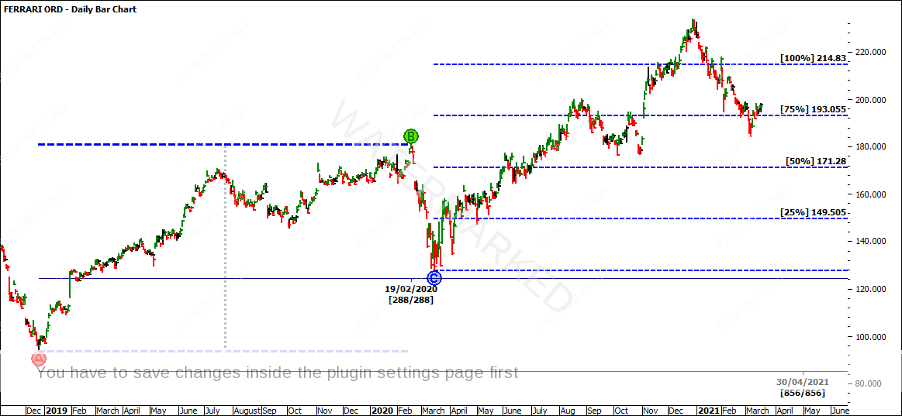
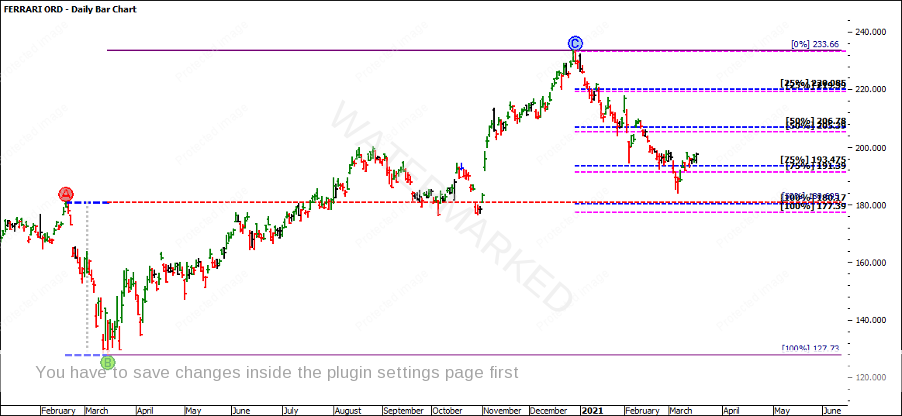
If we zoom into the second major section, we can look to break down the Wheels within Wheels. Using the same concept as above, we can identify the AB reference range and project it from Point C.
The major Point C has now become the new minor Point A. On the 26th of December 2018 at a price of $93.85. Applying Point B, to the next major top, on the 19th of February 2019 at $180.95 we can calculate our AB Range. We get a range of $87.10. The distance in time between the AB Range is 420 Calendar Days OR 288 Trading Days. If you multiply the 288 Trading Days by 2 you get 576 which is a week out from our Trading Day count of the major cycle at 581 Trading Days. Again, this is more data collection in order to put together our road map for the position of the market. We have not made any assumptions.
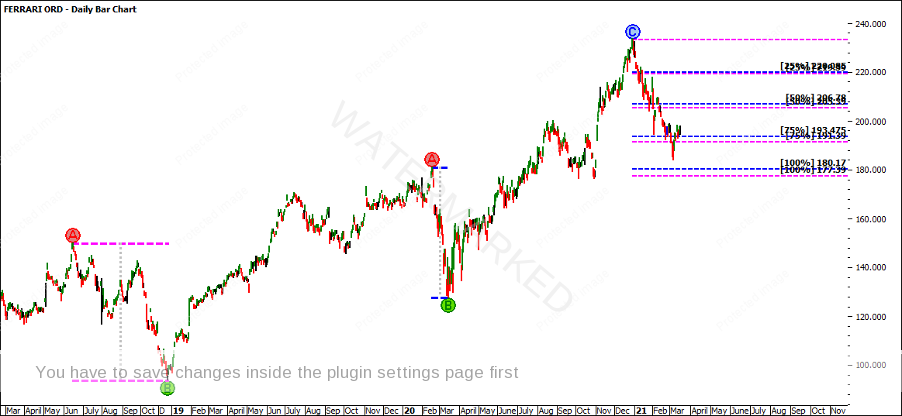
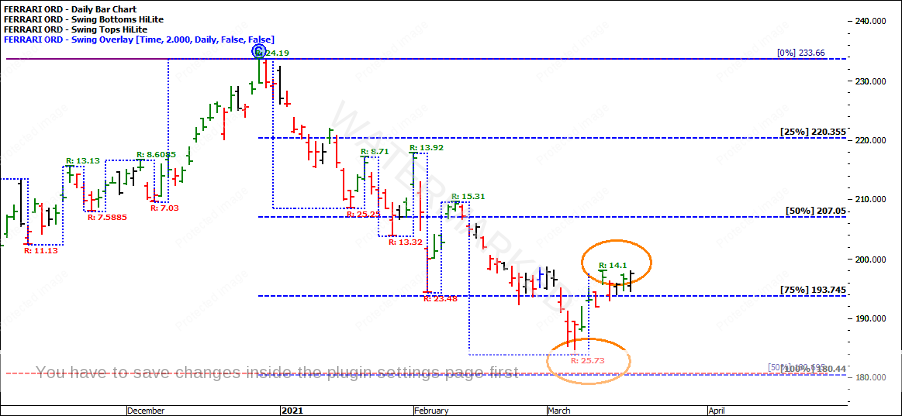
As the market exceeded 100%, we can see why there as now been a price reaction. In order to understand the strength of this market, comparing the most recent retracement with the previous two, it has not yet hit the 100% milestone, meaning there might be some strength in this market, as the downside ranges are contracting.
It would be nice to see the 100% milestone come in as support, as it will illustrate a balanced market with previous ranges, as well as sit on the 50% range resistance card.
Placing a 2-day swing overlay across the chart, you can see that the upside ranges are still contracting, while the downside ranges are expanding. This is a sign that we might see the cluster area tested before we see some further upside. I would watch 90 degrees from the All-Time High, allowing another two weeks for this low to be made. In saying that, this is just speculation and we will have to wait to see how the market plays out.
David used to say, “don’t be anticipatory stupid”, so make sure you have a well structure plan so that you can look to take advantage of the potential moves to come.
It’s Your Perception
Robert Steer
