Financial Stocks – A Health Check
The cycle of inflation and increasing interest rates continues to dominate the landscape and each country around the globe is facing its own challenges around where they are in the current cycle. The US has seen inflation run harder than here in Australia but has the potential to abate quicker, the reasons are US centric and start to get into the economic details of how each country operates. Last month I wrote about opportunities over opinions, and I maintain that’s the approach that assists in keeping us on the right path when the noise of markets can overwhelm.
I have no doubt that there is a large percentage of the population globally and domestically that will go to the wall in the current cycle. This unfortunately is human nature, as Gann and David have trained us to know that cycles are natural and persistent, so swimming against the tide is a zero sum game, for some they can’t swim long enough to wait for the tide to come back their way.
If we can be prepared for the cycles before they commence, we can position ourselves accordingly and rather than exist we can flourish during the good and bad times. An area of the economy that is dominant and vital is the role financial companies play in the health and wellbeing of economies. They are large employers (think the major banks in Australia) and can be used as a barometer of health as an indicator of sorts.
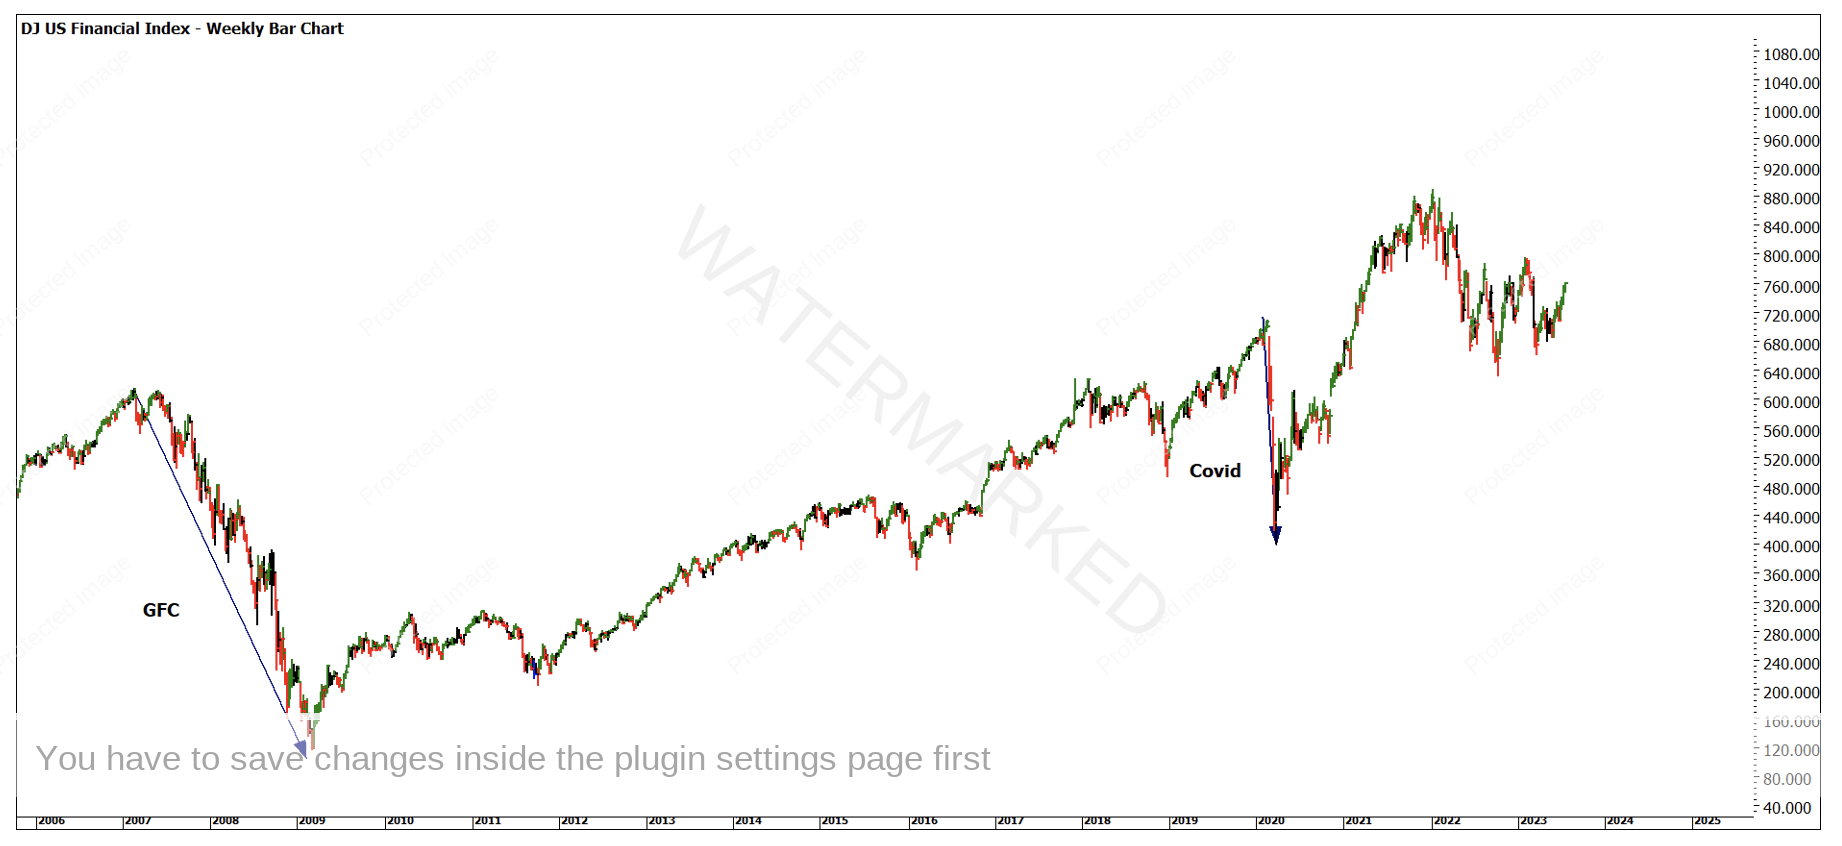
The dominance of local banks in Australia is skewed when compared to the world landscape but we can view indexes (groups of financial companies) to see how they are tracking more broadly. Much like analysing the SPI200 or the S&P500 this allows us to view a particular sector through a lens. For this analysis I have been following the DJ US Financial Index (DJUSFN.CBOT). Chart 1 below provides a large time frame of the major trends.
Chart 1 – Weekly Bar Chart DJUSFN
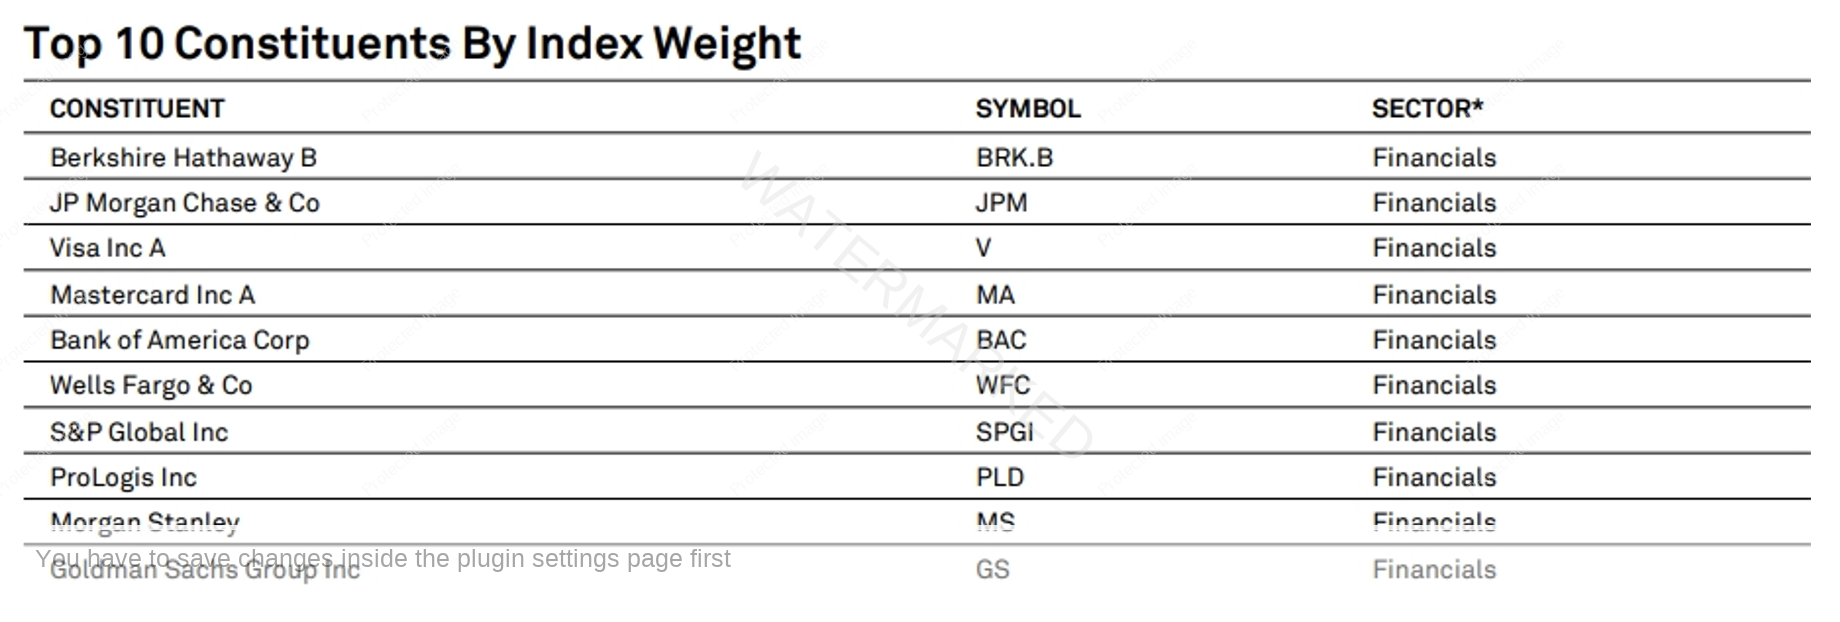
Unsurprisingly it aligns with the major economic events of the last 15 years, the GFC saw the price action fall 81% from the 2007 highs to the 2009 lows. The Covid drop was 41% but occurred in such a short space of time its hard to think of a more powerful decline. This index comprises 225 of the top US financial stocks and a quick grab below shows the top 10 holdings within the index. All could be described as household names.
Given that the 225 stocks that underpin the movement of this index operate independently and the participants within these stocks have competing ideas, we probably shouldn’t see any price or time activity that repeats. Remember markets are said to be random and not have patterns or signals that can be used for analysis.
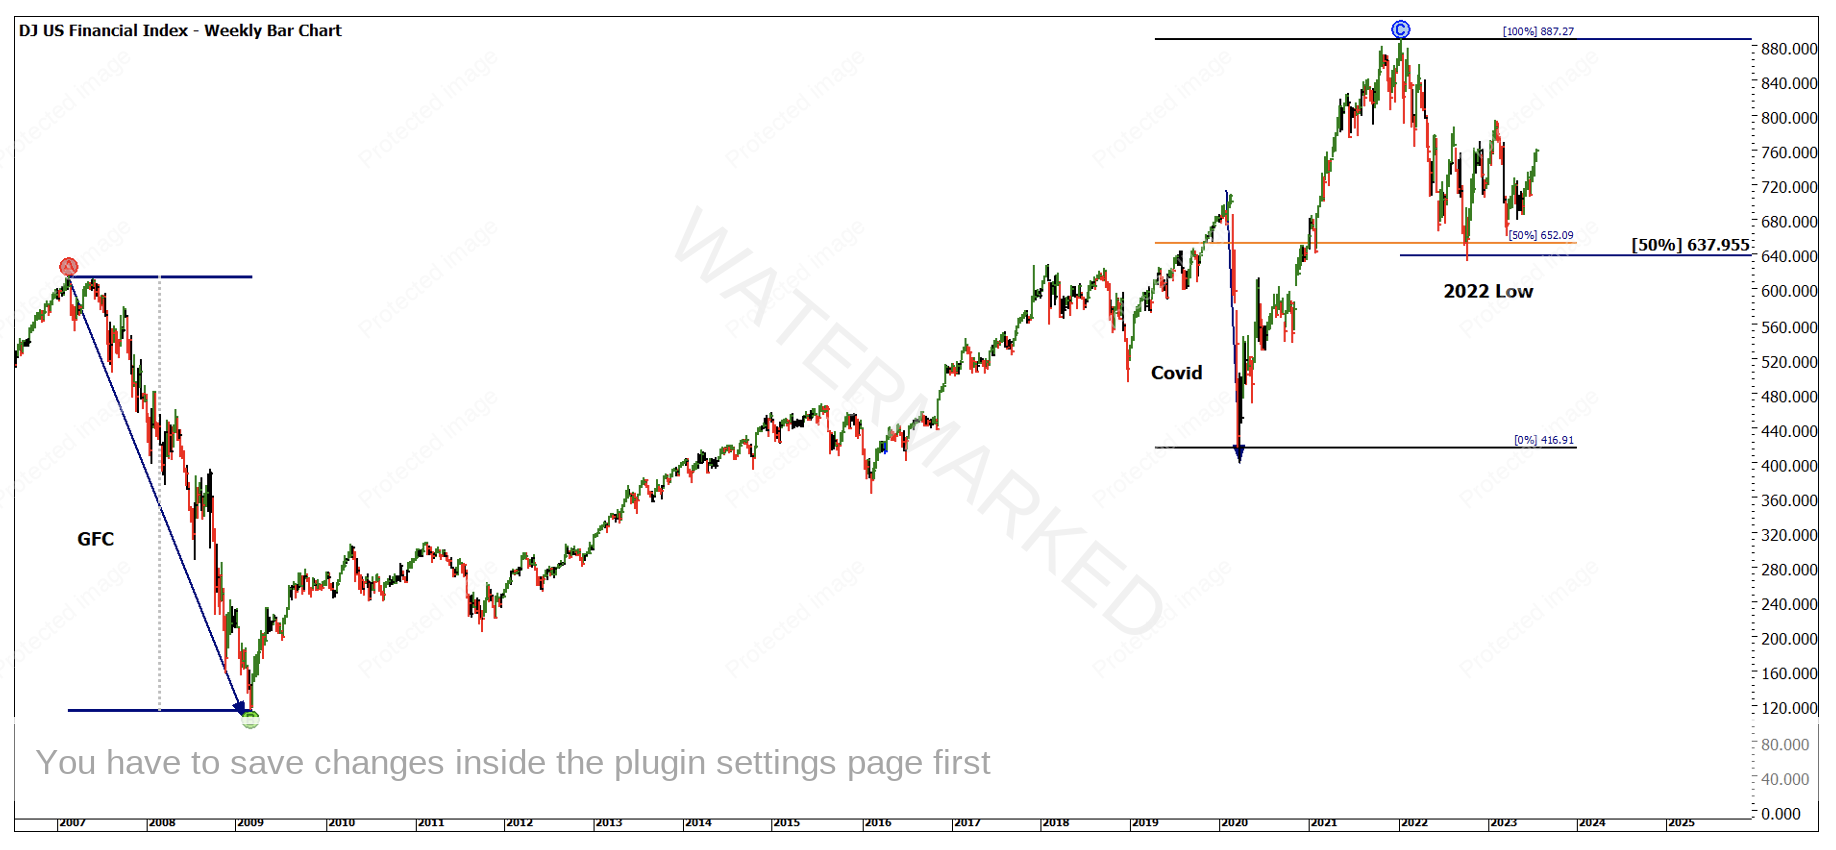
Chart 2 uses price techniques to provide a price cluster for the 2022 low. Using a repeating range and a Ranges Resistance Card we see two 50% levels align around our 2022 low. There are many more techniques in price alone that can assist us here.
Chart 2 – Weekly Bar Chart DJUSFN
These big picture techniques can assist with identifying the big rocks on the path and we can then zoom into more techniques to understand the small picture. I am the first to admit that identifying the 2022 low in this article is hindsight focused and not relevant to a trade today.
However, using these techniques this time last year could have had you well prepared for potential opportunities. If we can anchor the major low of the year in Price, we can begin a strong campaign of trading.
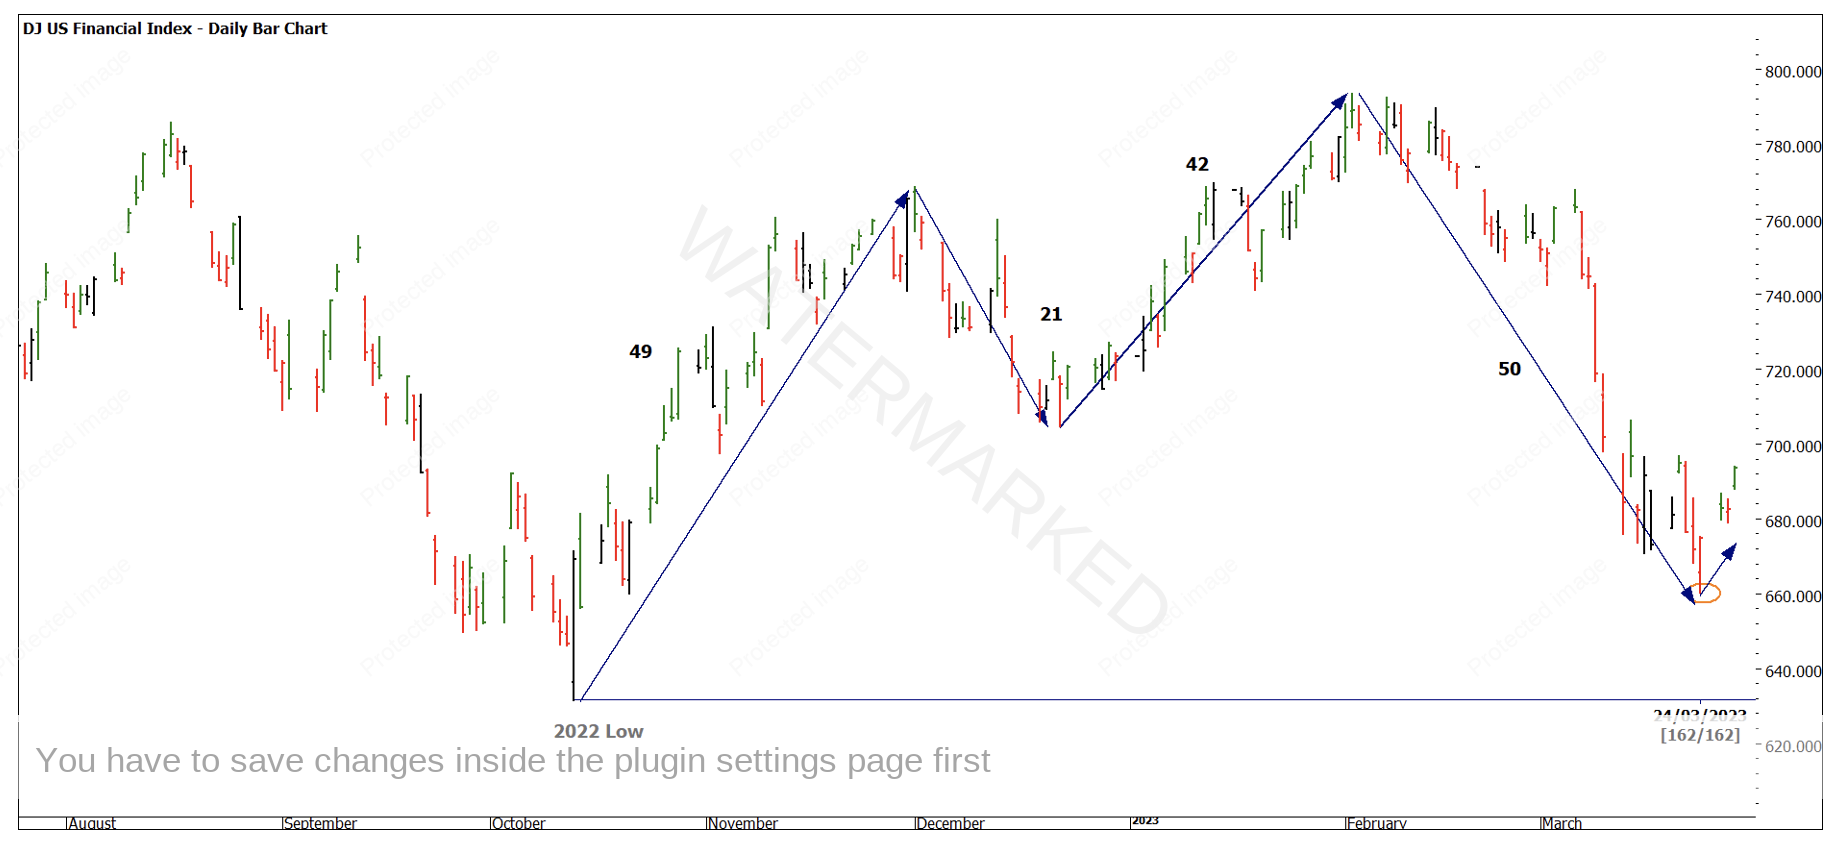
Assuming you were not confident at that time to execute trades you can still apply that as an anchor and watch for history to repeat. Chart 3 steps ever so slightly into the 2nd Dimension of Time and using a simple day count strategy we can measure from the low in 2022 and watch if time counts repeat. As with price if we can see 50% and 100% repeats then we can use history as a yard stick.
Chart 3 – Daily Bar Chart DJUSFN
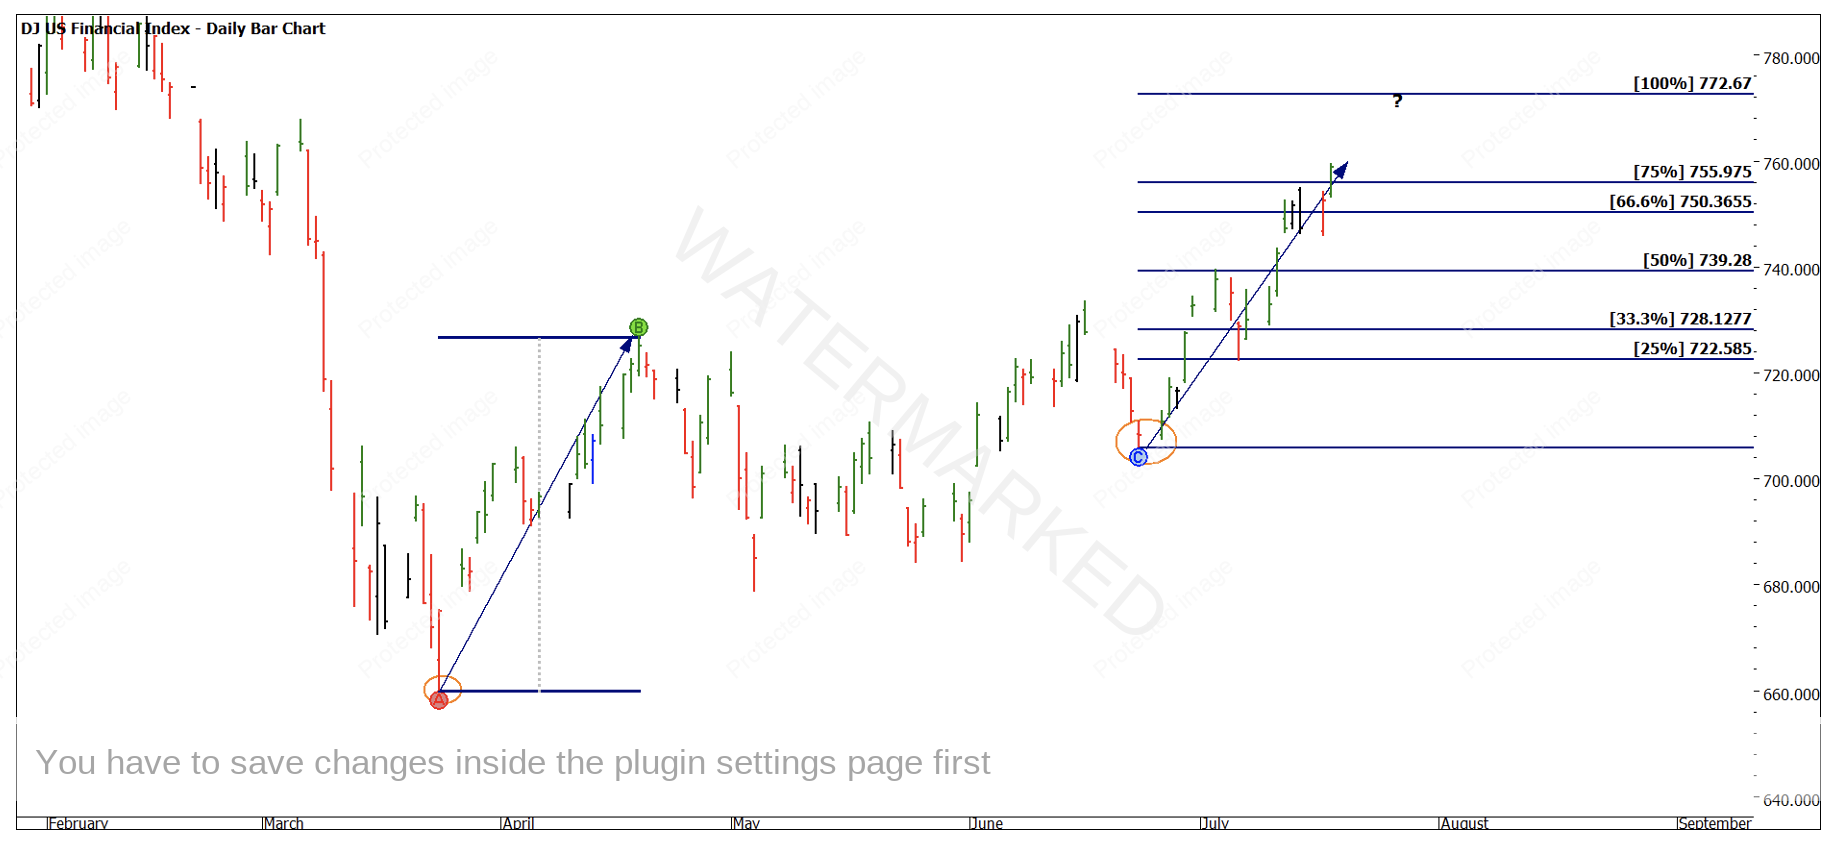
The final chart, Chart 4 shows the two best moves to date in 2023 highlighted with arrows, they are March and June.
Chart 4 – DJUSFN
The current move may have a little more juice in it to reach the 100% price point from the range that occurred in March this year.
Simple things done well can be all you need to unlock opportunities; the best trading plans are ones that are repeatable and consistent. As much as the news is doom and gloom there is always opportunity.
Good Trading
Aaron Lynch
