Finding Clarity in Chaos
As I always do before I pen an article for our community, I attempt to put myself in the shoes of a less seasoned trader and ponder what the market may be saying to them. I am getting a little tired of opening each article with a comment on how things seem more chaotic and stranger than the last time.
I can offer no understanding or insights into the global turmoil that we are witnessing, I have been reminiscing ahead of my eldest sons 21st birthday how smart it was to bring children into this environment but then think of the joy and happiness that he has brought and realise I am just a cog within a bigger wheel and when it all seems a bit much we are best to keep it really simple.
Of course, simple is a relative term to the individual, for me its controlling what you can and leave the rest to the smarter people.
For many reading this, price may be your analysis tool of choice, in times like this I can’t help but comment on the power of time. We have seen recently on the Australian SPI 200 the value of a working knowledge of seasonal time. For those who are not there yet, understand the 23rd of March was a time to watch for a possible turning point and has again delivered in spades. I feel buoyed that Darren, Gus and I were all on this area as a place to watch in our recent coaching live sessions.
Chart 1 shows the SPI 200 and the recent declines and reversal out of the 8400 level. The low I have circled is the 23rd of March and in turn you can add some Time by Degrees analysis around that if you are looking for some “time pressure”.
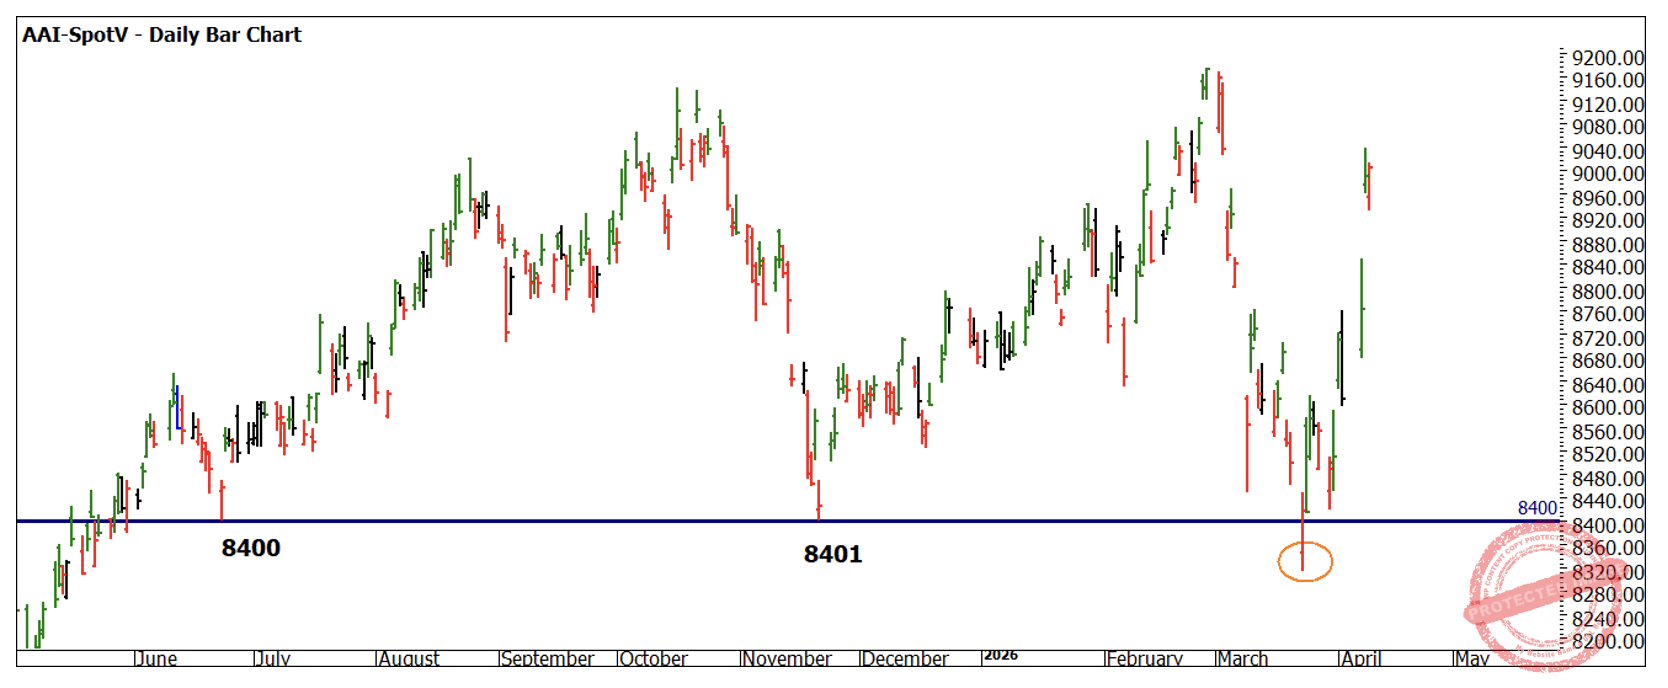
Chart 1 – Daily Bar Chart AAI-Spotv
The 8400 level could be argued as support and the recent move under this level was essentially a false break followed by a first higher bottom. Gann’s safest place to buy, Chart 2, highlights what I consider the subtle sign of a change, I have marked the swing up with a blue arrow and is what we refer to as an Overbalance in Price.
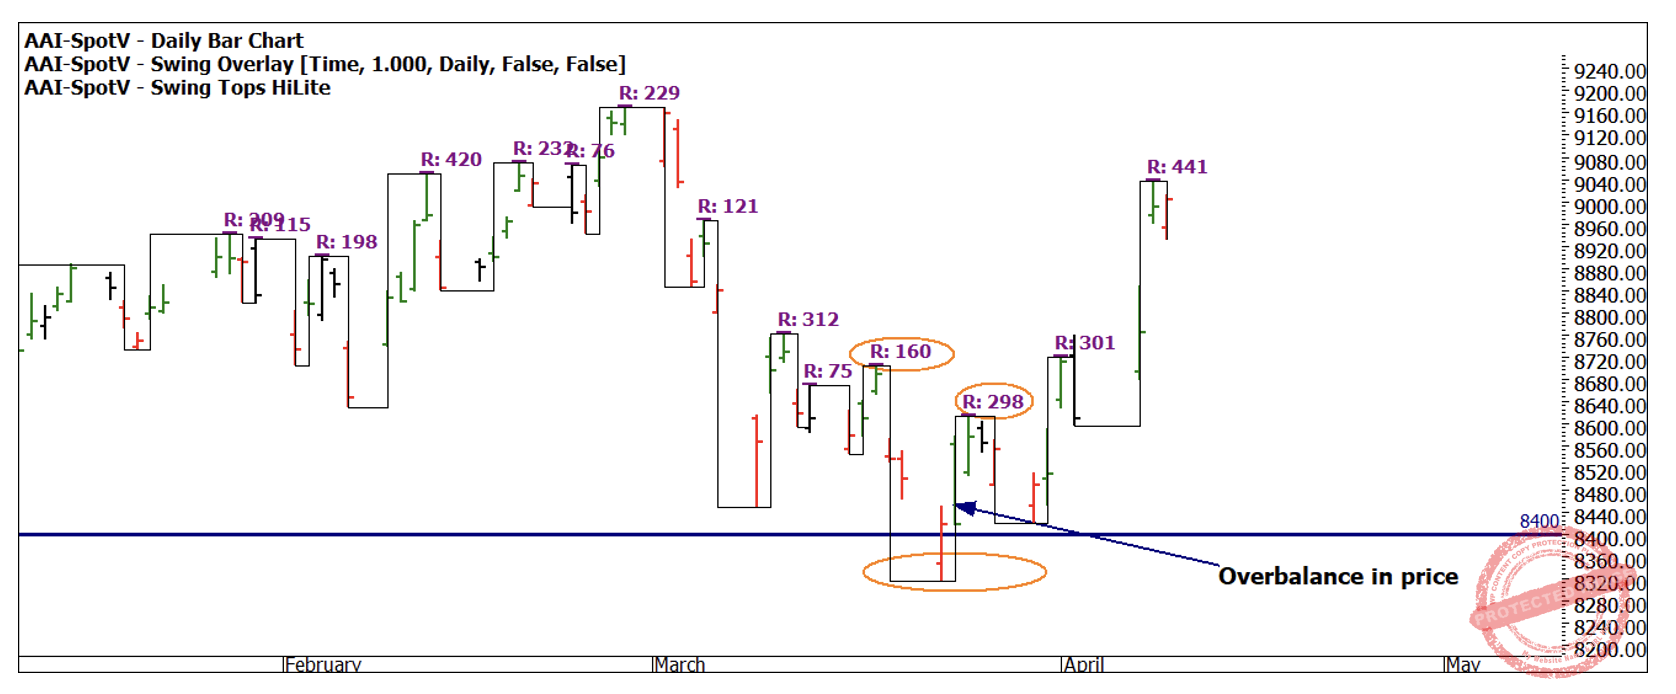
Chart 2 – Daily Bar Chart AAI-Spotv
If we combine price support, around seasonal time, followed by a first higher bottom with an Overbalance in Price then it’s quintessential Gann, and very much a Classic Gann Setup even before you add more confirmation.
Chart 3 add some additional context with the B to C range offering an open close reversal pattern at the 50% level of the small A to B range. Whilst this cannot be classified as a legitimate ABC pattern it certainly is valid as an advanced ABC pattern.
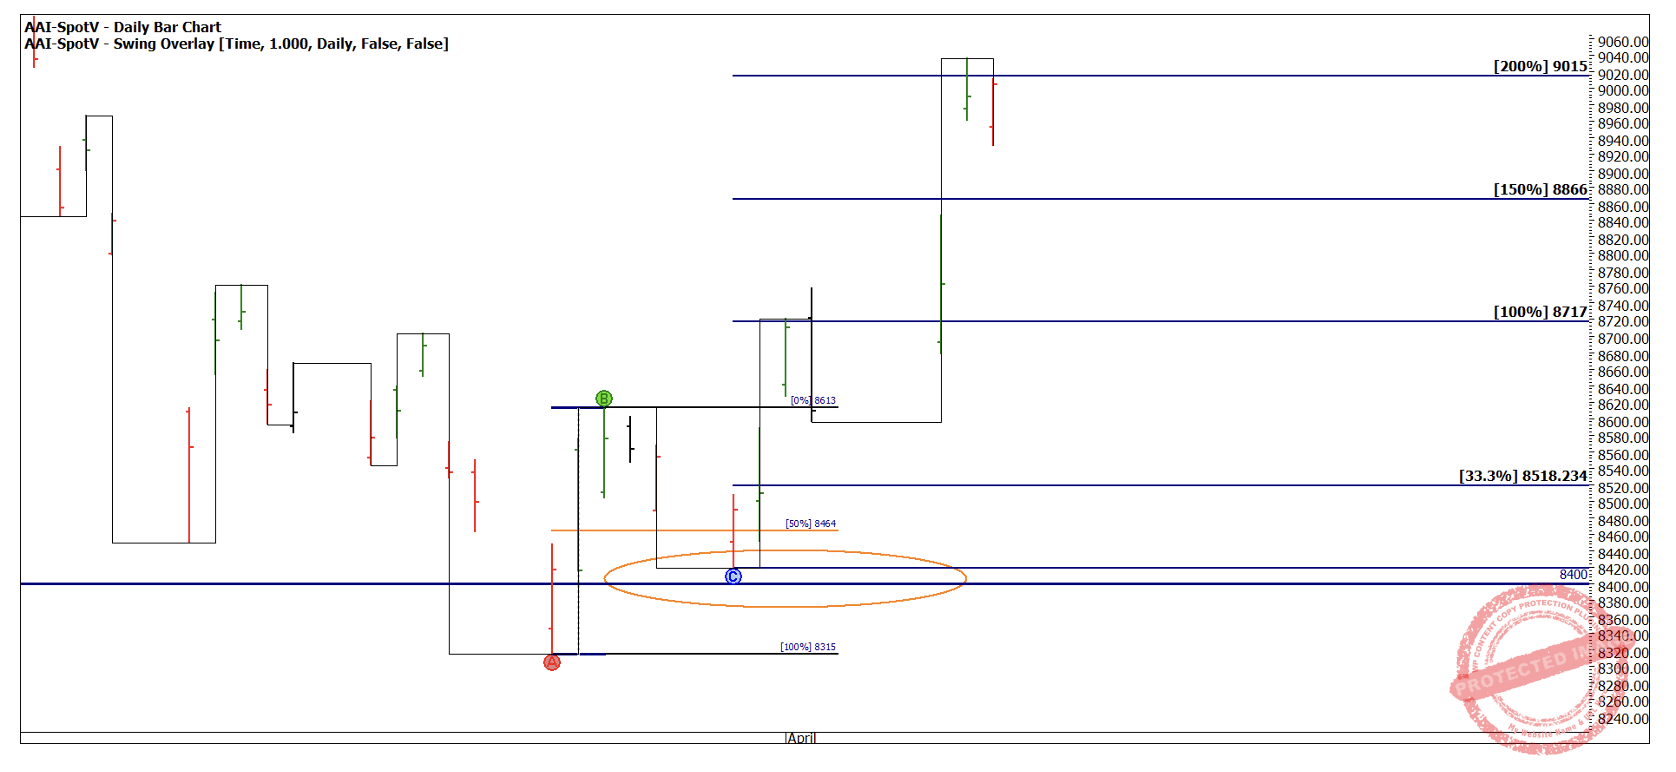
Chart 3 – Daily Bar Chart AAI-Spotv
Chart 4 adds some context of the bigger picture mainly around the bearish ranges off the double tops and if they were possible coming an end.
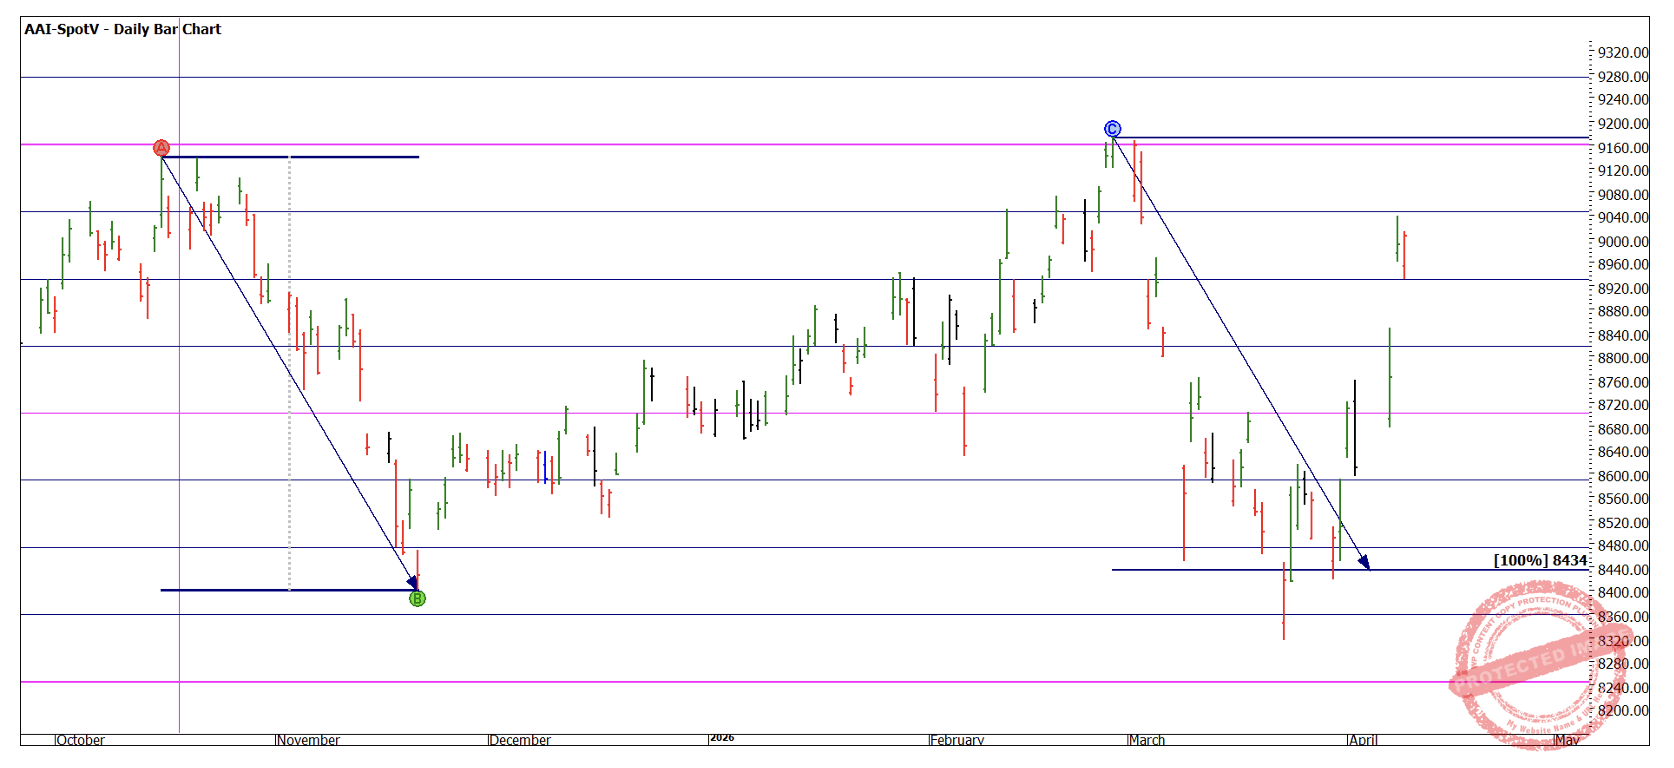
Chart 4 – Daily Bar Chart AAI-Spotv
You will notice that the A to B range (737 points) has repeated into the March area and the first higher bottom at 8419 on the 30th of March was a 100% repeat within 10 points or so. I have added a speed angle in blue as a visual reference.
The pink lines represent a Lows Resistance Card using the All Time Low of 458. The blue lines are 25%, 50% and 75% multiples and can provide opportunities for support and resistance. I will be watching closely if we reach the previous highs as they identify interesting levels.
If you are looking for some analysis homework you should be looking to see what other price analysis supports the area around 8400. There are several meaningful analysis techniques that should support your endeavours here.
As of the close, this setup has delivered approximately 500 points on the long side with approximately35 points of risk using an intraday entry.
I appreciate for some this may not seem the simple setup in their eyes, as for the works of David and Gann this is a straightforward use of price (and some time) bolted onto our swing trading system. The noise will continue to dominate the headlines, but I encourage you to turn off where you can and look to the charts for the road ahead.
Good Trading
Aaron Lynch