Flying Along
Welcome to 2026 and I trust you had a relaxing and peaceful end to the year, and we now find ourselves looking to the year ahead with a clean slate and measurable and achievable goals. The year is already shaping up with volatility as the general economic and geopolitical landscape is best described as complicated.
The anchor we must hold onto is the goal of identifying high reward to risk ratio setups and in its simplest form we can call these classic Gann setups. The elements of these setups are somewhat a recipe that builds to a final dish, each trader will have a different way they may put the dish together and how they present the final product. The variable that we all bring to markets is ourselves and trading can often be a mastery of oneself as opposed to the markets.
I wanted to mention that you should take the time this month, to review a number of markets across asset classes to get a sense of some of the movements we are seeing. There has been considerable movement in precious metals, currencies, and in particular the US Dollar Index has tilted to the downside as well as the bond markets. These are all interlinked “behind the scenes” even though we may not be seeing significant movements in stock indexes.
Our job is not to determine how the large blocks of capital are moved around asset classes but to identify the opportunities and be nimble enough to exploit them. I continue to focus my attention on the stock Boeing as it moves sharply to the upside. We have seen in the last week the first movement against the trend of 3 or more days. How we interpret this and what’s next is the question before us.
Chart 1 shows how the 50% milestone of the 2019-2020 range has been a guide to where tops can form.
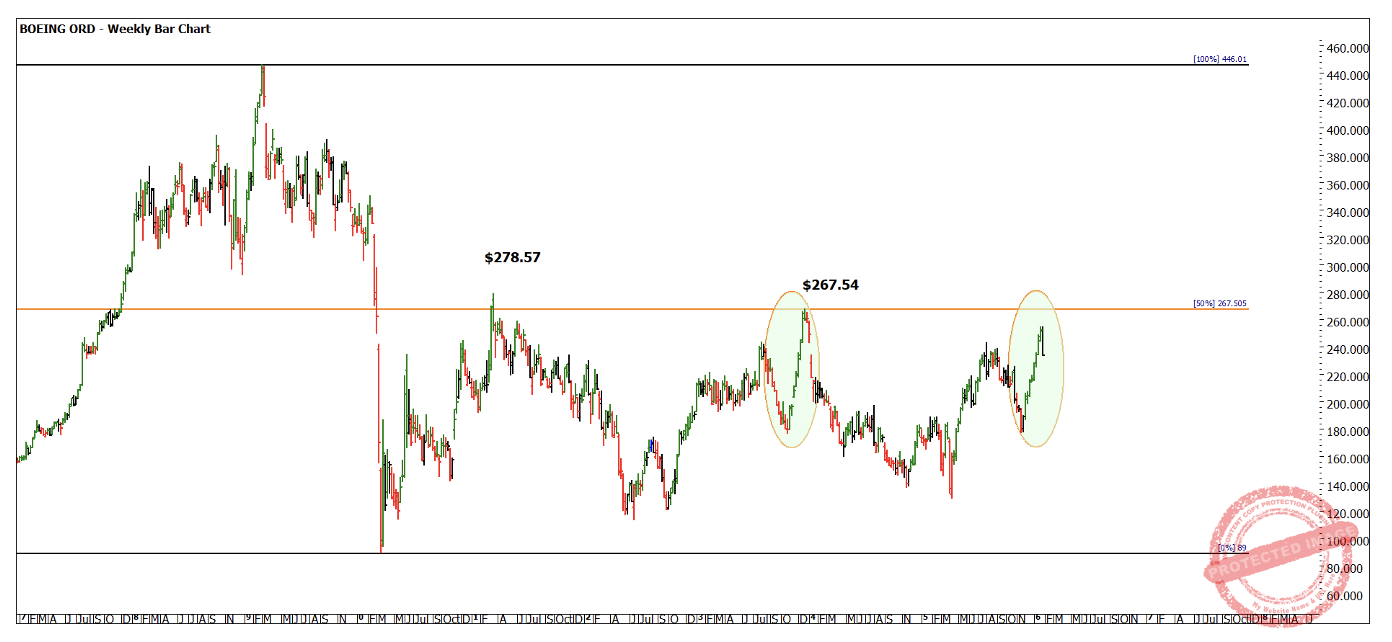
Chart 1 – Boeing Weekly Bar Chart
When looking at the patterns a market can provide, it may be worthwhile studying the bullish runs circled on the Chart 1. I have included Chart 2 as an insight into how markets can ebb and flow in similar ways to previous sections of the market, simply history repeats.
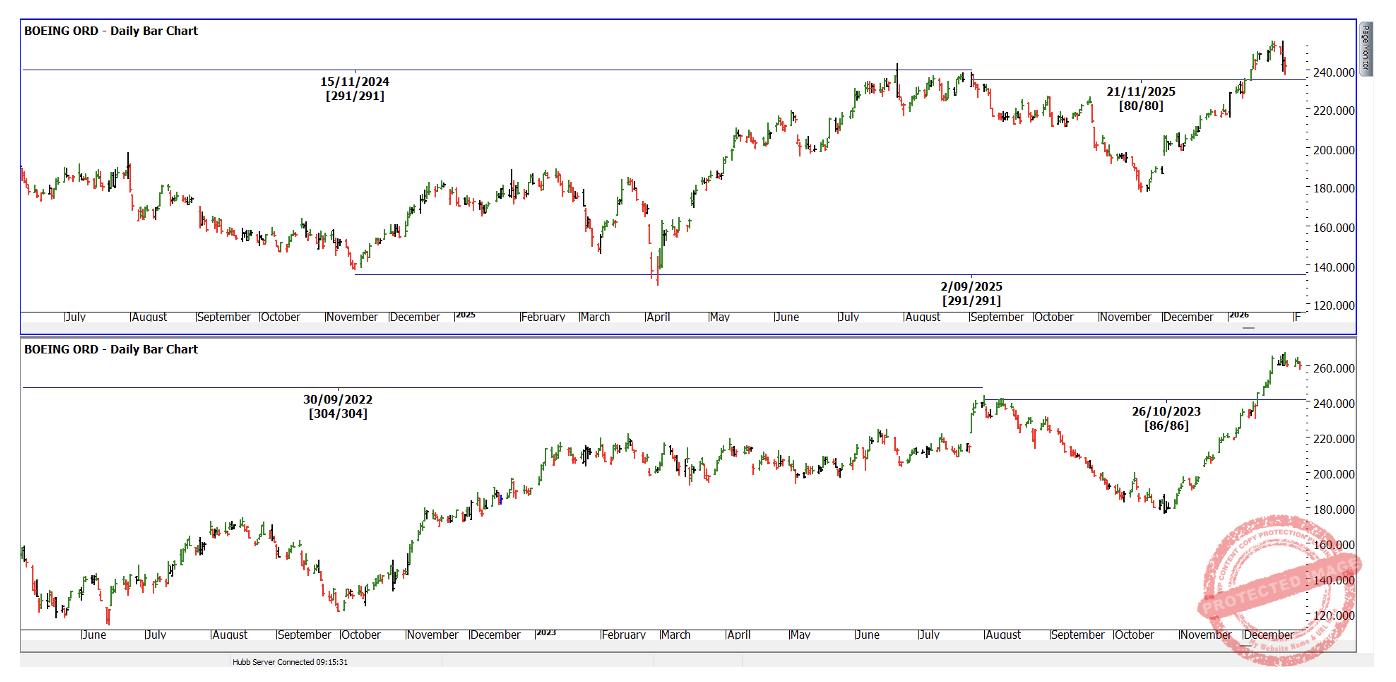
Chart 2 – Boeing Daily Bar Chart
Chart 3 highlights analysis we would undertake to understand the previous moves from major lows and highs.
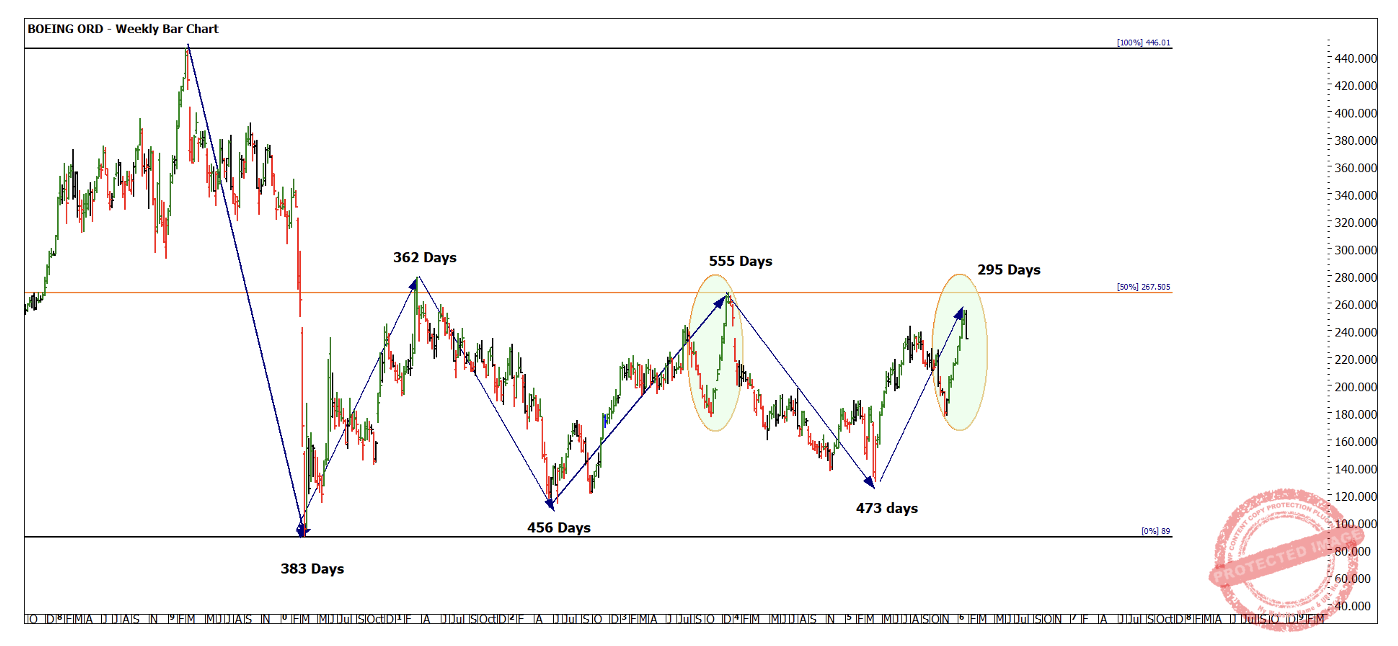
Chart 3 – Boeing Weekly Bar Chart
If we continue the process of measuring with a different take, we look at the time frames from bottom to bottom and top to top. I always suggest starting on the bigger turns and working down to counts between daily swing tops and bottoms. If you are not gaining clarity using the larger turns, it’s unwise to start heading into smaller counts as this will likely add more complexity and less clarity.
The time frames in Chart 4 are worthwhile examining to understand if there is some harmony in the numbers.
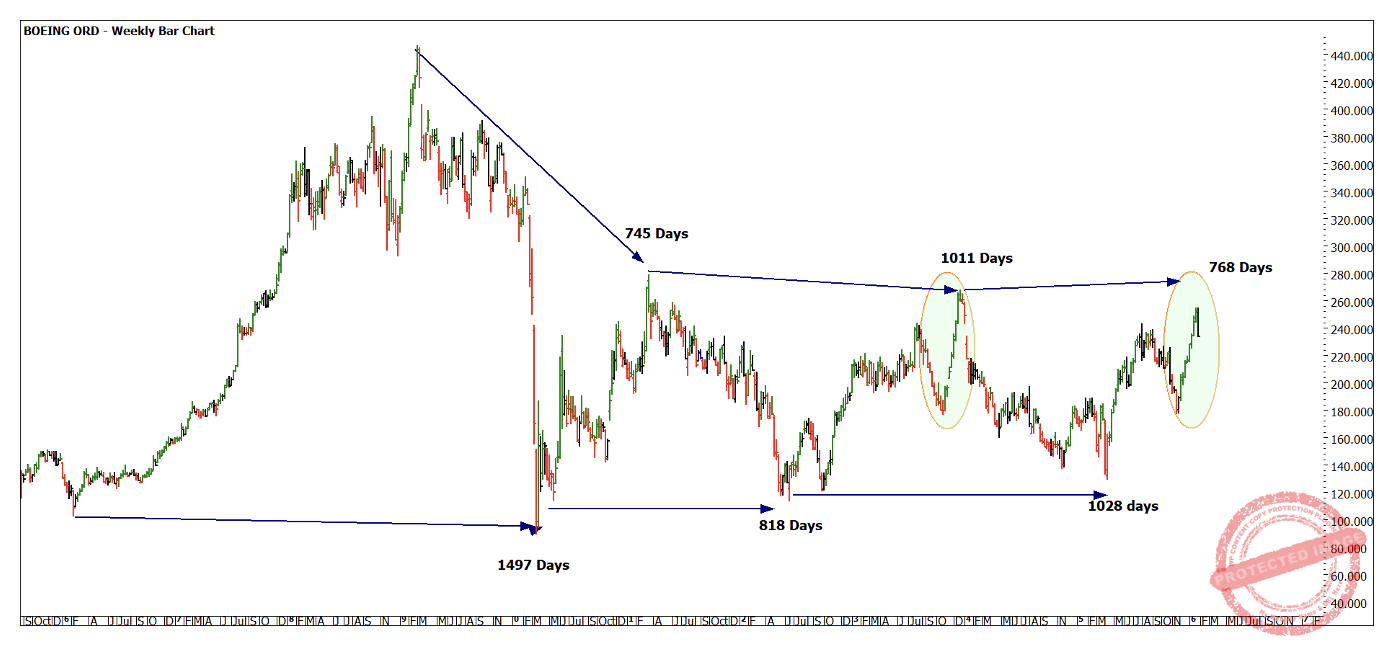
Chart 4 – Boeing Weekly Bar Chart
The third dimension of time and price always acts as a strong foundation for strength and weakness. The final chart shows a Lows Resistance Card as a square. This means that the low of $89.00 in March 2020 can be used as a strong anchor.
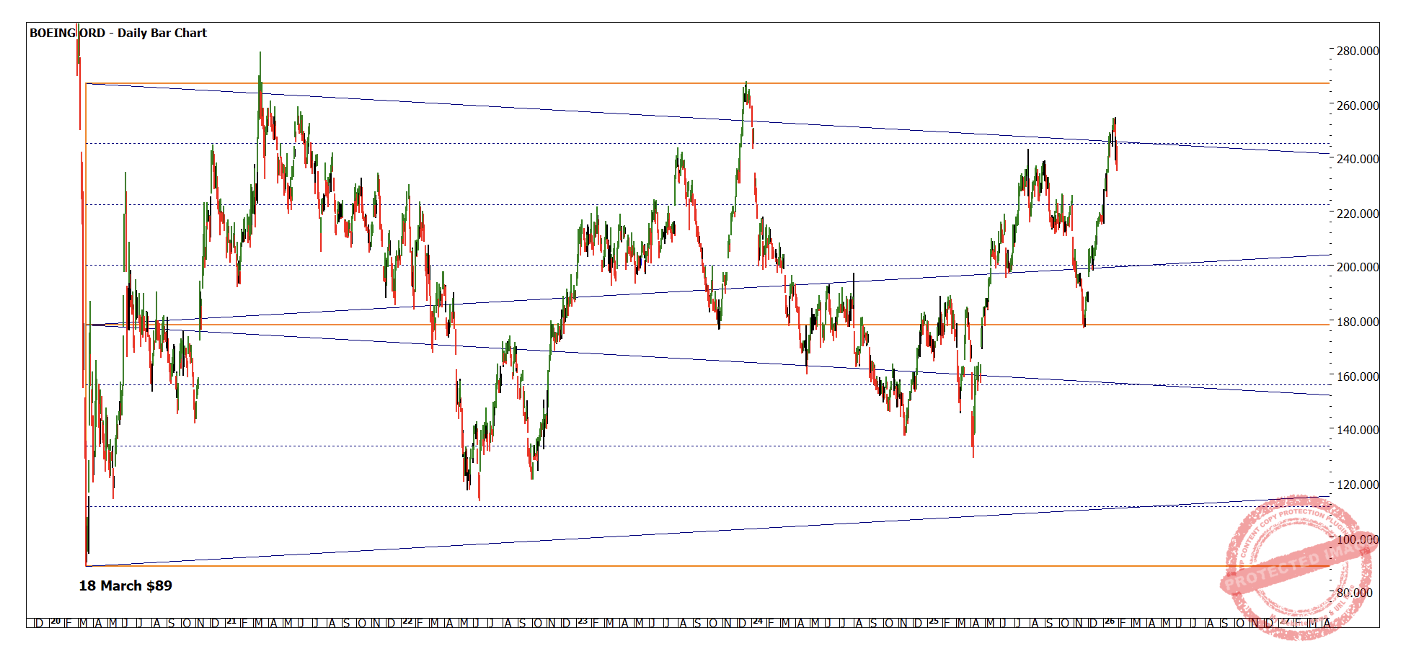
Chart 5 – Boeing Daily Bar Chart
The orange lines are full repeats in price of the low, they have been of assistance to us in this cycle. Then we can use as a square to understand strength and weakness, and this can act as an overlay to our other analysis.
With these charts we can start to build some clusters for potential future turning points.
Good Trading
Aaron Lynch