Flying Solo
David Bowden and W.D. Gann both emphasised the power of following the trend. Amongst all the jargon being fed to the public by the media, Gann specifically said in the Stock Market Course to:
“Remember that stocks are never too high to buy as long as the trend is up and they are never too low to sell as long as the trend is down. Never sell short just because the stock is high or because you think it is too high. Never sell out and take profits just because the price is high. Buy and sell according to definite rules and not on hope, fear or guesswork. Never buy a stock just because the stock is low. There is usually a good reason why it is low and it can go lower.”
A number of markets have recovered considerably from the COVID Crash and have broken into new all-time highs. But where does that leave the other markets that have failed to recover? Gann goes on to state that after a sharp decline in a short period of time:
“Usually follows a rapid advance and the first sharp declines which may last from one month to as much as seven weeks usually corrects an overbought position and leaves the market in position for a secondary advance”
Let us take Qantas for example. Fundamentally, due to COVID, the travel sector is on hold for at least the next 6 months. While Qantas may have a 14-month runway worth of capital, ultimately if COVID is still around in 12 months we may see the stock price tumble further – not to mention the earnings reports will be negatively impacted. I am not one to hugely make decisions on the fundamentals, however, if we can have these fundamentals lined up with our Gann Analysis it allows us to have both technical and fundamentals lining up in the same direction.
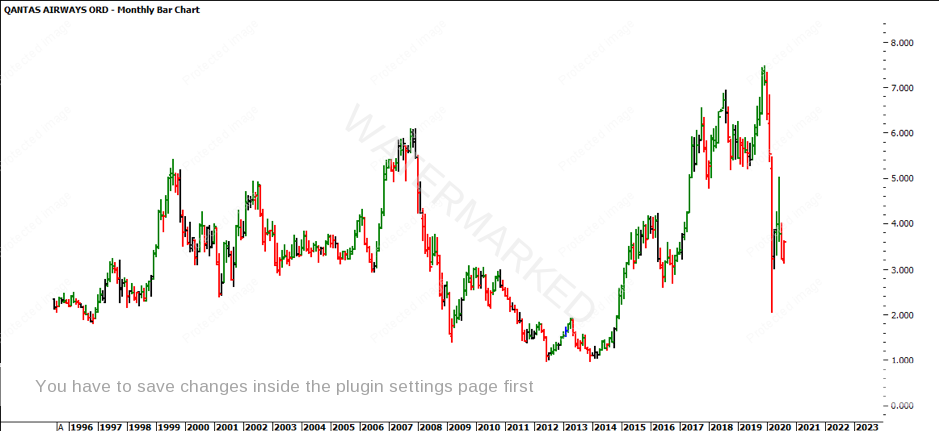
The chart below is the history of QAN. Since 1996 the market hasn’t typically moved out of the range of $7 and $1.
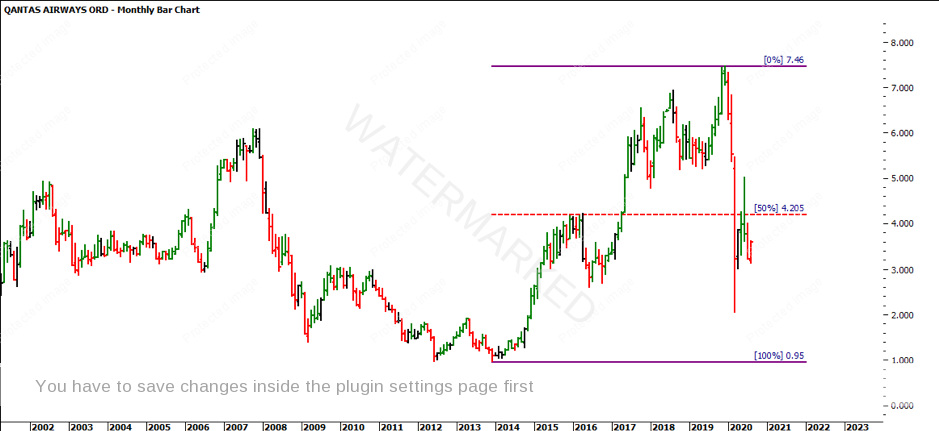
By applying a Ranges Resistance Card to the All-Time High and All-Time Low you can see that 50% is currently around $4.20. What is interesting is prior to the All-Time High in 2019 being made, the highs in 2015 hit their head on the 50% level.
The COVID Crash aggressively fell through the 50% level and this was followed up with a retest and closing below the 50% level. If you refer back to what Gann said in the Stock Market Course, usually after the first sharp decline (which may last from one month (March 2020) to as much as seven weeks) “usually corrects an overbought position and leaves the market in position for a secondary advance”.
We have seen the market produce some aggressive ranges, this is overbought and balancing out the COVID crash range that occurred.
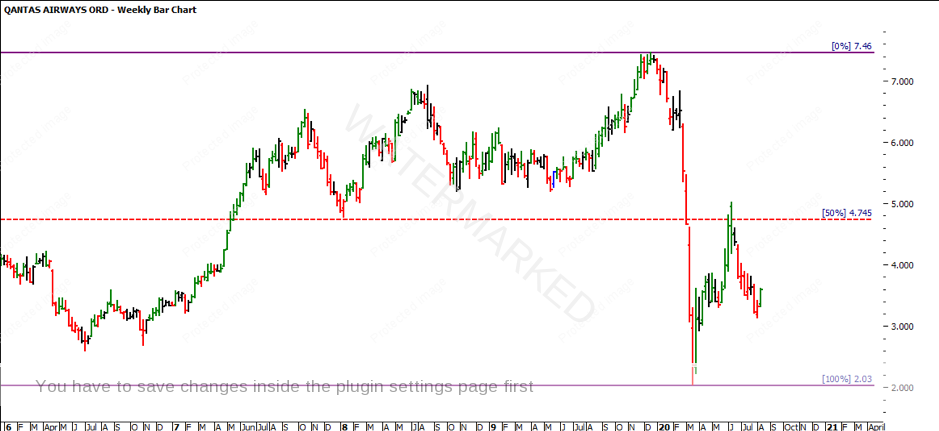
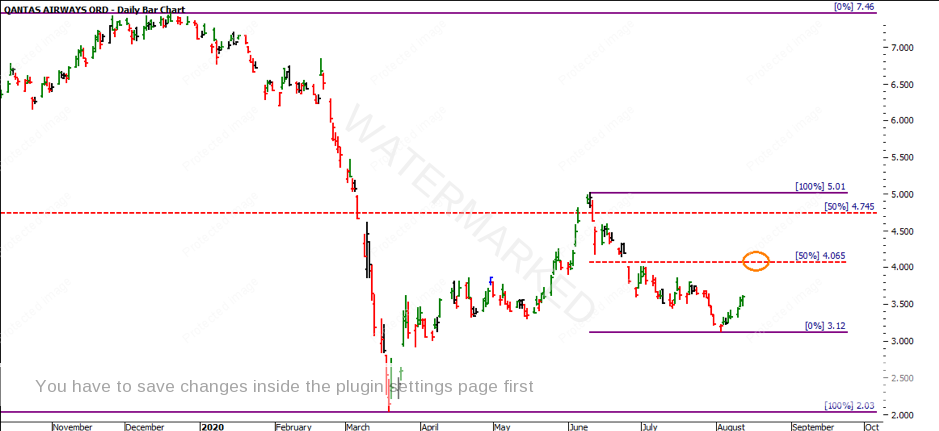
Zooming into the weekly chart, the market looks to be attempting a secondary advance. It is very early days but based off the analysis, what I will be watching for (without being too trigger happy) is a retest of the ATH/ATL 50% level at $4.74.
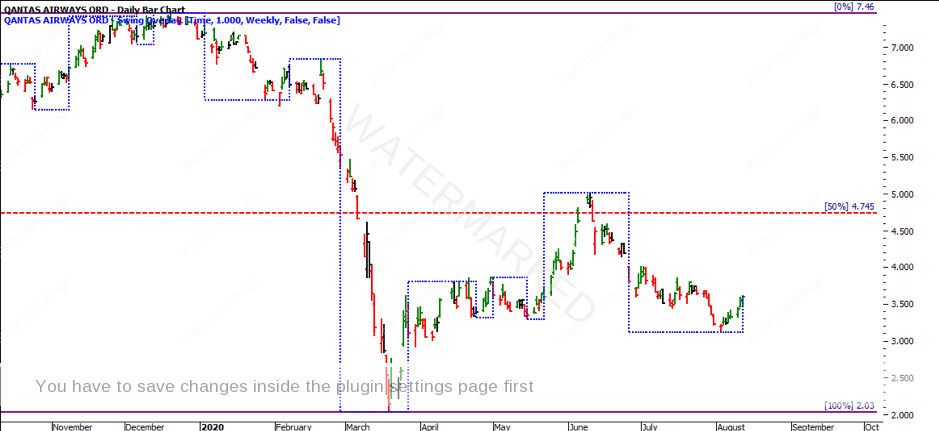
Looking at the weekly swing overlay chart, the weekly swing trend is currently uncertain, yet there have been signs of a weekly up bar. You will also note that there are three weekly lows at approximately $3.25.
Before worrying about the market hitting the 50% level at $4.74, the market first needs to get through the 50% of the retracement in order to provide the strength. As mentioned in the Smarter Starter Pack, if we see the market fail below 50% this will show signs of a weak market, hitting 50% we might see a change in trend, and a break through the 50% level we will have a high probability to retest the 50% level at $4.74.
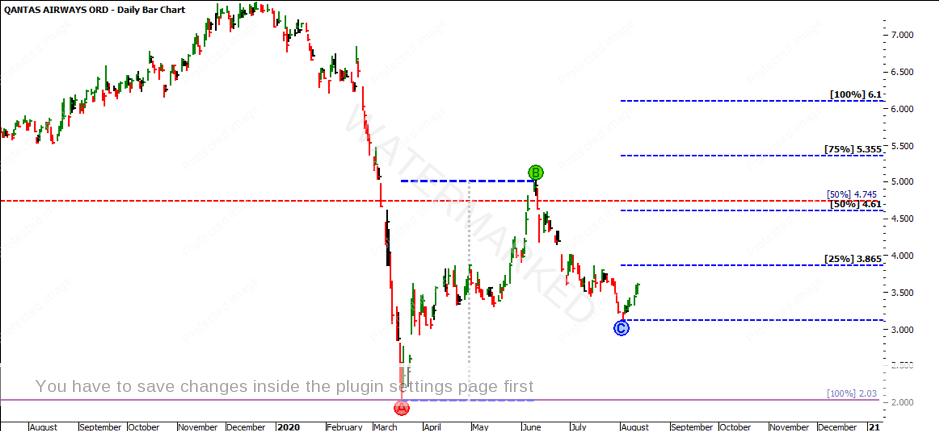
Now we have our prognosis, we can start to verify the likelihood of the market getting to that position. Take the First Range Out (FRO) from the COVID Crash and project this from the August low. You can see 50% lines up with the other 50%. If we start to see further clusters at this level, the probability that there will be a pivot at this level increases.
It’s Your Perception.
Robert Steer
