FMG – As Good As Gold?
Welcome to the August edition of the Platinum Newsletter. Last month I wrote about how adopting a consistent process with something as simple as keeping up a trading calendar could be one way to help stay on top of important dates over a few different markets when applying Gann’s techniques of balancing time. The actual date I was watching produced a very minor daily swing top within a sideways period and for me didn’t line up with a Classic Gann Setup of any description. However, it’s the process that’s important and one I will continue to use over time.
One month on and the SPI has continued its sideways trading range, but we know that these periods don’t last forever and in my experience, the minute you look away and stop paying attention because you’re bored with the lack of a trending market, is exactly the moment the market is likely to take off!
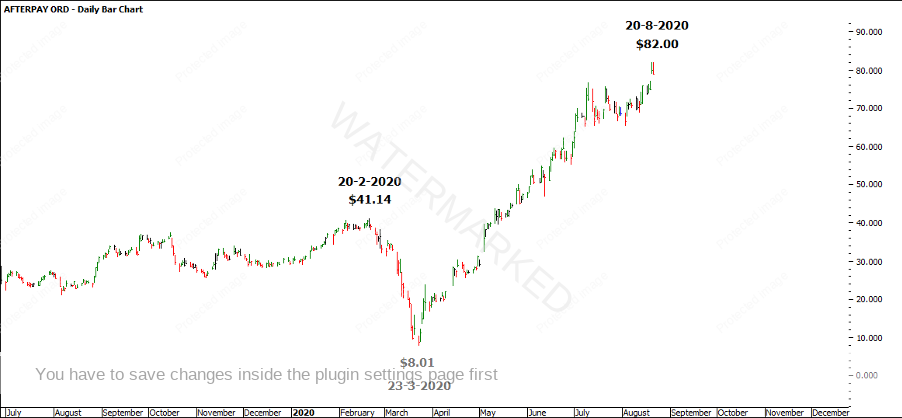
While some tech stocks have clearly been the best performers over the past five months, in our local market we’ve also seen some strong performers. The stock After Pay, ASX code APT has clearly been a high achiever which is now, at the time of writing, trading around $82, from a February high of $41.14 and a March low of $8.01, amazing!
Chart 1
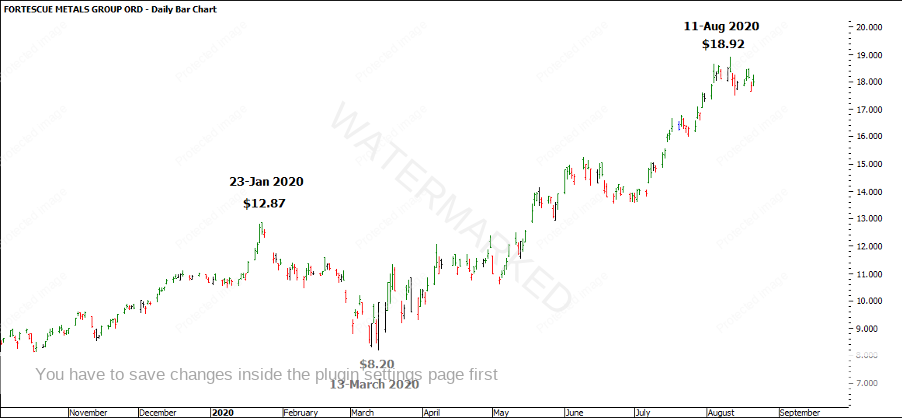
Now, something I hear a lot is how Gold is the asset class to be in during times of major uncertainty. Physical gold has definitely been a good performer as have some gold stocks, however, a local mining stock FMG which has built its brand on Iron Ore has also proved to be a strongly trending market. As always, I found it interesting to break it down using the Position of the Market technique to get an idea of where this stock is at.
Chart 2
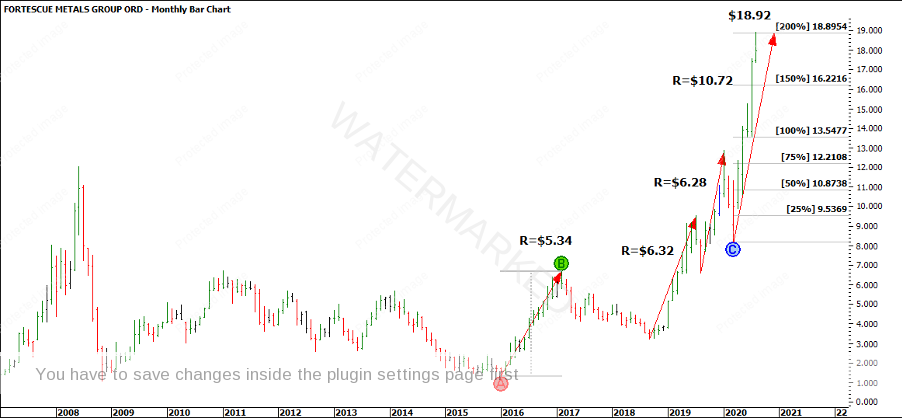
Looking at some of the bigger yearly or seasonal ranges like the large First Range Out from the January 2016 low, you can see the current run-up is within three cents of a perfect 200% of the First Range Out on a potential fourth section up. Although this is a little bit subjective, as you could start the sections count from the 2018 low, there is harmony there nonetheless.
Chart 3
This market has definitely paused at this level and is finding some resistance. But there are also a few other interesting things I found on this stock. Looking at the chart below at an Ultimate Gann Course level, can you work out what angle that is from the 2008 GFC top? Could you also work out how the current 11 August 2020 top relates back to the 14 February 2013 yearly high? And for anyone with the Master Forecasting Course can you see how the 11 August top could potentially relate back to the 21 May 2010 low?
Chart 4
There are plenty more ranges and other techniques you can apply here to see why the current top on the 11 August at $18.92 could be a potential headache for FMG. So what could we expect next? Well form reading shows we have expanding ranges to the upside on a few different time frames which we know is a sign of strength, so it would be nice to see this market confirm a sign of weakness by putting in a weekly Overbalance in Price to the downside followed by a failed re-test to the upside. As always, we are looking for all the elements of a Classic Gann Setup of Time, Price, Position, Pattern and Volatility to come together that fits in with our trading plan.
Happy Trading,
Gus


