FMG – Part Two
Welcome to the September edition of the Platinum Newsletter. I find that the consistent narrative of mainstream media can easily elevate my emotions and lead to a bias of short trading, whereas if I can keep my emotions in check I can happily update my charts and let the swings tell the story. I find this a much calmer and profitable approach to analysis.
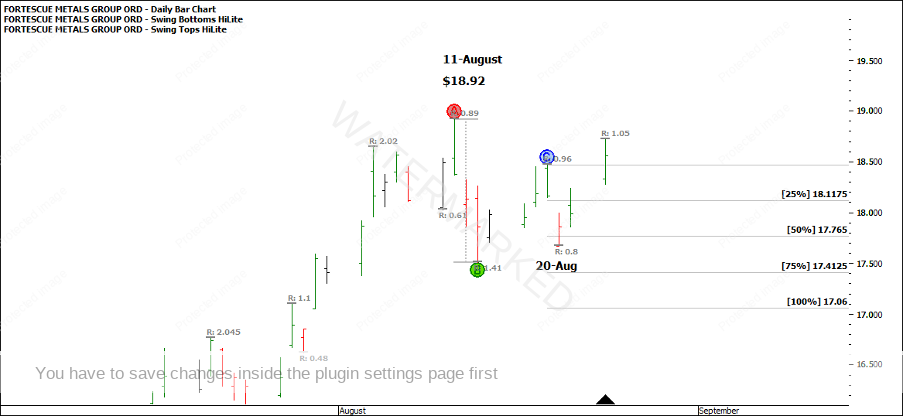
In last month’s article I was watching FMG as it was hovering around the $18 price level and using form reading for a signal to indicate more down side. Following the 11 August top was a first lower swing top entry signal after a contracting up swing and an expanding down swing. However, form reading could have prevented a losing trade. On 20 August, a first lower swing top was confirmed with a gap down on the open (of about 2.5%) to the 50% milestone. The market then spent the rest of the session going up. In my experience, this is a good enough reason to take my orders out of the market! David’s milestone chart from the Smarter Starter Pack says:
“DANGER ZONE 80% of trades that fail do it on this line”.
In this instance, the market was kind enough to gap down and rally off the 50% milestone as a warning.
Chart 1
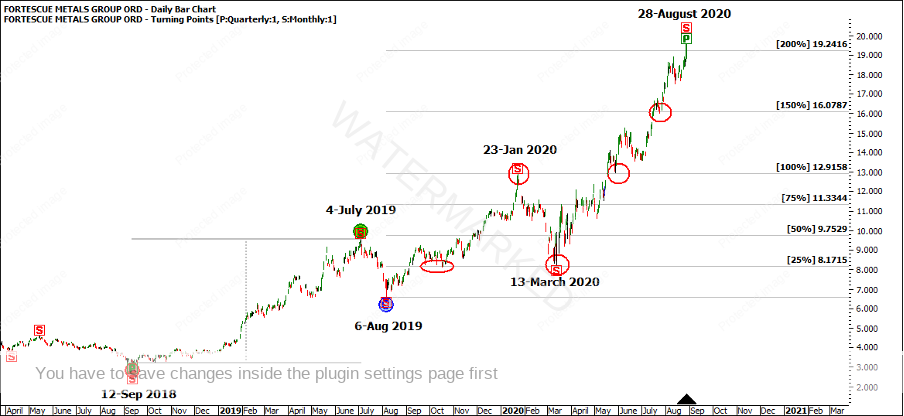
The market has since made a new high on 28 August at $19.56. Was it possible to call this top? Back to the swing charts, 200% of the monthly First Range Out from the 2018 yearly low gives a price target of $19.24, with key milestones being respected on the way up.
Chart 2
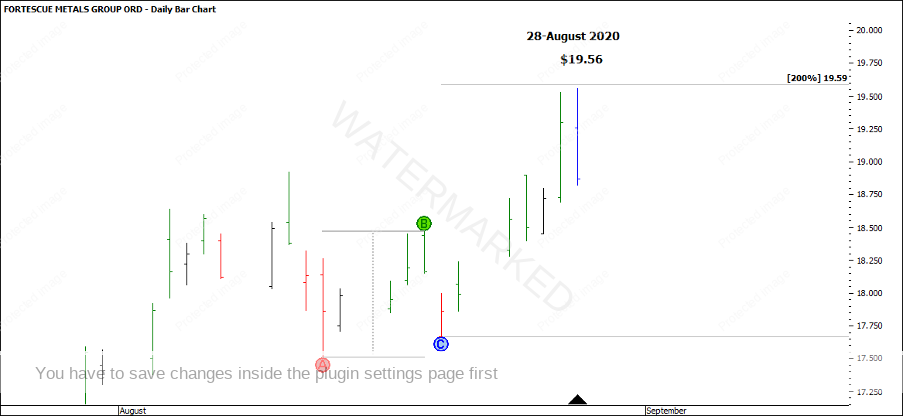
200% of the last daily swing gives a price target of $19.59.
Chart 3
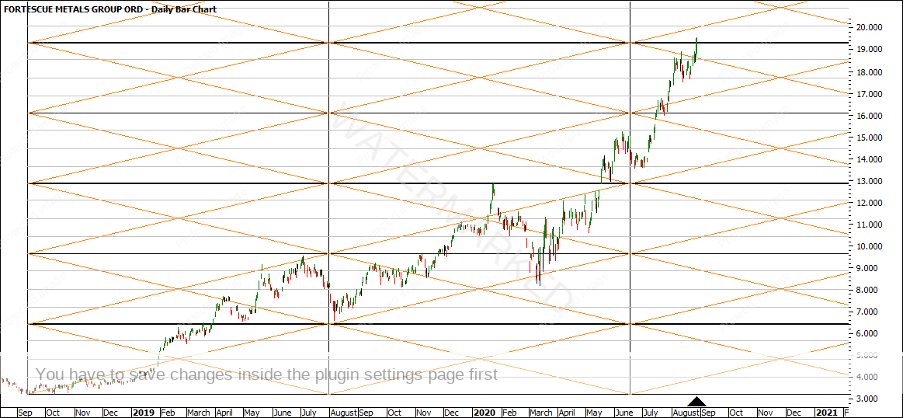
A 2018 Lows Resistance Card gives a price target of $19.32.
Chart 4
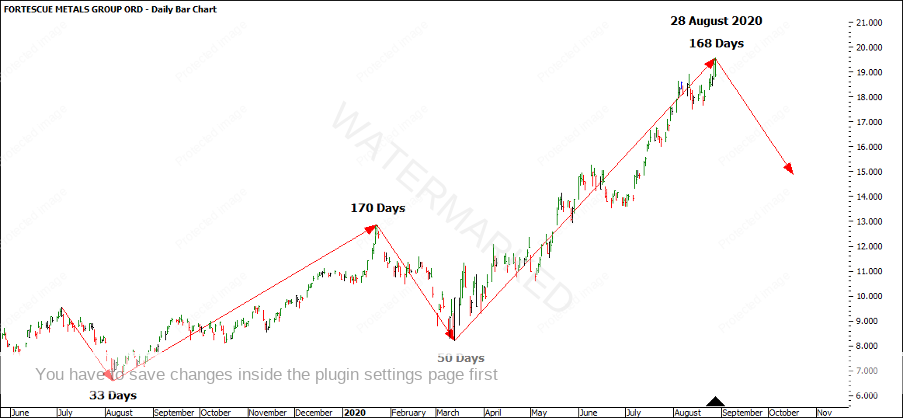
Time analysis on monthly swings shows an expanding time swing down of 50 days compared with 33 days, and a contracting monthly time swing up of 168 compared with 170 days which makes it only 2 days short of a nice balancing of time. 168 should also be a very familiar number!
Chart 5
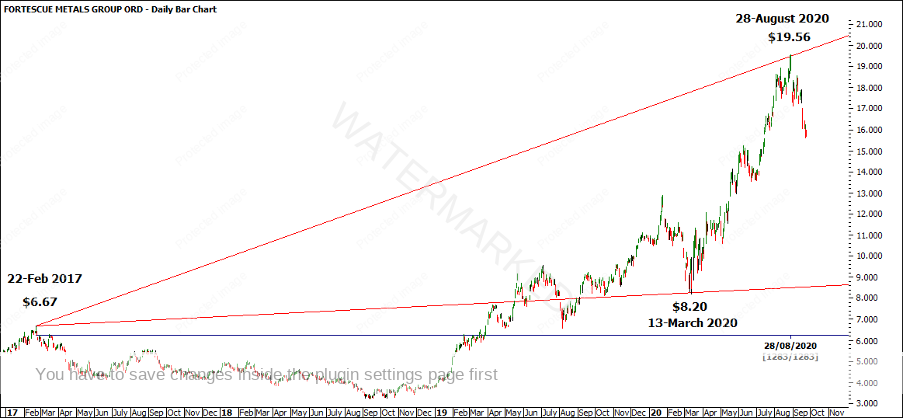
There are 1283 days between the 22 February 2017 top of $6.67 to the 28 August top of $19.56. At one point per day, the 28 August top squares out time and price at $19.50, within 6 cents of the current high! Also running a different type of 1×1 from the 22 February 2017 top called the 13th March low to within a couple of points.
Chart 6
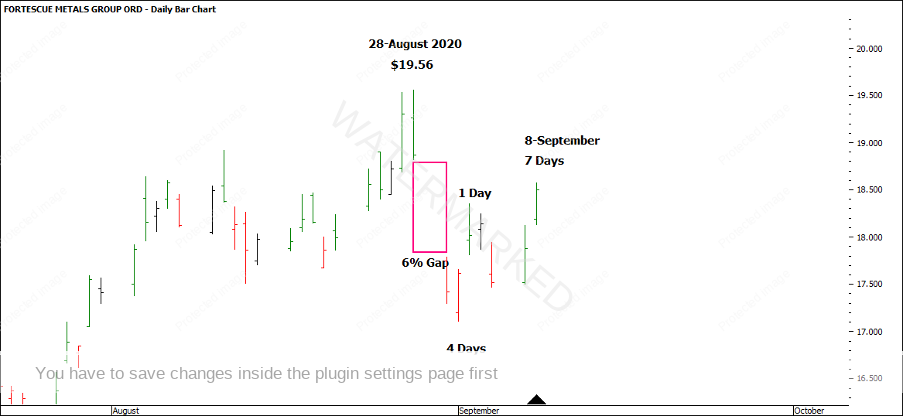
I think we are definitely building a case for a Classic Gann Setup with Time, Price, Position, Pattern and Volatility! Trading this setup did present its fair share of challenges. After a nice signal bar on Friday 28 August, the Monday opened up with a gap down of about 6%. Not ideal!
Chart 7
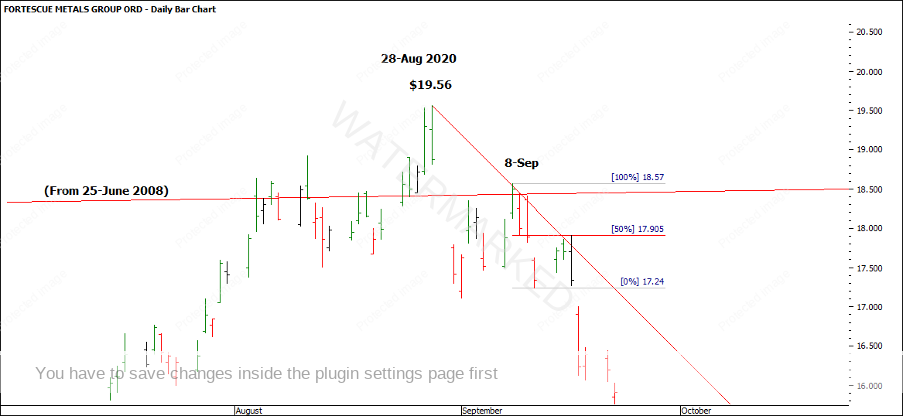
The first lower swing top entry was a time sequence of 4 days down 1 day up into a 50% retracement which failed. However, what makes 8 September worth a look? Apart from being 15 degrees 48 minutes (which makes it a Green Time by Degrees date), it’s also nearly 200% in time back up (4 down, 7 up), and a contracting daily swing range into a gap not filled. If you were still watching that angle from 25 June 2008, the market couldn’t hold it. Also, if you know your Form Reading chapter well out of the Ultimate Gann Course, check out which angle that is (hint in Chart 5) running out from the 28 August top that squared out the 8 September top to within a few cents and then again on the next lower swing top.
Chart 8
I think it’s a great time to be comparing the current monthly swing down with the previous monthly swing in that direction to rate the strength of the current move and to gauge if this is just a B-C range or a new A-B range!
Happy trading!
Gus Hingeley
