Form Reading Fast Moving Markets
Chaotic, wild, and emotional could be a few words to describe the past month’s movements on global indices, currencies and some commodities. I came to trading at the end of the GFC in 2009 so this is the first time I’ve witnessed firsthand such a dramatic axing in the markets. It was nice to get in short on the day of the top and capture some of the run down, however in hindsight I bailed out too early leaving some good profits in the market. I think that’s good feedback about where I’m at as a trader and reminds me how emotions can get in the way of good analysis.
On a positive note though, being out of the short position makes it easier to take a step back to get a better perspective on the market. The key technique of discussion in this article is Form Reading, and how it could be applied to help read this current market.
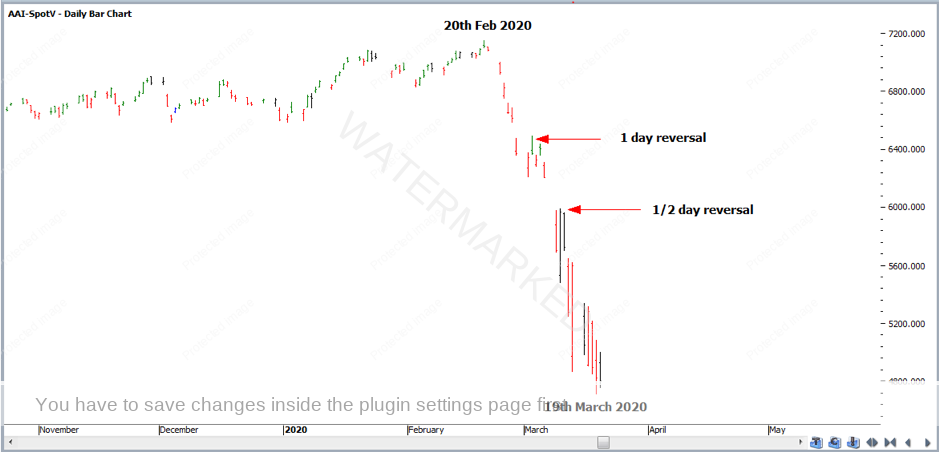
If you look at Chart 1 below of the SPI, you’ll see this market hasn’t done more than a 1 day rally out of its 20 February 2020 top. On page 28 of the Ultimate Gann Course, David says:
“A market that is only doing two-day reversals is trending strongly. Once a market starts trending strongly, one of its very evident features are the small reversals”
We’ve definitely seen a strongly tending market! I’m writing this exactly one month on from the current top and the longest rally we’ve seen is 1 day up in a move that’s done about 2,500 points!
On page 30 under the heading Overbalance in Time, David then talks about how to form read the market by counting the days with the trend and against the trend.
“Something as simple as just keeping track of the days in each reaction and thoughtfully comparing that number with the size of subsequent movements, will put you way ahead of most in the market”
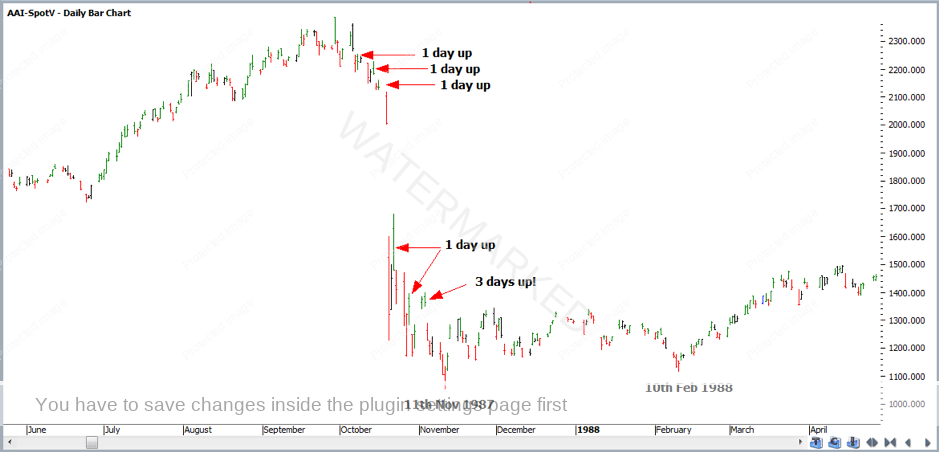
In Chart 2 below, I’ve found a period of the market that rivals the current panic and high emotion, the 1987 crash. I think this is a great example where form reading and picking up on the subtle Overbalance in Time gave you an early indication that the trend may change. Once the market moved away from 6 October down to 29 October, there wasn’t more than a 1-day reversal. Then there was a very subtle 3-day rally which was the Overbalance in Time. The crash low came in just over a week later, but it was the 3-day rally that was your first indication that times were changing. Note though, the three-day rally wasn’t the end of the move, it was just an early warning.
Now, when we see three days up in the current market it might just be the first indication that something is changing, but it’s all part of piecing the market together with other techniques to know the times when we should hang in there, and other times when it’s a good time to lock in or take profits. For those who’d like to learn more about Form Reading, Chapter 2 of WD Gann’s How to Make Profits in Commodities” is a great place to start.
Happy Trading!
Gus Hingeley

