Fresh Highs
We are commencing the last quarter of 2025, and we have seen a year of twists and turns when it comes to markets. Of note to me is the continued strength of the Nasdaq and we will likely look back to 2025 as the year that AI became mainstream. A curious scenario of the Nasdaq is how heavily weighted the performance of the index is to what has been coined the magnificent 7. These 7 stocks represent approximately 40% of the Nasdaq’s market cap, so we would logically conclude if we can understand the movements of these majors, we in turn can overlay the analysis on the index.
Chart 1 shows us the Nasdaq futures. The pattern of a loose double bottom of lows from late 2024 and April 2025 allows for a projection of 200% as a target. The 150% level proved to provide some short-term resistance, ultimately the price action rolled through. Reading the weekly bars suggest there was more of a pause in the trend as opposed to any major disagreement with bulls and bears. Logically the 200% target at 26,600 is a place to watch.
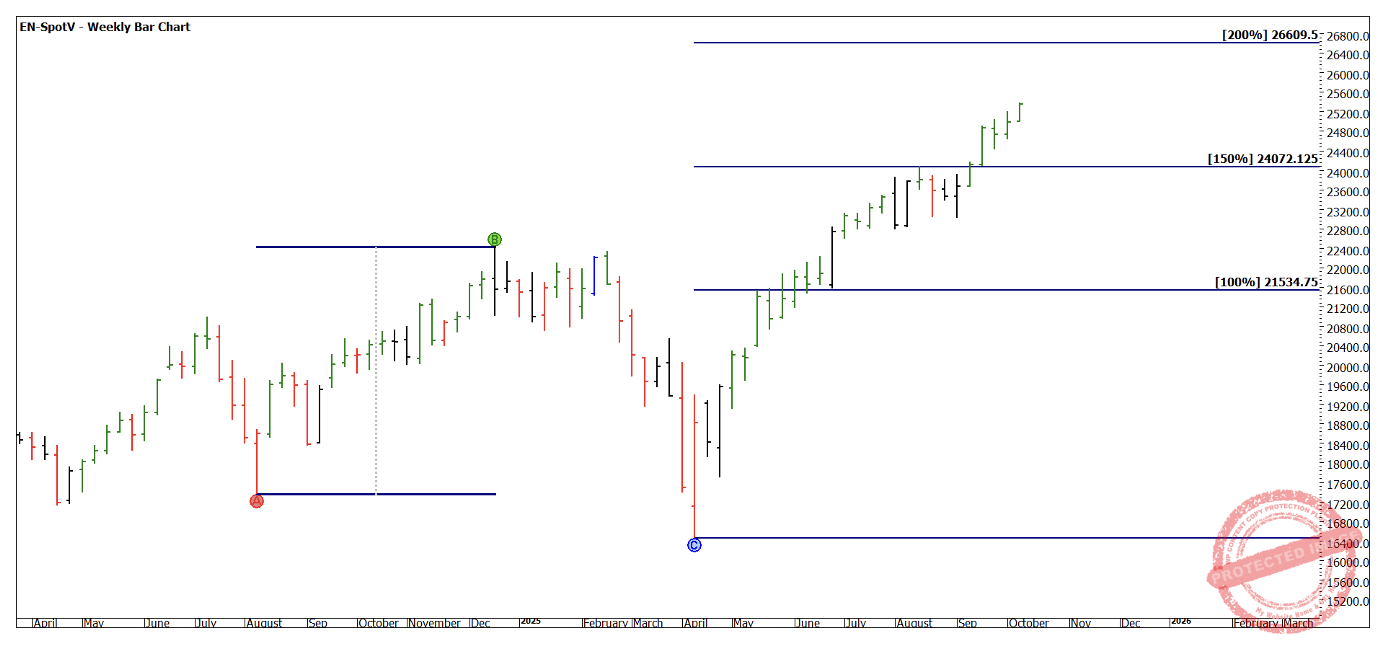
Chart 1 – Weekly Bar Chart EN-Spotv
Tesla is one of the magnificent 7 and one I have been watching closely. It has underperformed the others and the index as a whole in 2025. This means it could be one to watch as a contrarian play or it has a lot of price action to catch up.
Chart 2 shows the price action under the 2024 high and only at 75% of the previous range.
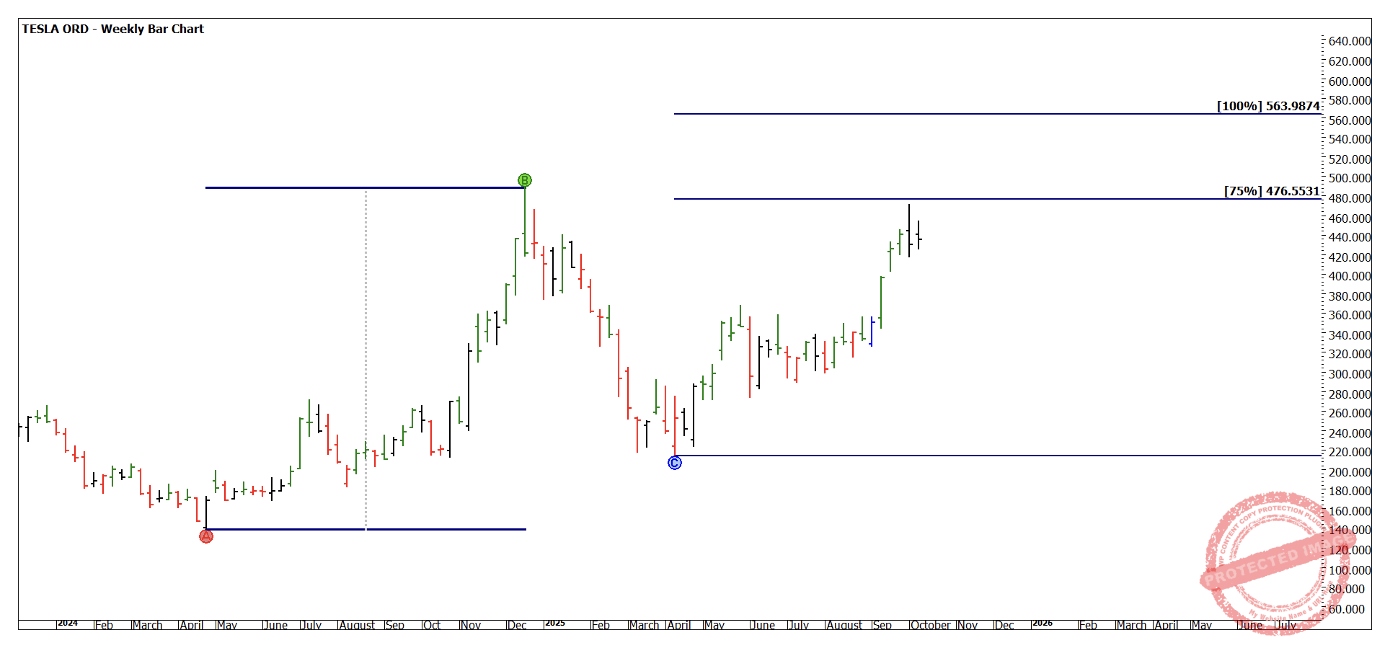
Chart 2 – Weekly Bar Chart TSLA
Microsoft has become so much more than a desktop software developer from the initial days of Windows. Its AI work and the role it plays in enterprise software are now its main drivers.
Chart 3 shows its relative performance, it has broken its 2024 high with the 100% target at $599, a possible next step.
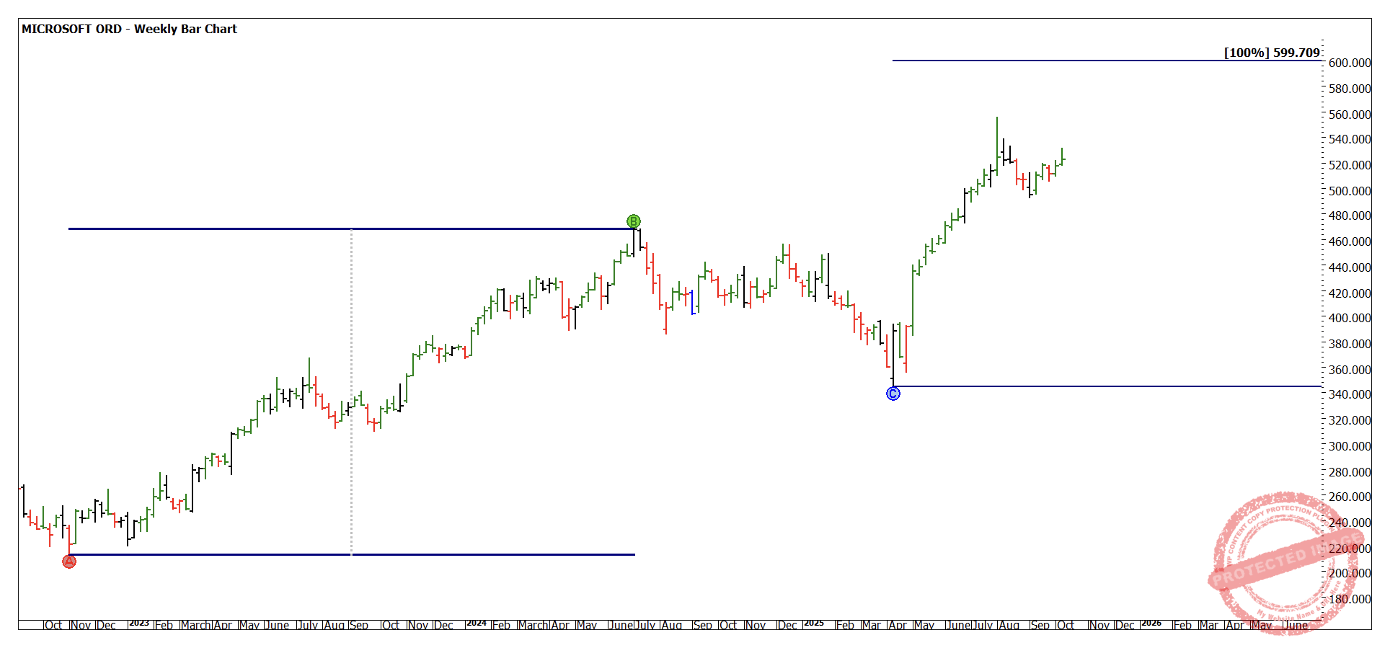
Chart 3 – Weekly Bar Chart MSFT
Google is a company name that is now a term in popular language, it has spun off aspects of its business to include its relationship with Meta.
Chart 4 shows us another possible laggard as the price action of Meta has fallen back below its 2025 highs and has broken its weekly swing bottoms. We can also see the price action has fallen just short of its 100% milestone.
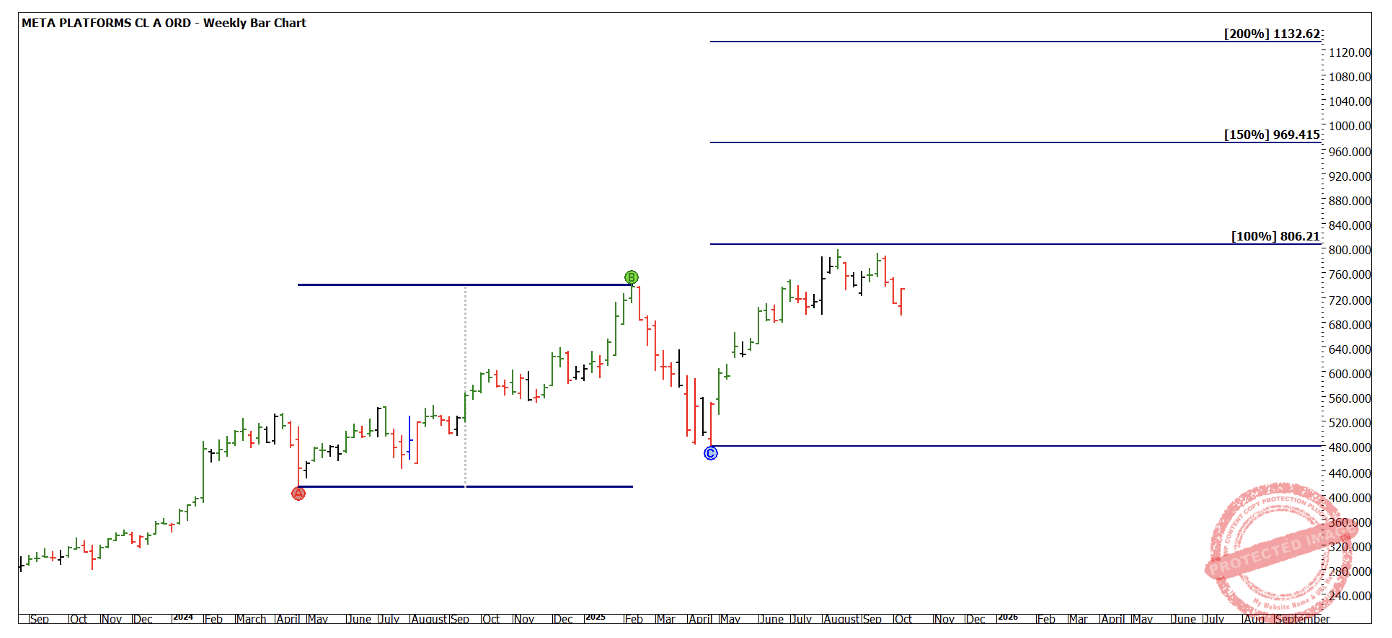
Chart 4 – Weekly Bar Chart META
Amazon is the next in line, again a slightly more subdued picture than what the index is suggesting.
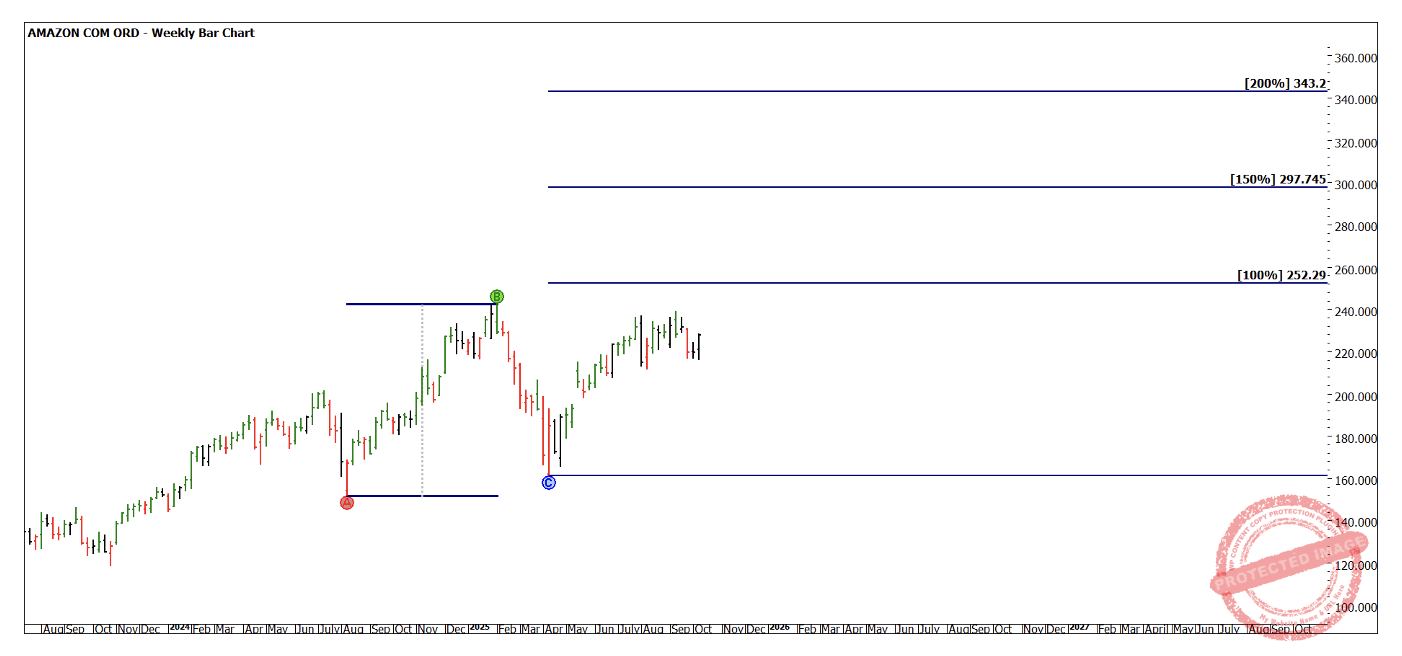
Chart 5 – Weekly Bar Chart AMZN
Alphabet is the other arm of Google, and its performance is more in line with the index that its partner Meta. The 200% double bottom is the next milestone in line if we consider the trend will remain intact.
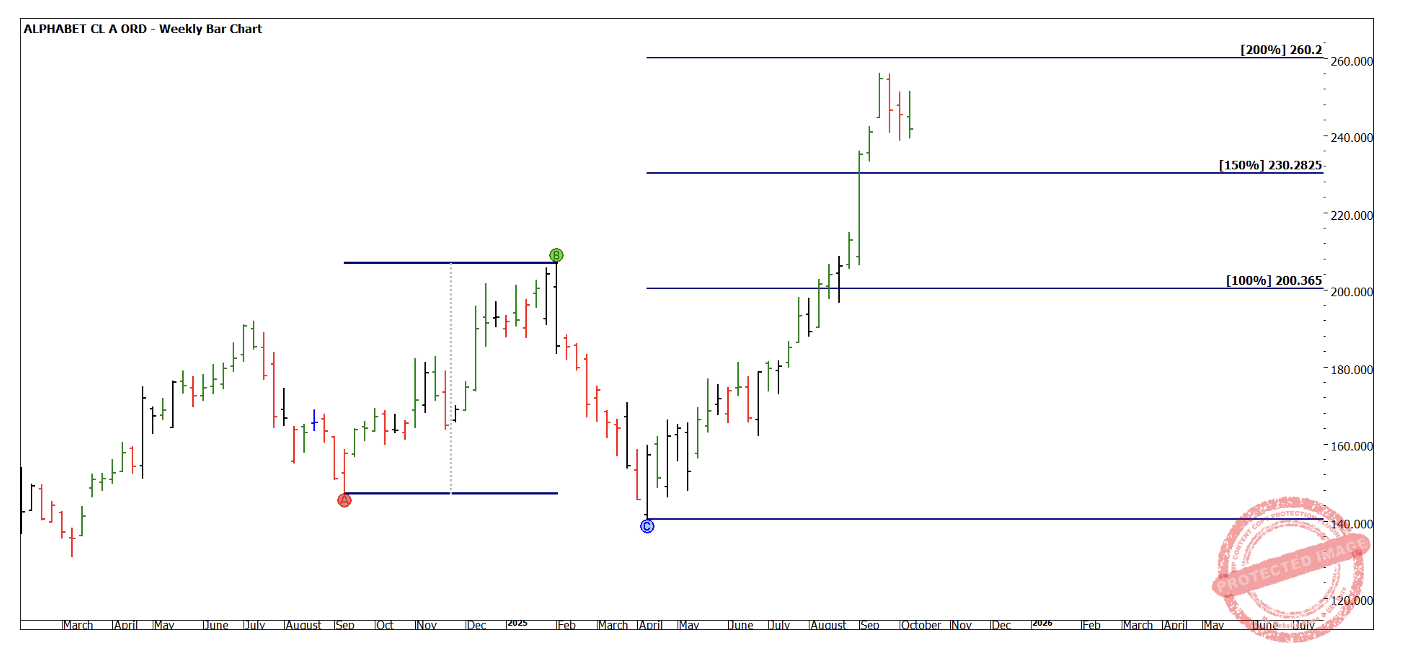
Chart 6 – Weekly Bar Chart GOOGL
Apple once at the forefront of all thing’s tech is now at a more mature stage of its business life cycle with less of a groundbreaking focus and more of a delivery and client retention side of its products and services. Chart 7 suggests the 100% target at approximately the old tops of 2024 could be one to watch for a possible double top.
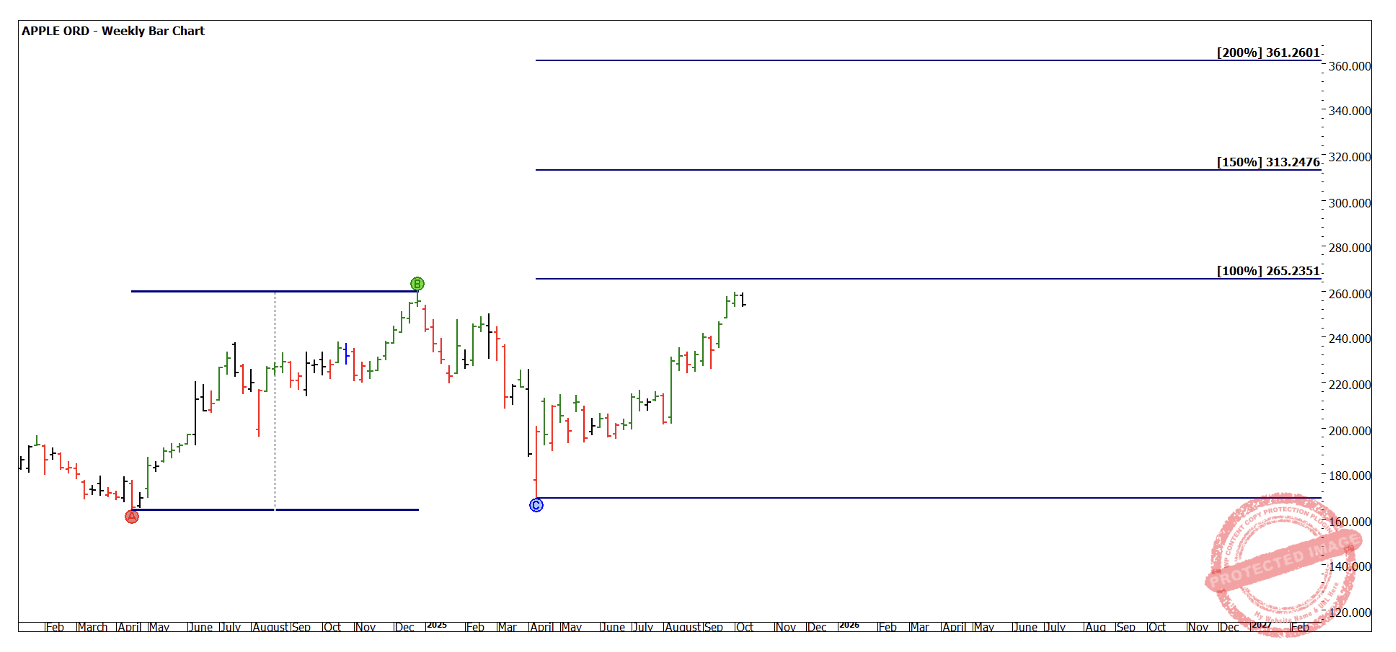
Chart 7 – Weekly Bar Chart AAPL
Finally, Nvidia, the chip manufacturer powering the AI boom is one of the 7 with more positive buoyancy as we see the possibility of 200% of the double bottom at $211.50.
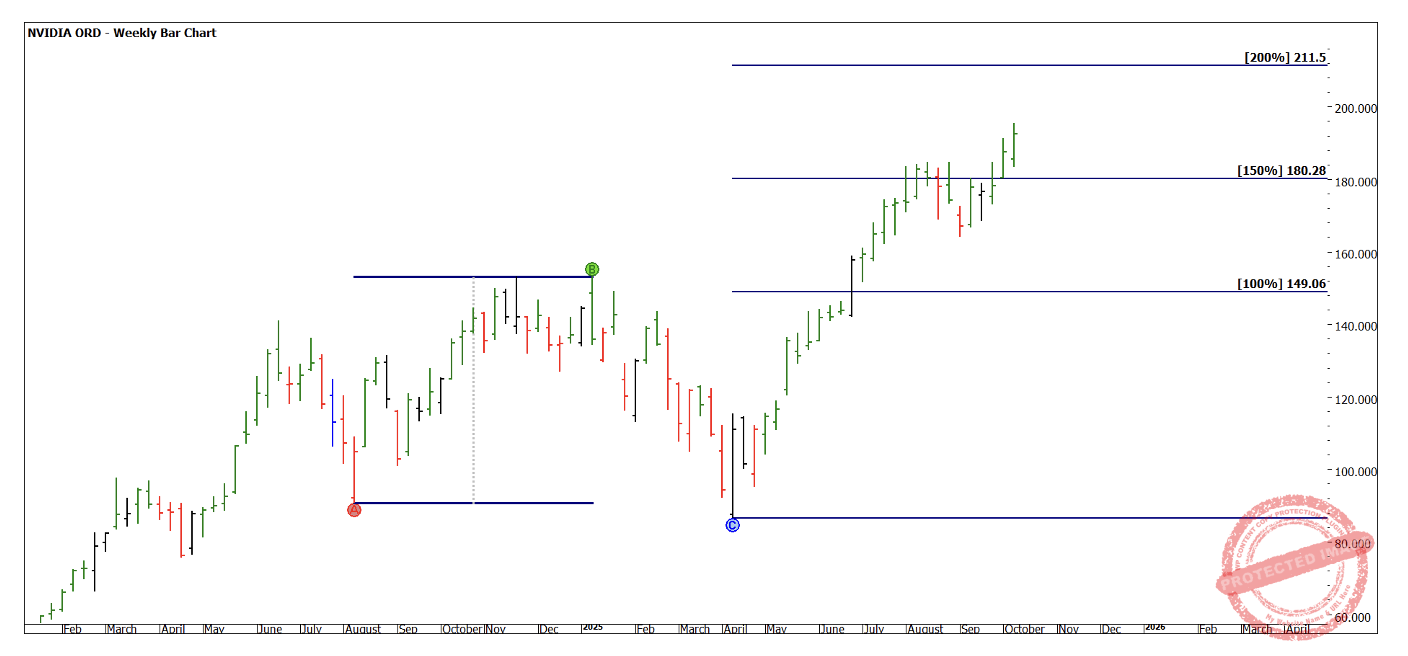
Chart 8 – Weekly Bar Chart NVDA
A simple approach would be to stalk all the 7 markets and see if they all reach price resistance at the similar times, this could act as a catalyst for the Nasdaq on the whole. This is just one example of how combining multiple markets in the same index can be used as a guide for the index overall.
Given that these 7 stocks make up a large percentage of the index, the overall picture of all 7 suggest a small divergence with the index.
One final chart that presents a real risk of information overload is Chart 8. ProfitSource has the option to overlay charts. The base bar chart here is the Nasdaq futures, I have overlaid as line charts the magnificent 7. There is a lot of noise, and I am not looking for any specific value, I am watching the shape of the price action compared to the index. A good test would be to ask yourself, what does this chart tell me?
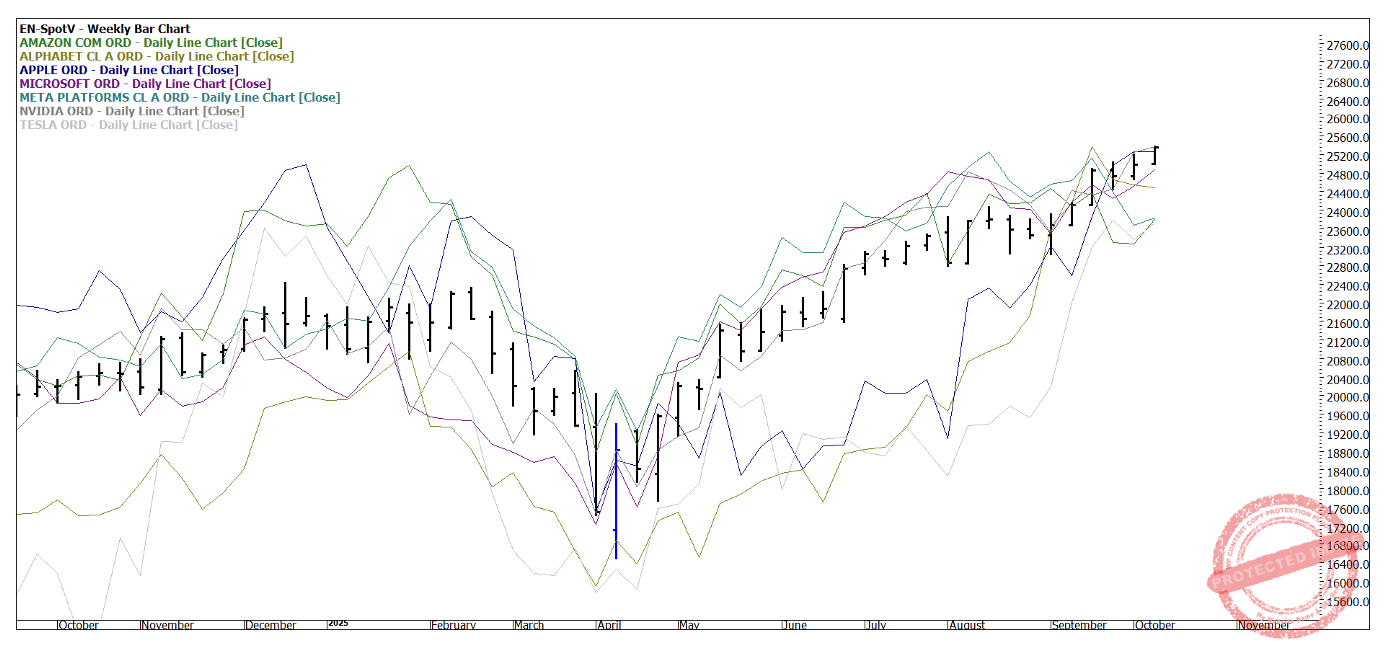
Chart 9 – Weekly Bar Chart EN-Spotv vs Magnificent 7
Good Trading
Aaron Lynch