Gann Chart – Double Tops
At any one point in time, within a given commodity market, seasonal factors can cause different contracts in that market to be trading at different prices. Therefore for some markets especially, it pays to become familiar with, and keep a close eye on, charts for that market which are other than their SpotV chart. This month’s article looks back on a recent trade in the Coffee Futures market. The ProfitSource chart symbol used for the trade analysis and execution was KC-Gann.Z; this is a continuous chart which only draws data from successive December contracts for the said market.
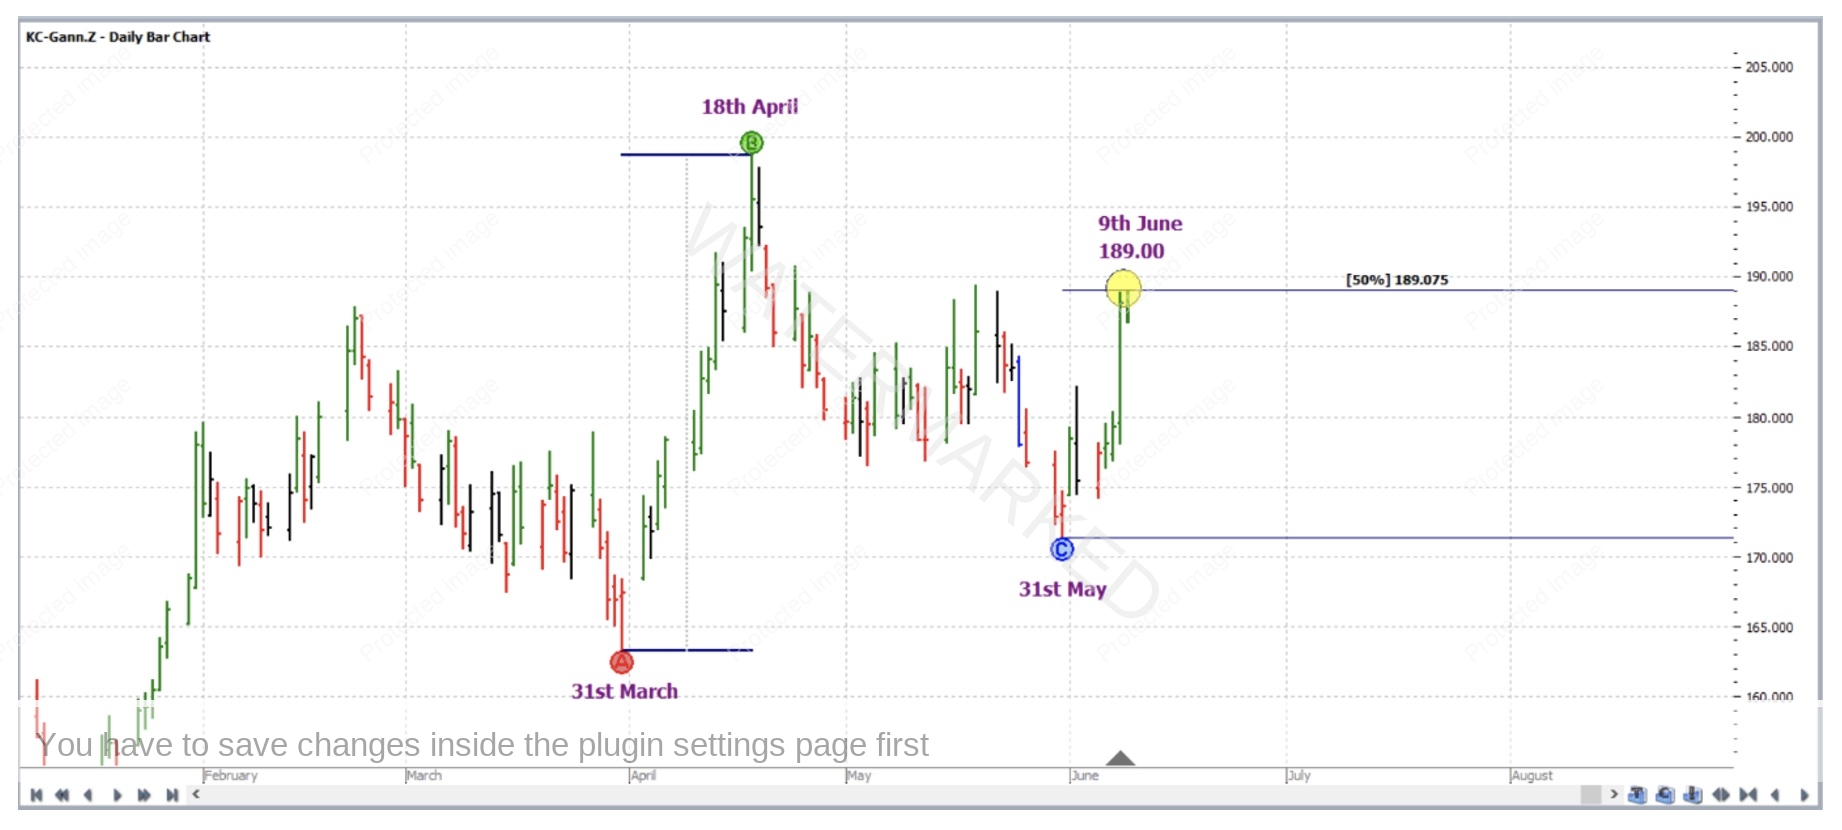
As shown in the chart below in Walk Thru mode, by 9 June 2023, the market had reached a price of 189 cents per pound, and this price was only one point (point size 0.05 cents per pound) shy of the 50% milestone (rounded down to the nearest point i.e. 189.05) of the ABC formation applied as follows:
Point A: 31 March 2023 low
Point B: 18 April 2023 high
Point C: 31 May 2023 low
For clarity, all other milestones in this application of the ABC Pressure Points tool have been switched off in that tool’s Properties box. As will become obvious later in this article, intraday analysis and trade execution occurred before the daily bar for 9 June 2023 became complete. Therefore in the chart below Walk Thru mode has only taken data up until 8 June 2023. ProfitSource’s Trendline drawing tool has been used to construct the bar for 9 June 2023 only as it was by 7am EST (New York Time). Note that each Coffee futures trading day session is not complete until 1.30pm EST.
Obviously this milestone was a single reason to expect overhead resistance in this market, but was there any other evidence which could have lead us to anticipate a tradeable turn in this market i.e. a reversal to the downside for a potential short trade?
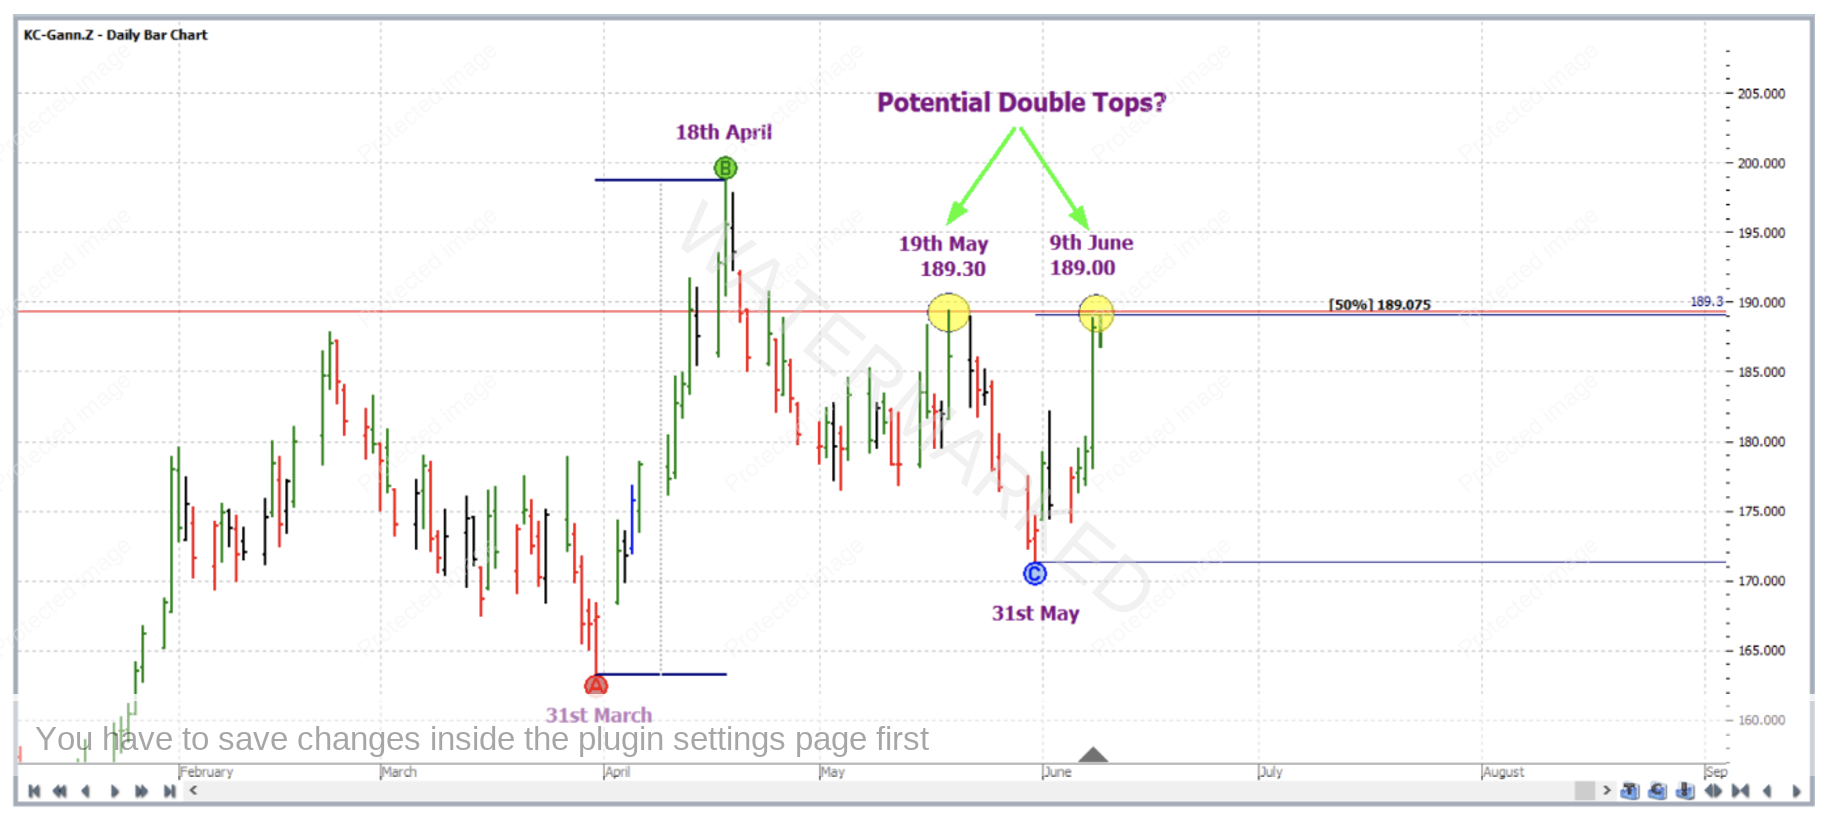
Upon closer inspection, there is some further analysis which can be added to the chart above – the top of 19 May 2023, price wise, was very close to 189.00, at 189.30; therefore, by 9 June 2023 there was the potential for a double top formation. A red line has been added to the chart at the exact price of the May top. The two price analysis inputs thus far are clustered together very tightly – only 5 or 6 points away from each other – a price distance which is very small in relation to the size of an average daily bar in this market.
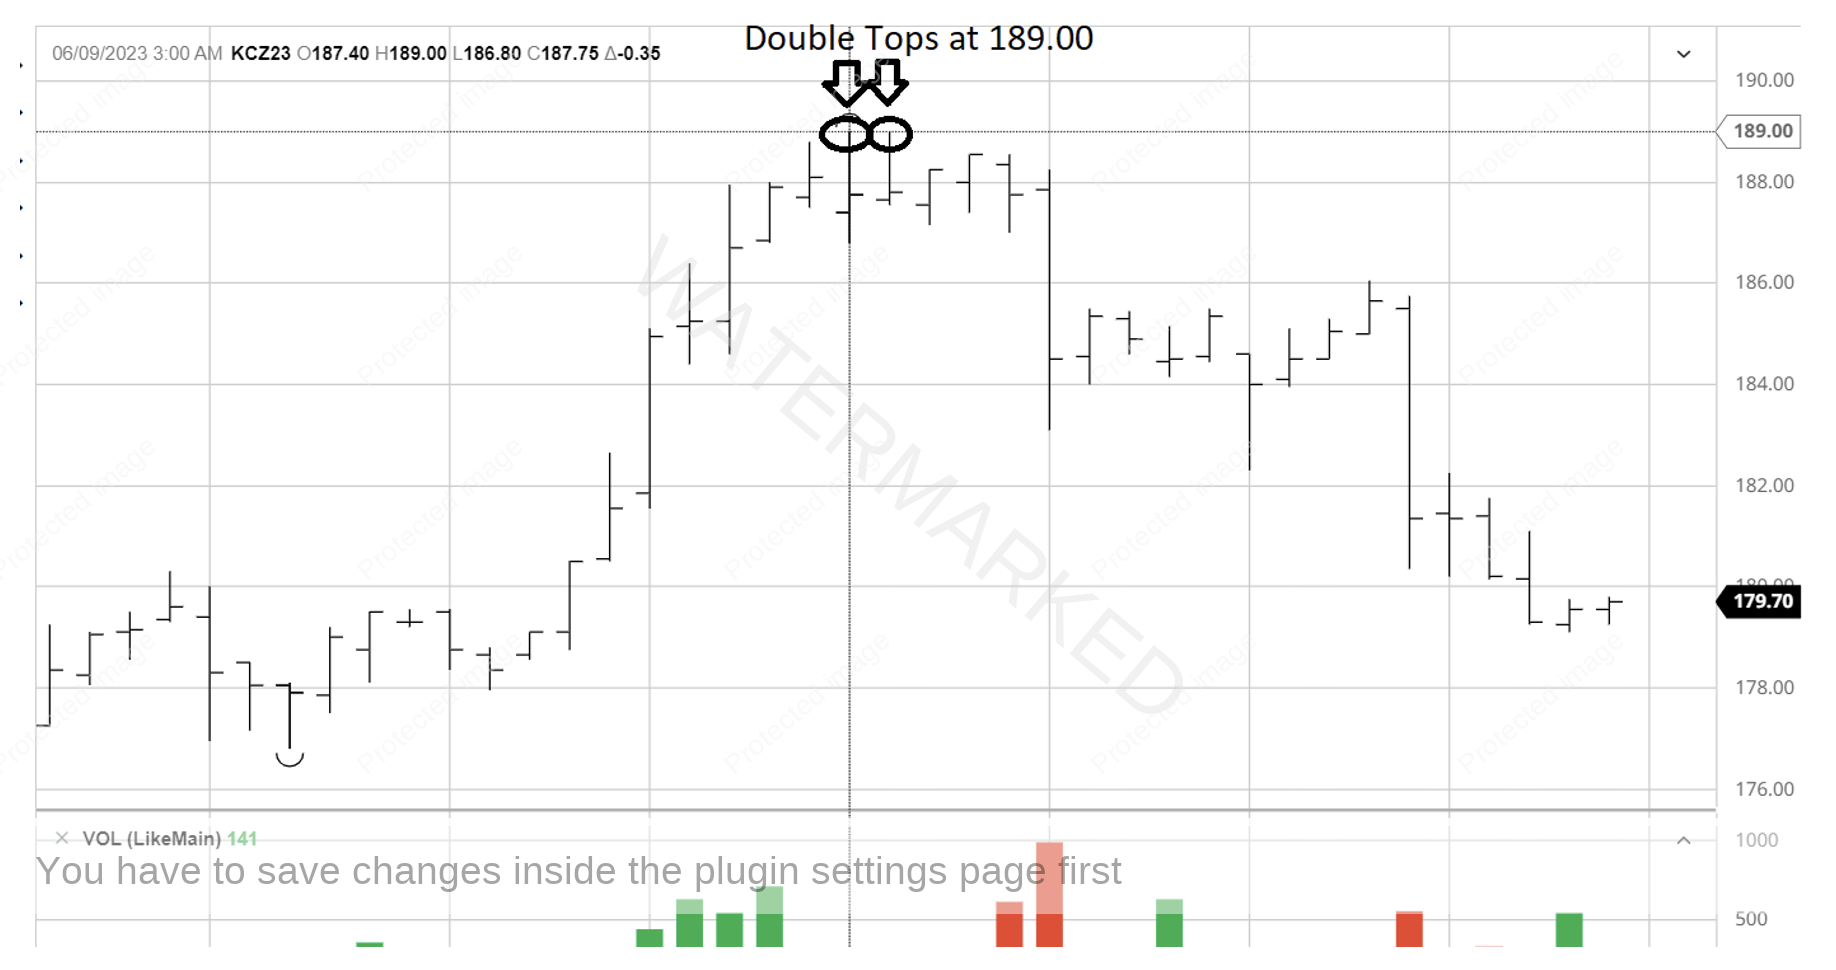
But was there a third piece of price analysis? Good practice is to have at least three good price reasons to form a price cluster and as a result expect the market to reverse. The answer in this case – no. Well, at least not anything else of strength or quality from the daily bar chart, weekly bar chart or beyond. What about the intraday chart though? Was there anything there on the smaller picture which could at least add some degree of confirmation to the quality analysis so far, and stand up as a third reason to take a trade? Below is a screenshot from barchart.com for the December 2023 contract hourly bar chart. And it shows two small picture double tops both at exactly 189.00 cents.
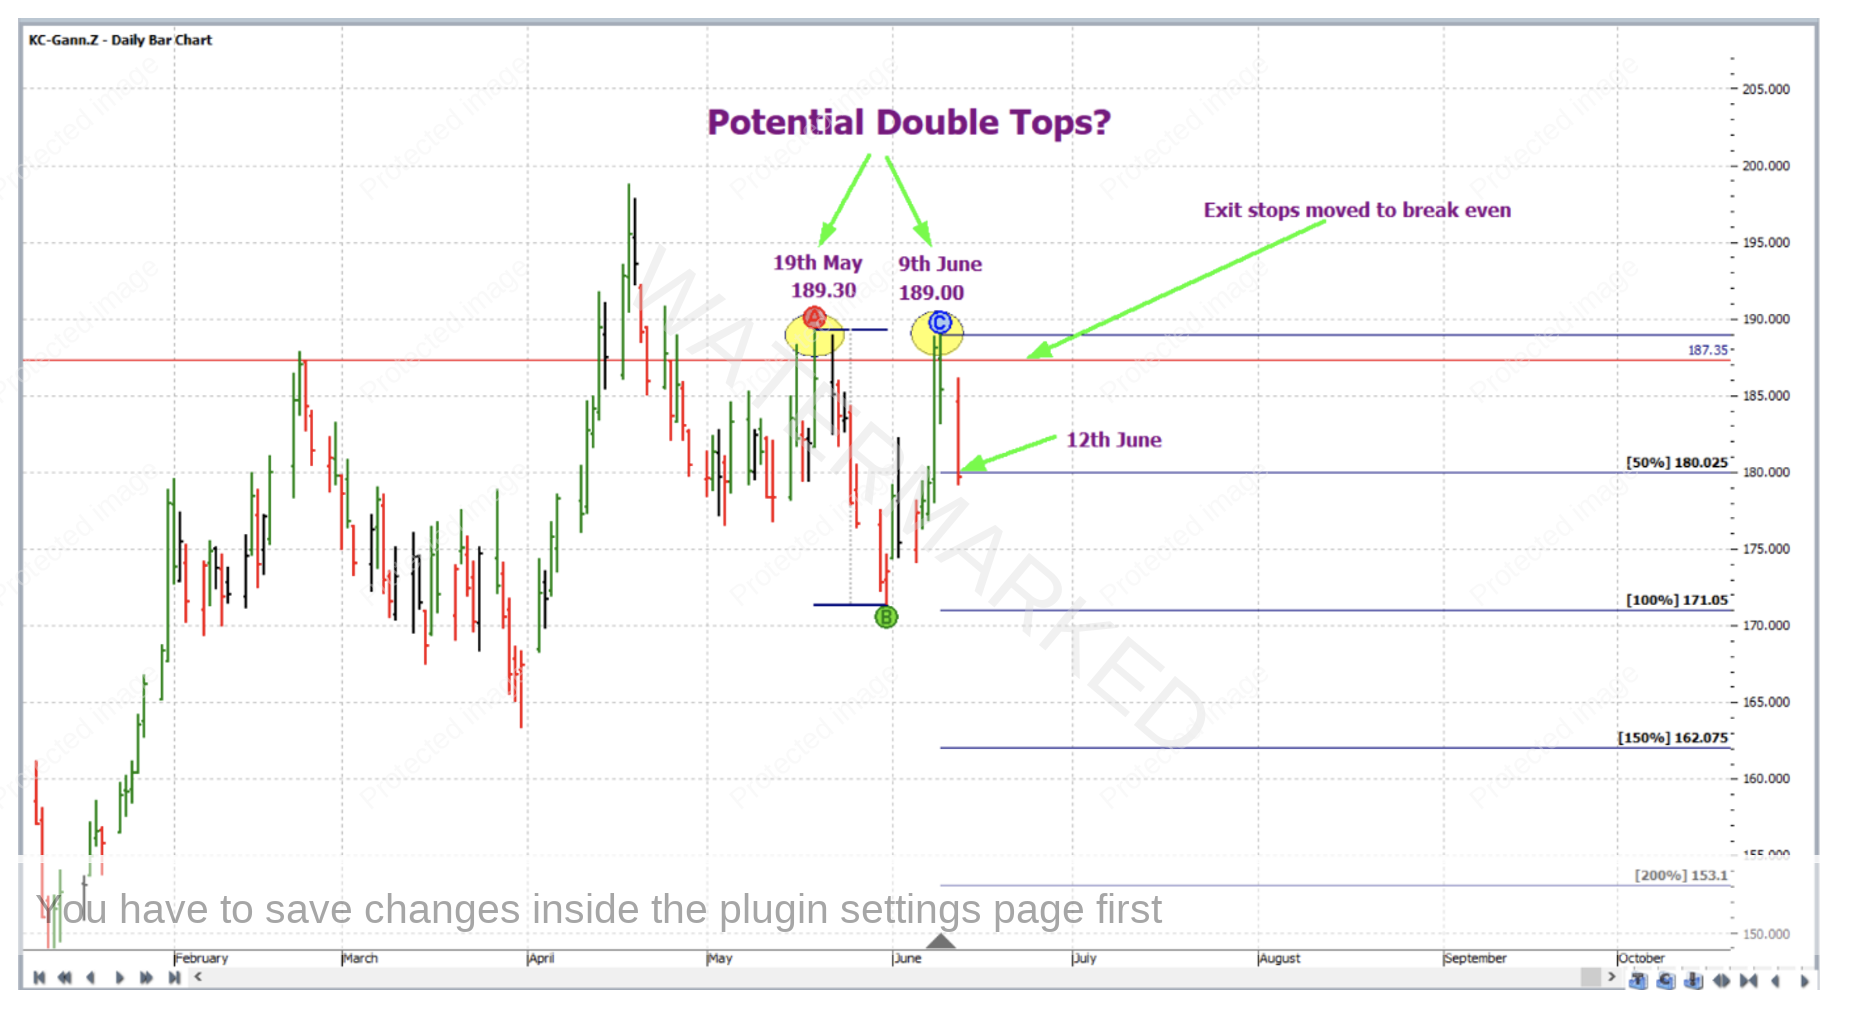
Taking the above intraday chart analysis as a third reason to trade, a first lower swing top entry on the hourly chart would have had you short December Coffee at 187.35 with an initial exit stop loss at 188.60. And now what about a plan for the trade management and an exit target? Given that a double top formation on the daily chart was to potentially unfold, the 200% milestone (153.10) was decided as the exit target. When the market reached the 50% milestone on 12 June 2023, exit stops were moved to break even.
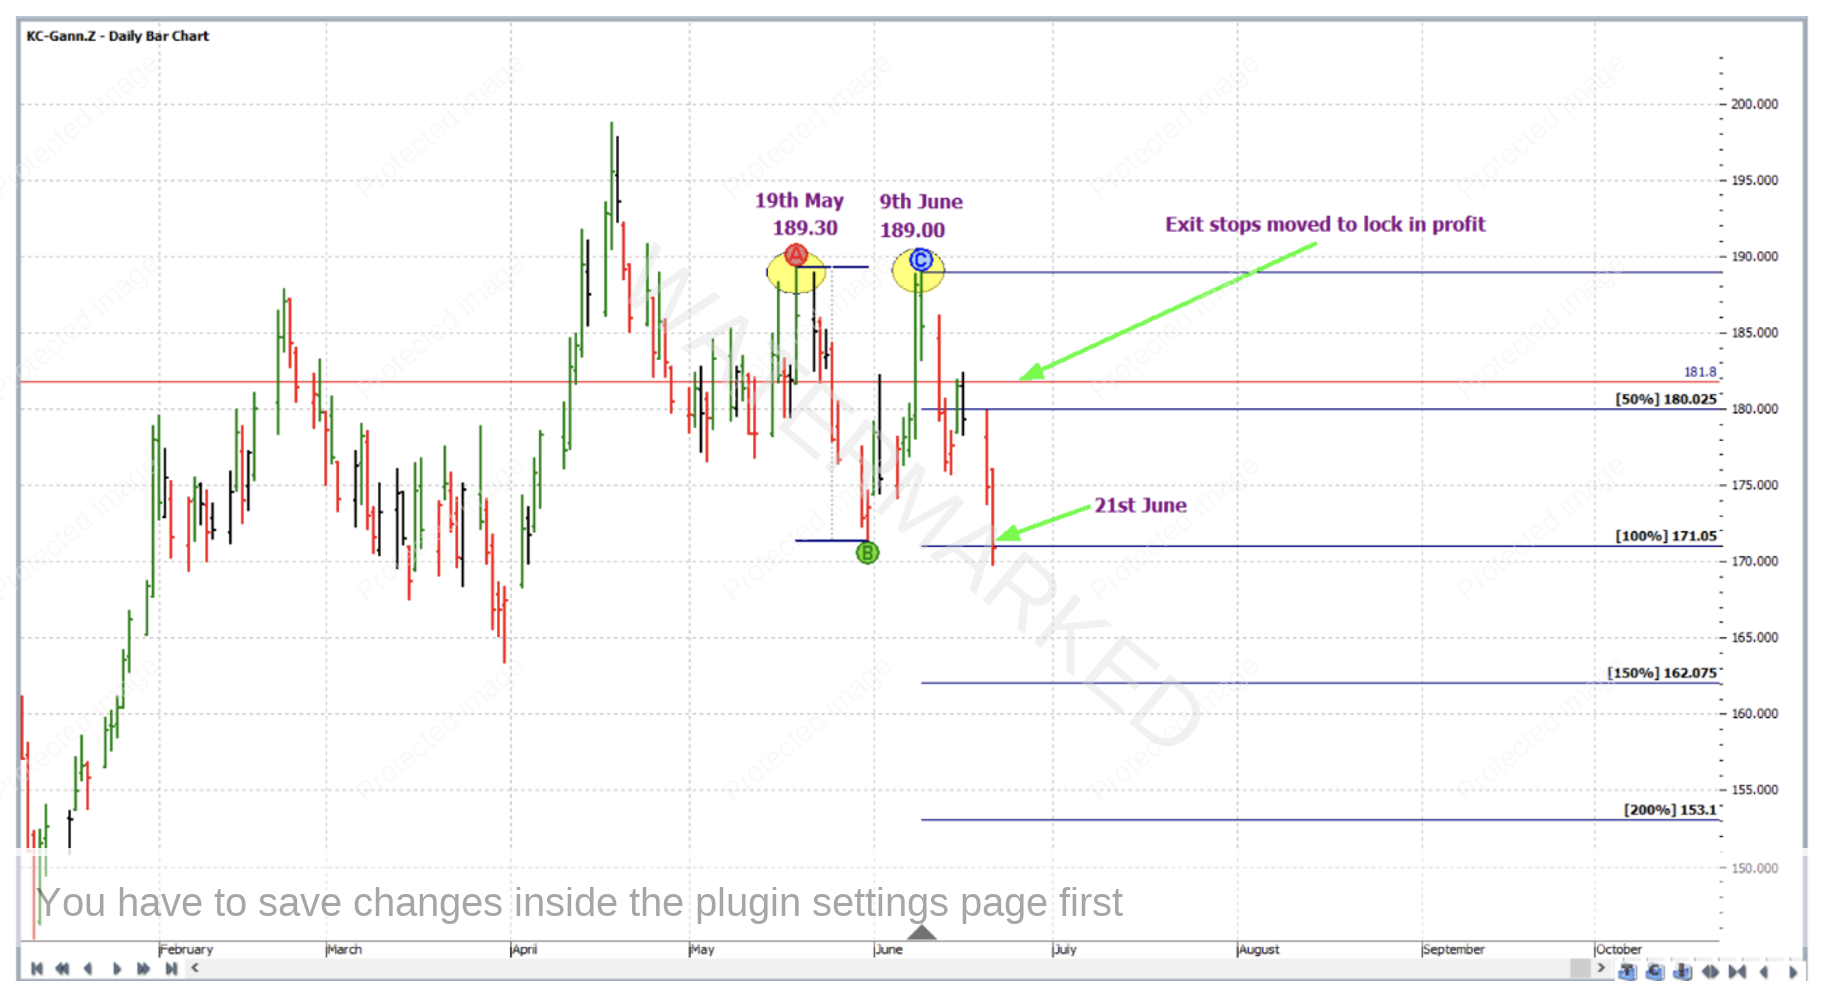
Normally when managing a trade with respect to the milestones of a previous range, action is taken at all of the milestones between trade entry and exit which are multiples of a 25%; this time however, because the double top formation is a relatively small picture one, action was only taken at the milestones which were full multiples of 50%, giving the market more room to breathe on the way down if required. Therefore in this case the next step was only taken once the trade broke through the 100% milestone on 21 June 2023, and exit stops were moved to one third of the average daily range (approximately 1.75 cents based on the previous 60 trading bars) above the 50% milestone to lock in some profit.
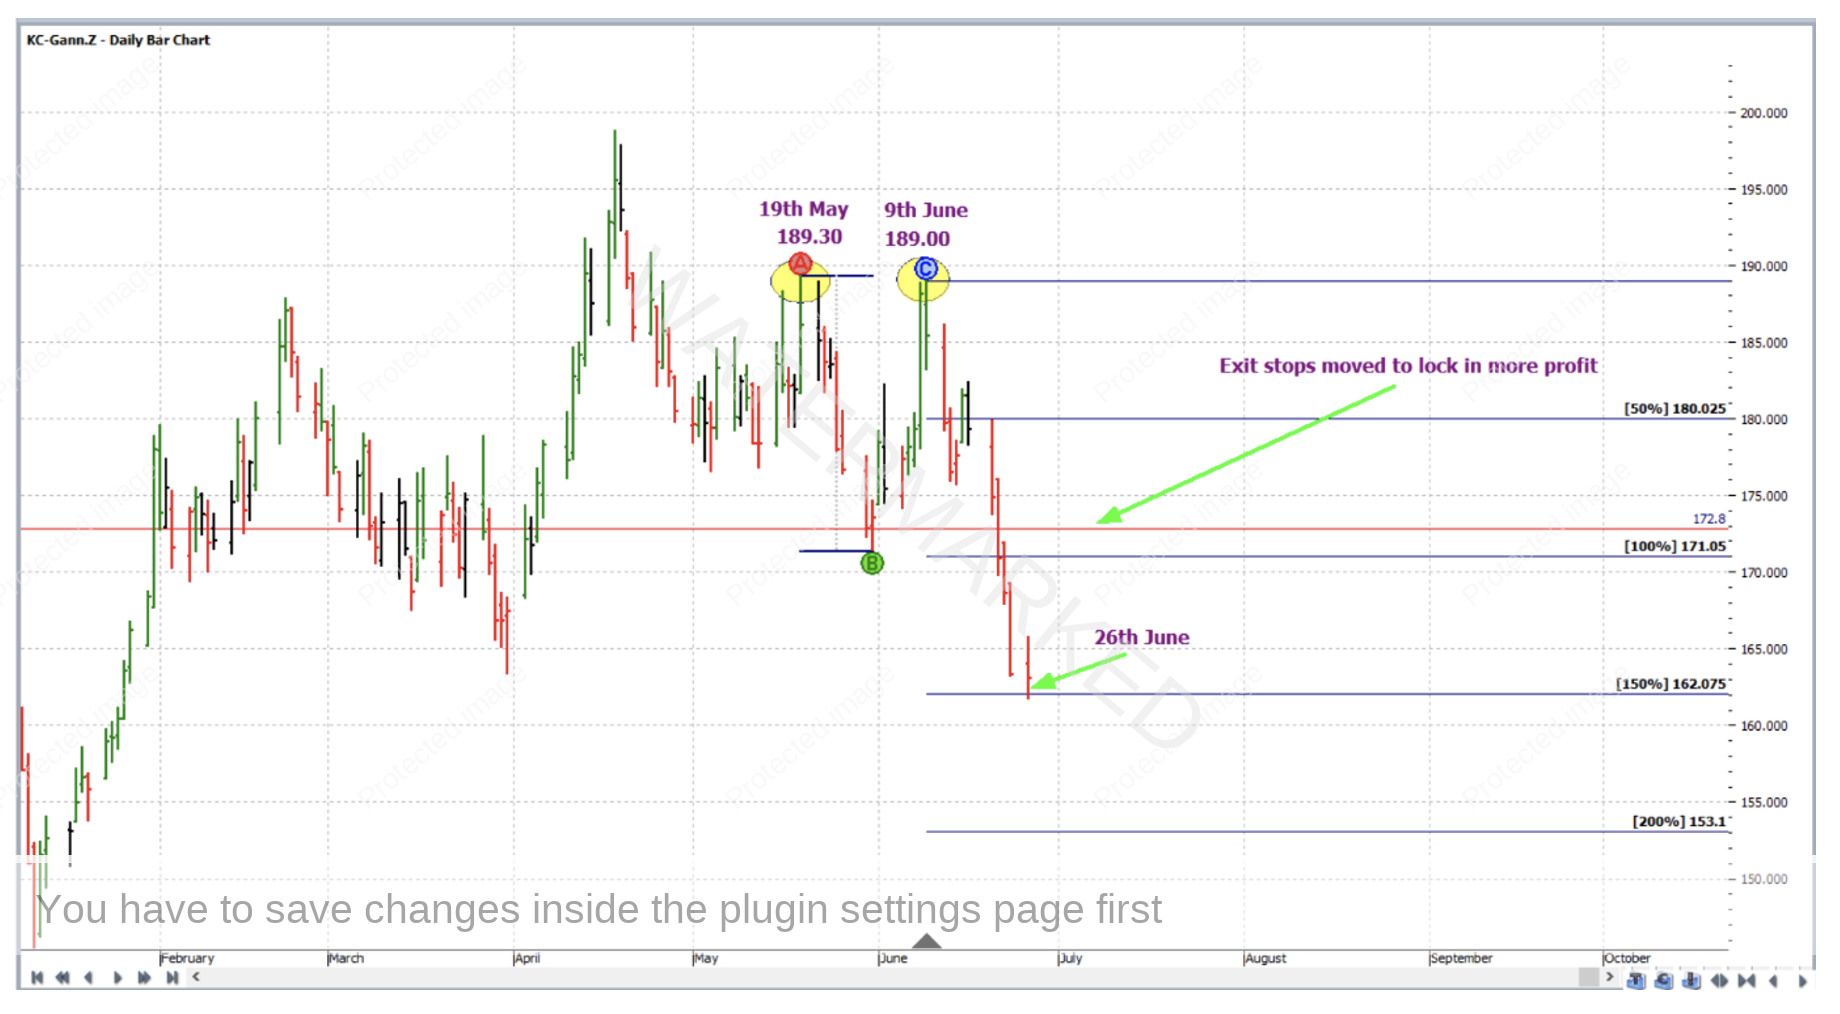
On 26 June 2023, the market reached the 150% milestone and exit stops were moved to one third of the average daily range above the 100% milestone to lock in more profit.
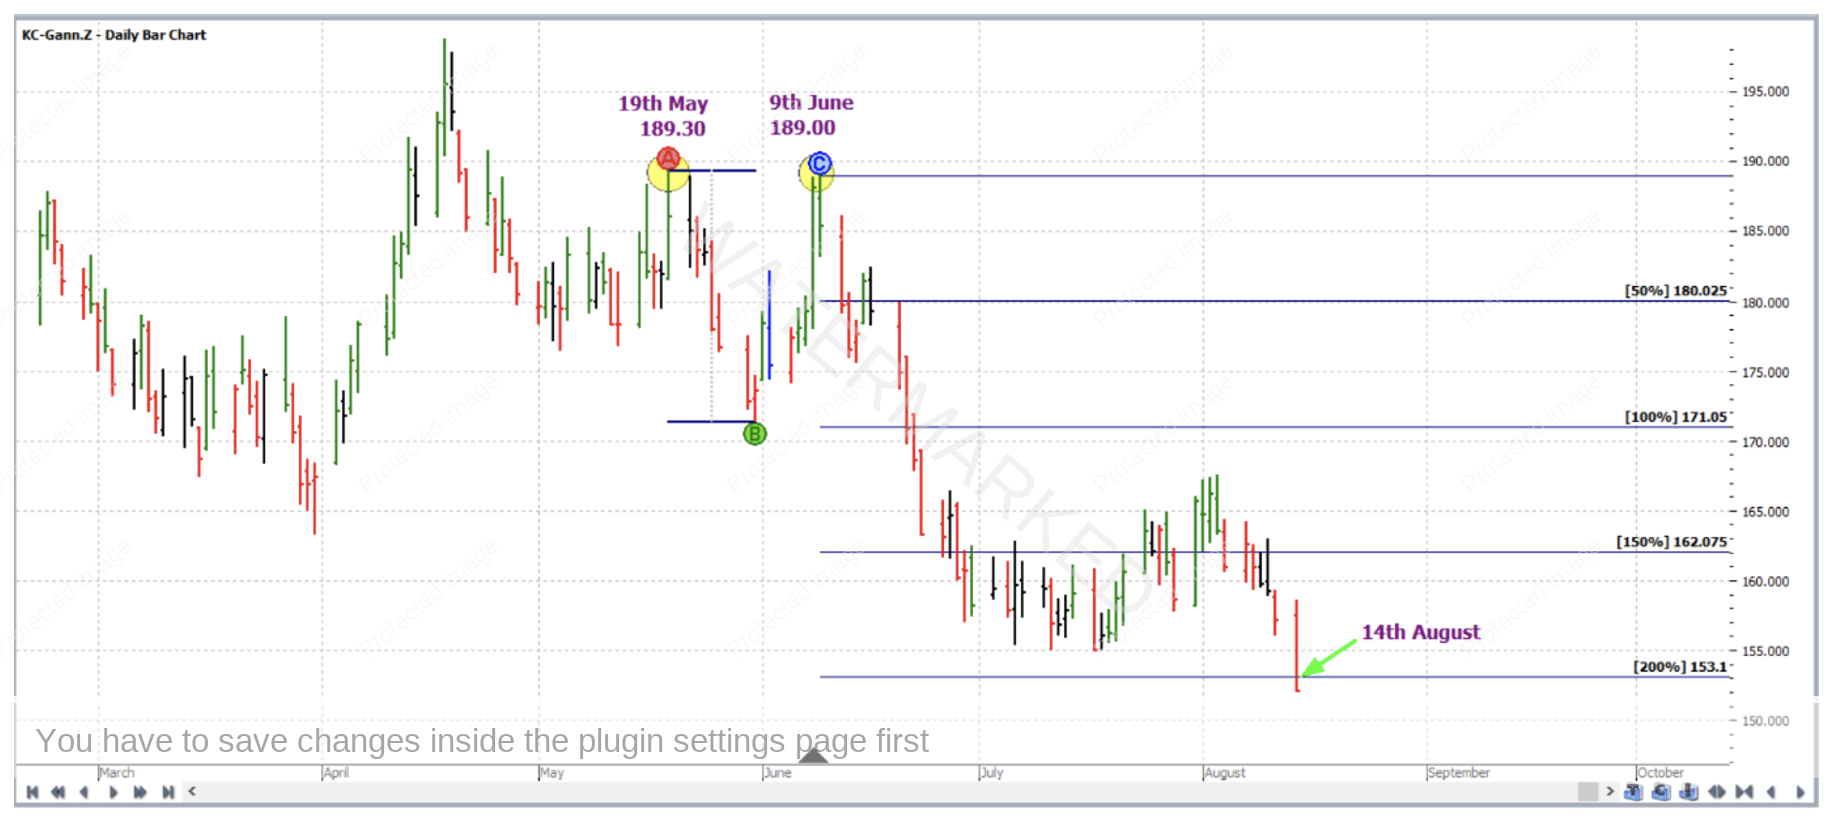
It was a long wait, but finally on 14 August 2023 the market reached the 200% milestone and profit was taken at the 200% milestone.
Now for a breakdown of the rewards. In terms of Reward to Risk Ratio:
Initial Risk: 188.60 – 187.35 = 1.25 = 25 points (point size is 0.05)
Reward: 153.10 – 187.35 = 34.25 = 685 points
Reward to Risk Ratio = 685/25 = approximately 27 to 1
Given that the third reason for this trade was only a very small picture double top from the intraday chart, and given the fact that the entry parameters (entry stop and initial stop loss) spanned across such a small price range, let’s assume that only 1% of the account size was risked at trade entry. This means that after trade exit, the percentage gain in account size would simply be as follows:
27 x 1% = 27%
Each point of price movement changes the value of one Coffee futures contract by $18.75USD. So in absolute USD terms the risk and reward for each contract of the trade is as follows:
Risk = $18.75 x 25 = $468.75
Reward = $18.75 x 685 = $12,843.75
At the time of taking profit, in AUD terms this reward was approximately $19,760. This market is also accessible with much smaller position sizes by way of a CFD.
Work hard, work smart.
Andrew Baraniak
