Goal, Ten Times Your Risk
If you took 20 trades per year and 50% of them were a mix of losses and break evens and the other 50% returned 10 to 1 or more, could you bank a net 100 to 1 Reward to Risk Ratio (RRR) for the year? The math says yes!
I run the exact same process over and over looking at a handful of markets and using the same core analysis tools David Bowden and W.D Gann have shown us. Identifying exact areas to target was something I’ve learnt more recently whilst being a student of Safety in the Market. If you’re a part of our Active Trader Program Coaching, you’ve heard Mat talk about the concept of the ‘Re-test’.
Let’s take a look at the 7 March weekly Re-test on the SPI200 which over-delivered on our monthly goal of 10 to 1.
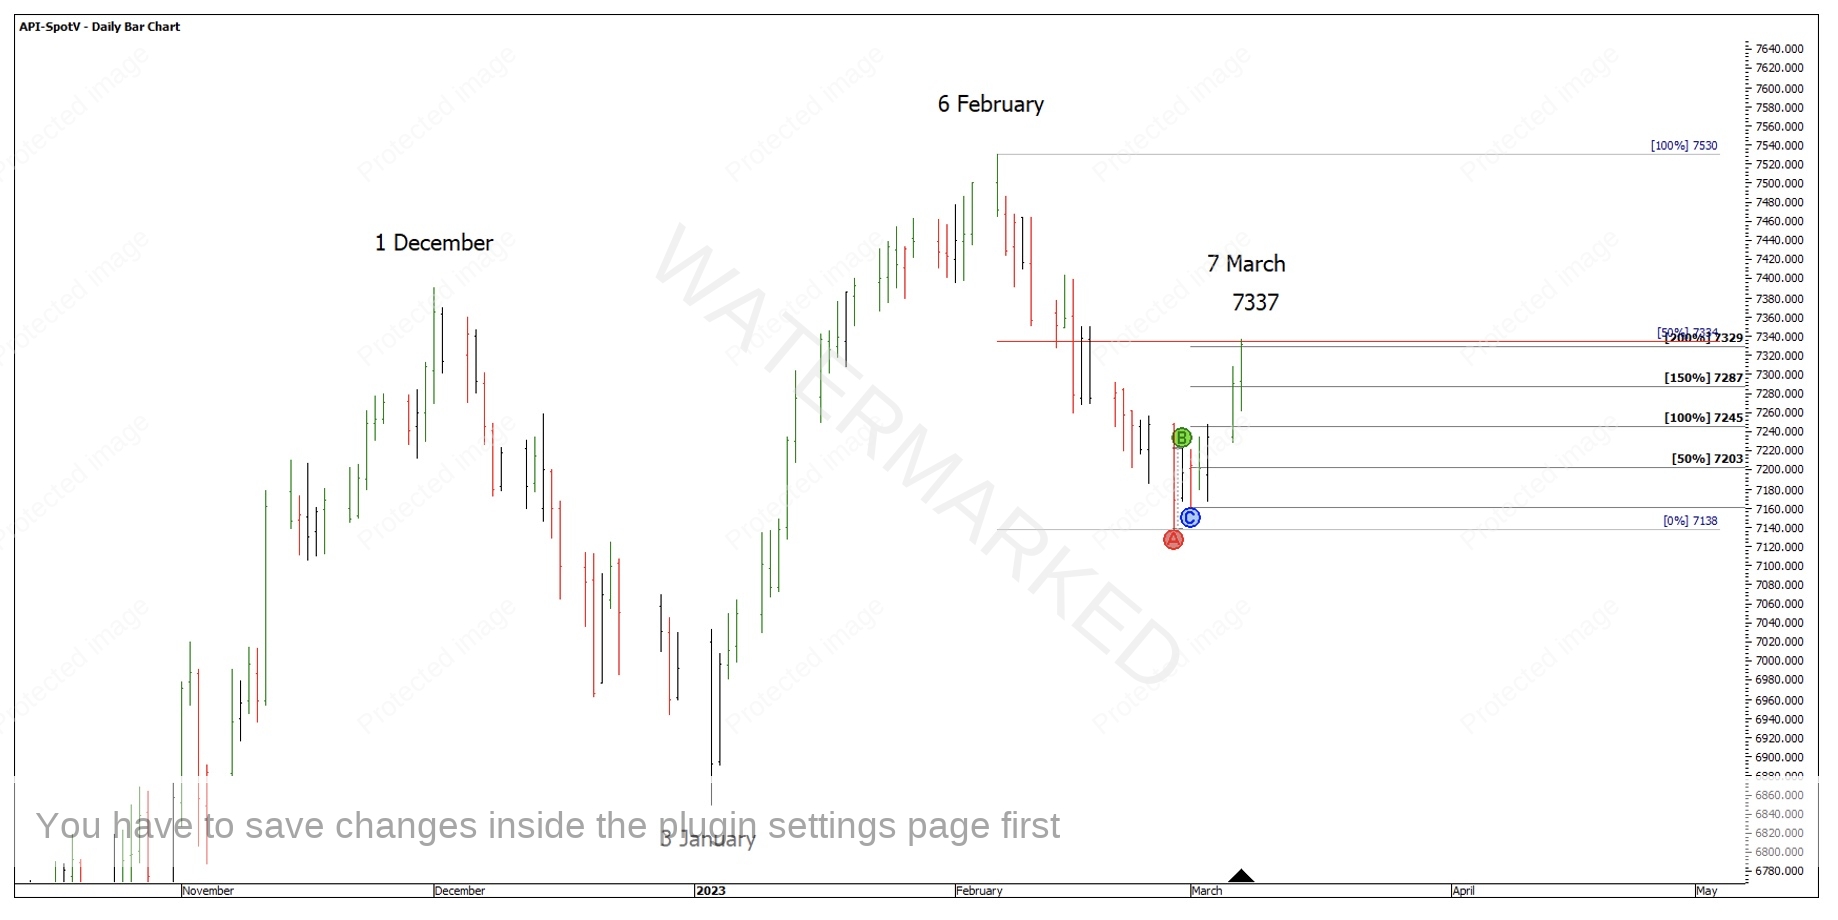
Chart 1 below shows three of the reasons for this trade.
- 200% of the 4-hour First Range Out (FRO) = 7329
- 50% weekly retracement = 7334
- Green Time by Degrees = 6th March
Chart 1 – 7 March Cluster
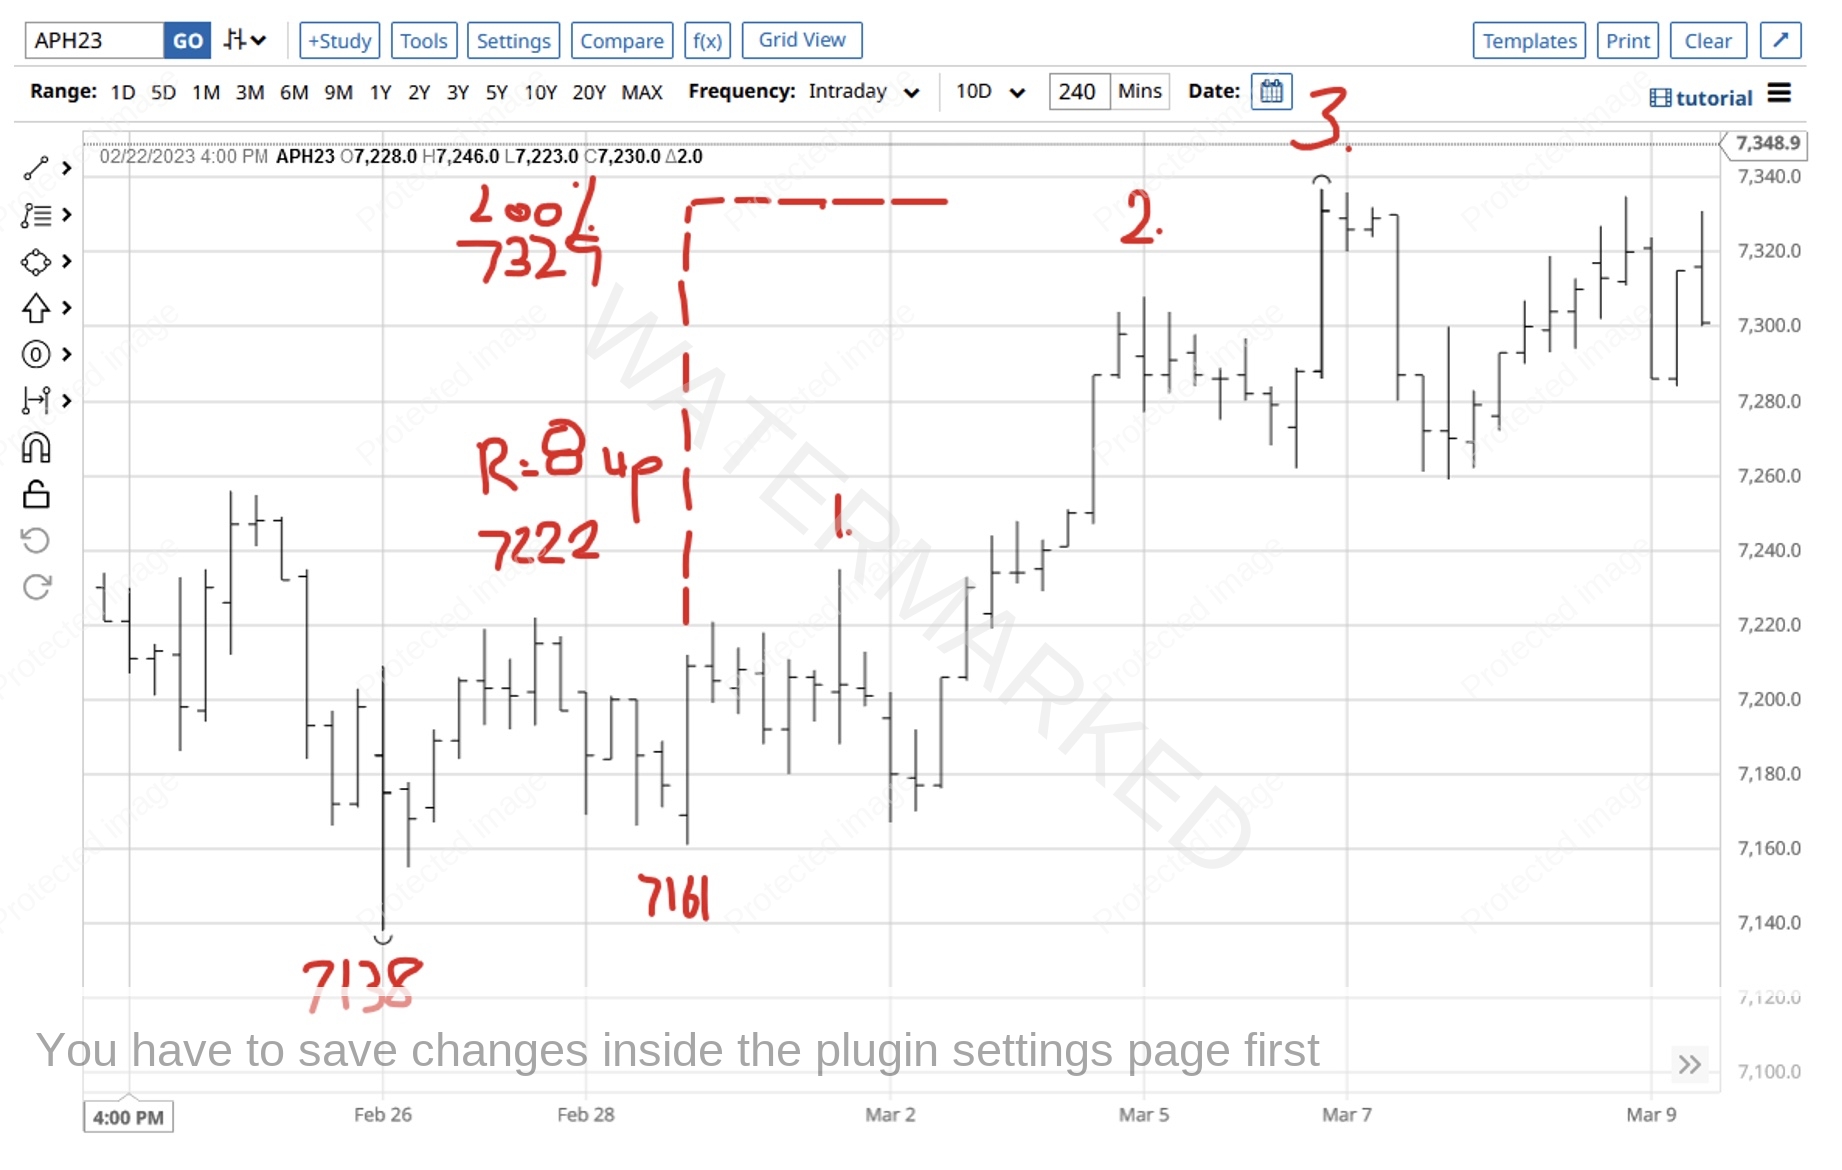
Looking at the March 2023 contract on barchart.com, I can break down the 4-hour bar chart into Sections of the Market. My interpretation was a 4-hour First Range Out where the 200% milestone gave us the first price of 7329, followed by 3 smaller sections.
Chart 2 – 4 Hour Sections of the Market
I would really encourage anyone to go and measure these price ranges labelled 1, 2 and 3 and see how they might fit in with a 7329-7334 price cluster. For me, these ranges added in two extra milestones which makes it a four-part price cluster between 7329 and 7336, 7 points apart!
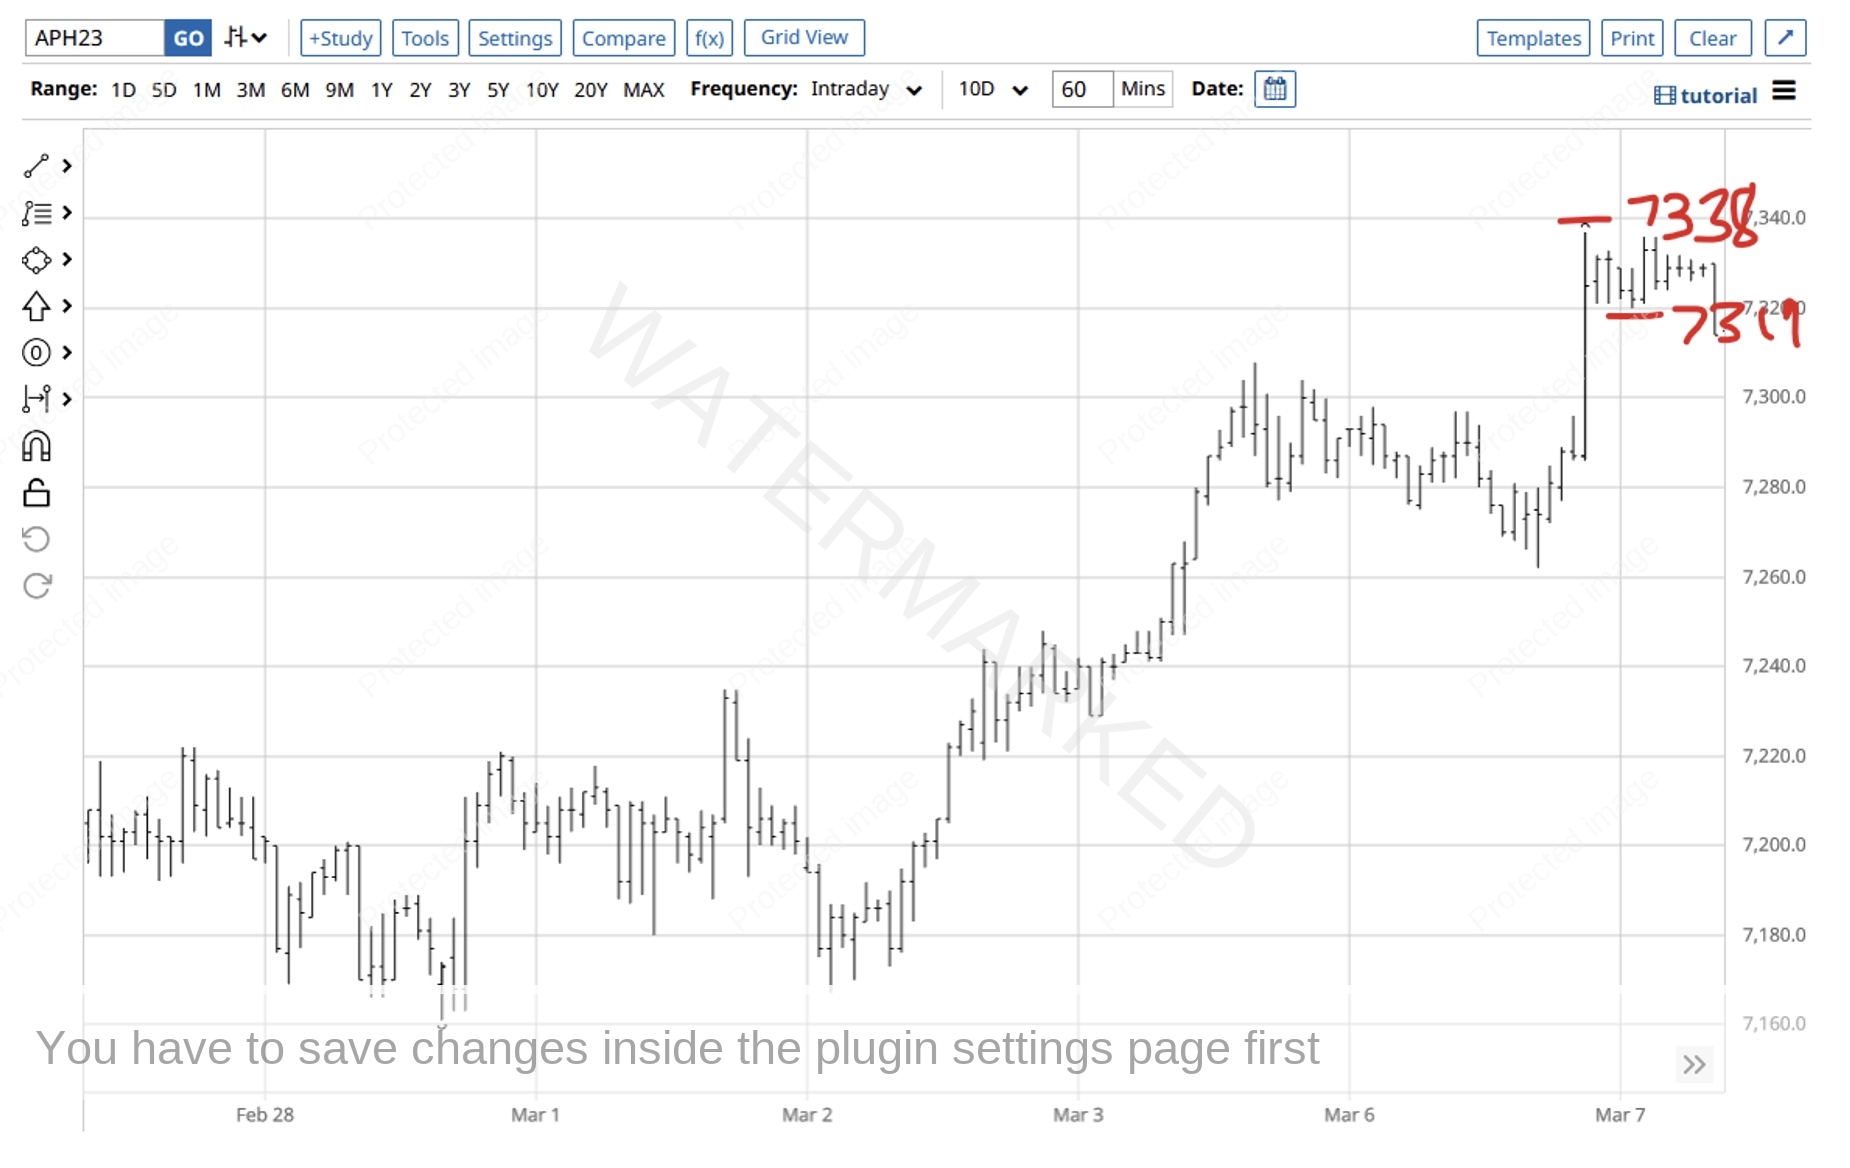
If you drop down to a 1-hour swing chart, you could gain entry after a failed 1 hour swing up and as the 1-hour swing low was then broken at 7319 with a stop above the high at 7338. This gives the trade 19 points of risk meaning the SPI only has to move 190 points to return a 10 to 1.
Chart 3 – 1 Hour Swing Chart Entry
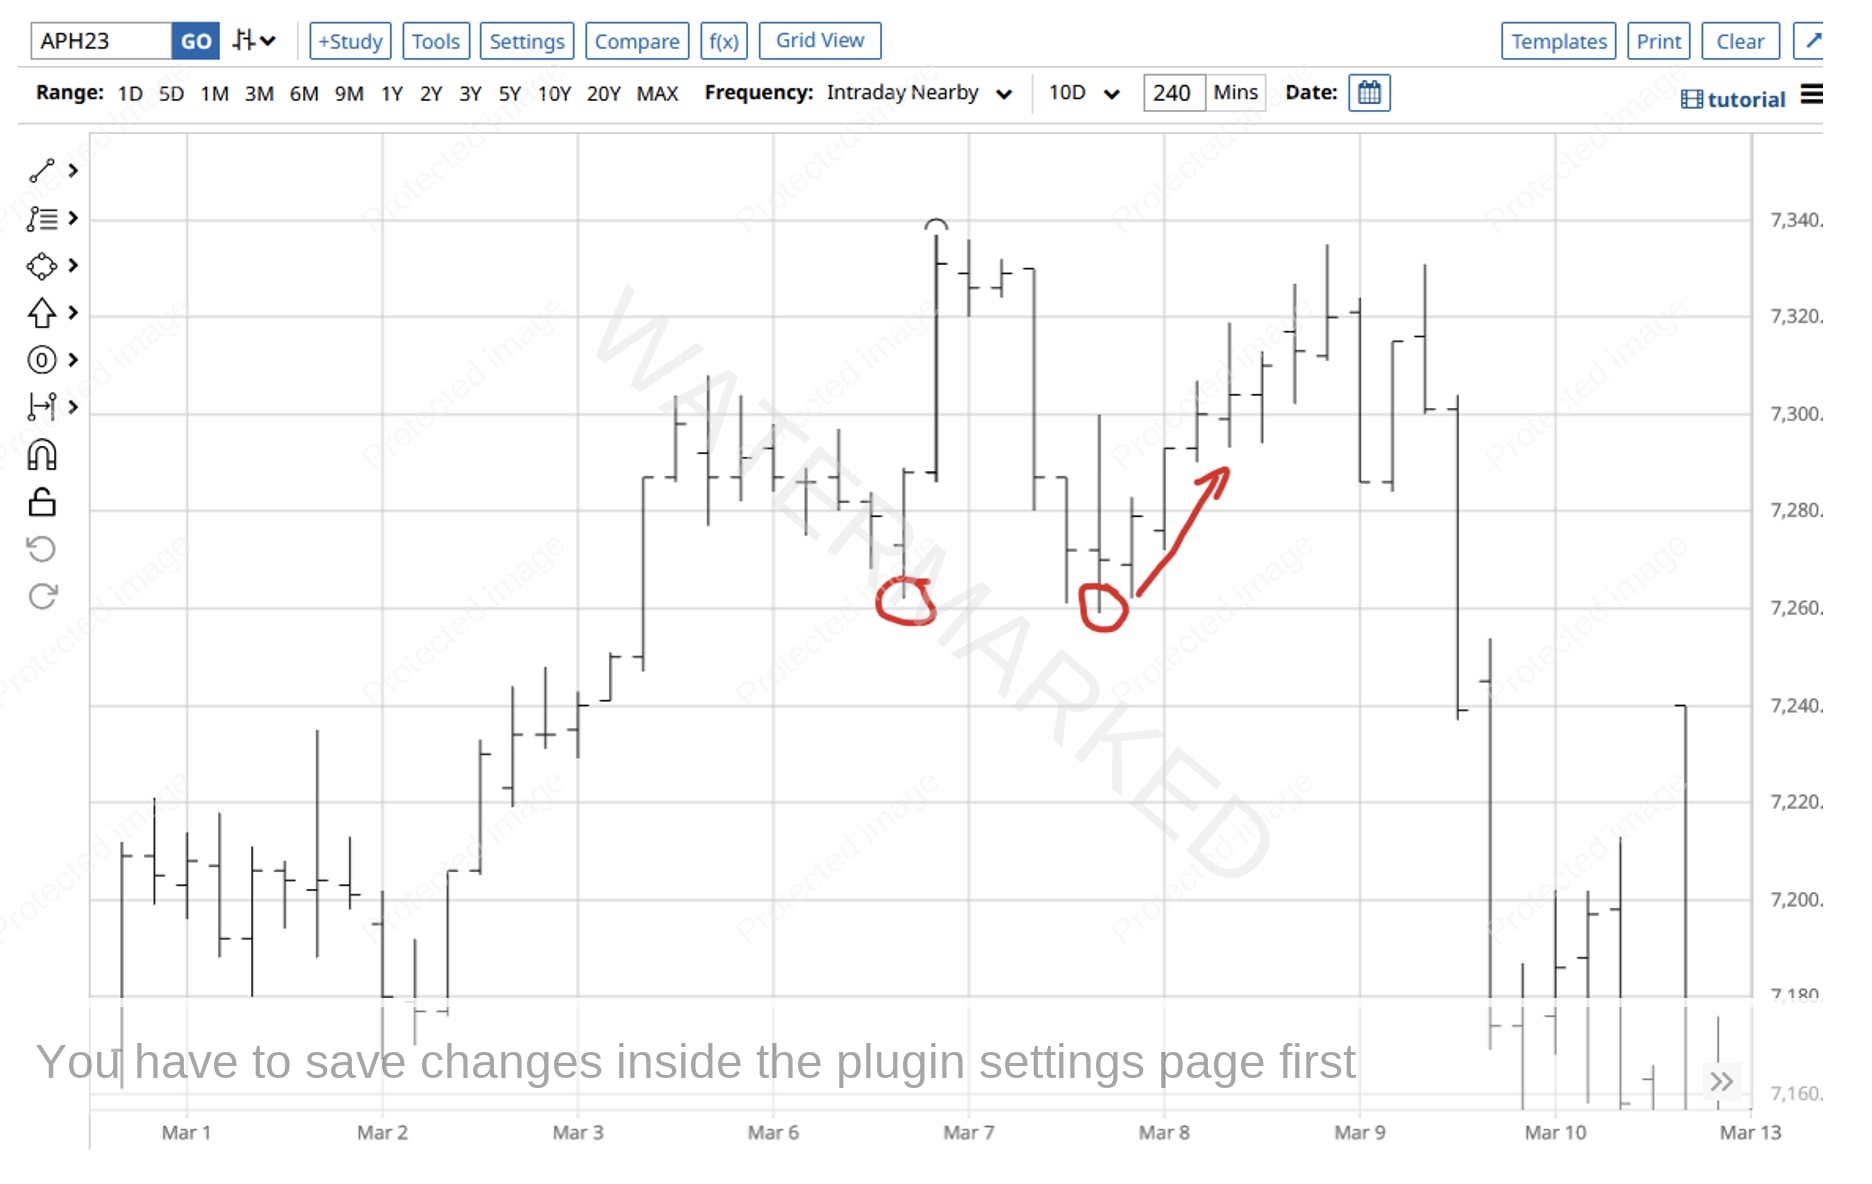
This wasn’t the easiest of trades to hang in depending on how often you look at the market when in a trade. In this case the SPI made intraday double bottoms then came back up and re-tested the 7 March top within 2 points.
Chart 4 – Strong Re-test
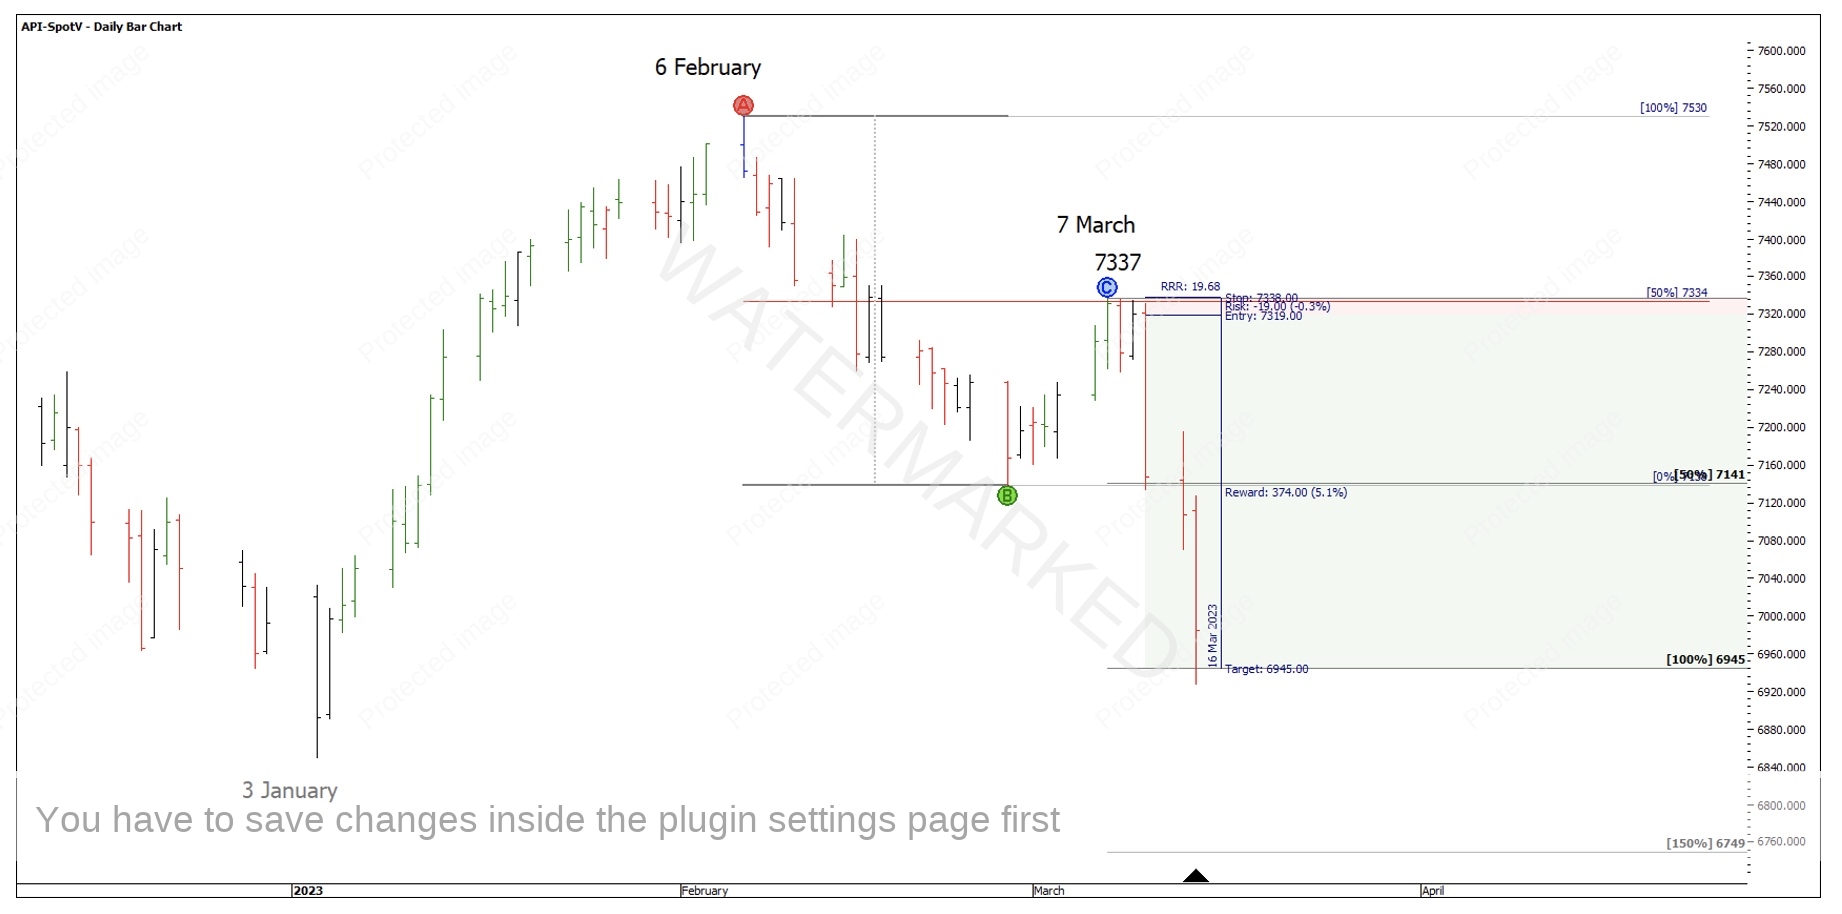
If you had backed your analysis, and had left your stop loss at 7338, then you could have applied the ABC tool to the weekly swing range and identified the 100% milestone as a place to take profits. Exiting here gave this trade around a 19 to 1 Reward to Risk Ratio for one entry in 5 trade days. Goal achieved!
Chart 5 – Reward to Risk Ratio
This wasn’t the only textbook entry that presented, so you could also check which entry you would have preferred according to your personality and what kind of Reward to Risk Ratio you might have achieved.
There are many factors or influences that may affect our performance as a trader. I have found huge value in keeping a trading log in OneNote. OneNote is great for inserting pictures of the setups and keeping a log of thoughts and decisions made throughout the trade. Completing a weekly or monthly review of all trades provides me with some very powerful insights!
Happy Trading,
Gus Hingeley
