Gold Divergence
Last month I discussed the requirements for trends to be in play across the markets we follow to deliver trading opportunities to feed our business. Trends are apparent in many markets, and we can debate the fundamentals around value and linkages to the underlying economy. Equity markets in many countries are making record highs including locally here in Australia, however, the data suggests more businesses are struggling than ever with a record number of small businesses going under in the last quarter. This is ultimately an academic dive into the details, as our type of trading relies on a different set of metrics but it’s fair to say the linkages between the markets and underlying economics are stretched. An excellent example of this was a statistic I heard on the wonder stock Nvidia NVDA.NASD – it currently represents 12% of US GDP!
Last month we discussed how September, based on Gann’s seasonality discussion, can be an active month and we saw the US Dollar Index find a bottom and move sharply to the upside. 99.65 would have been a repeat of the previous range and the low came in at 99.87. This has meant a stronger US Dollar against most major currencies and is typically a bearish sign for commodities. This relationship has held for energies like crude, natural gas, and heating oil but the previous metal markets like gold, silver and platinum have extended their runs into higher prices against the rallying USD.
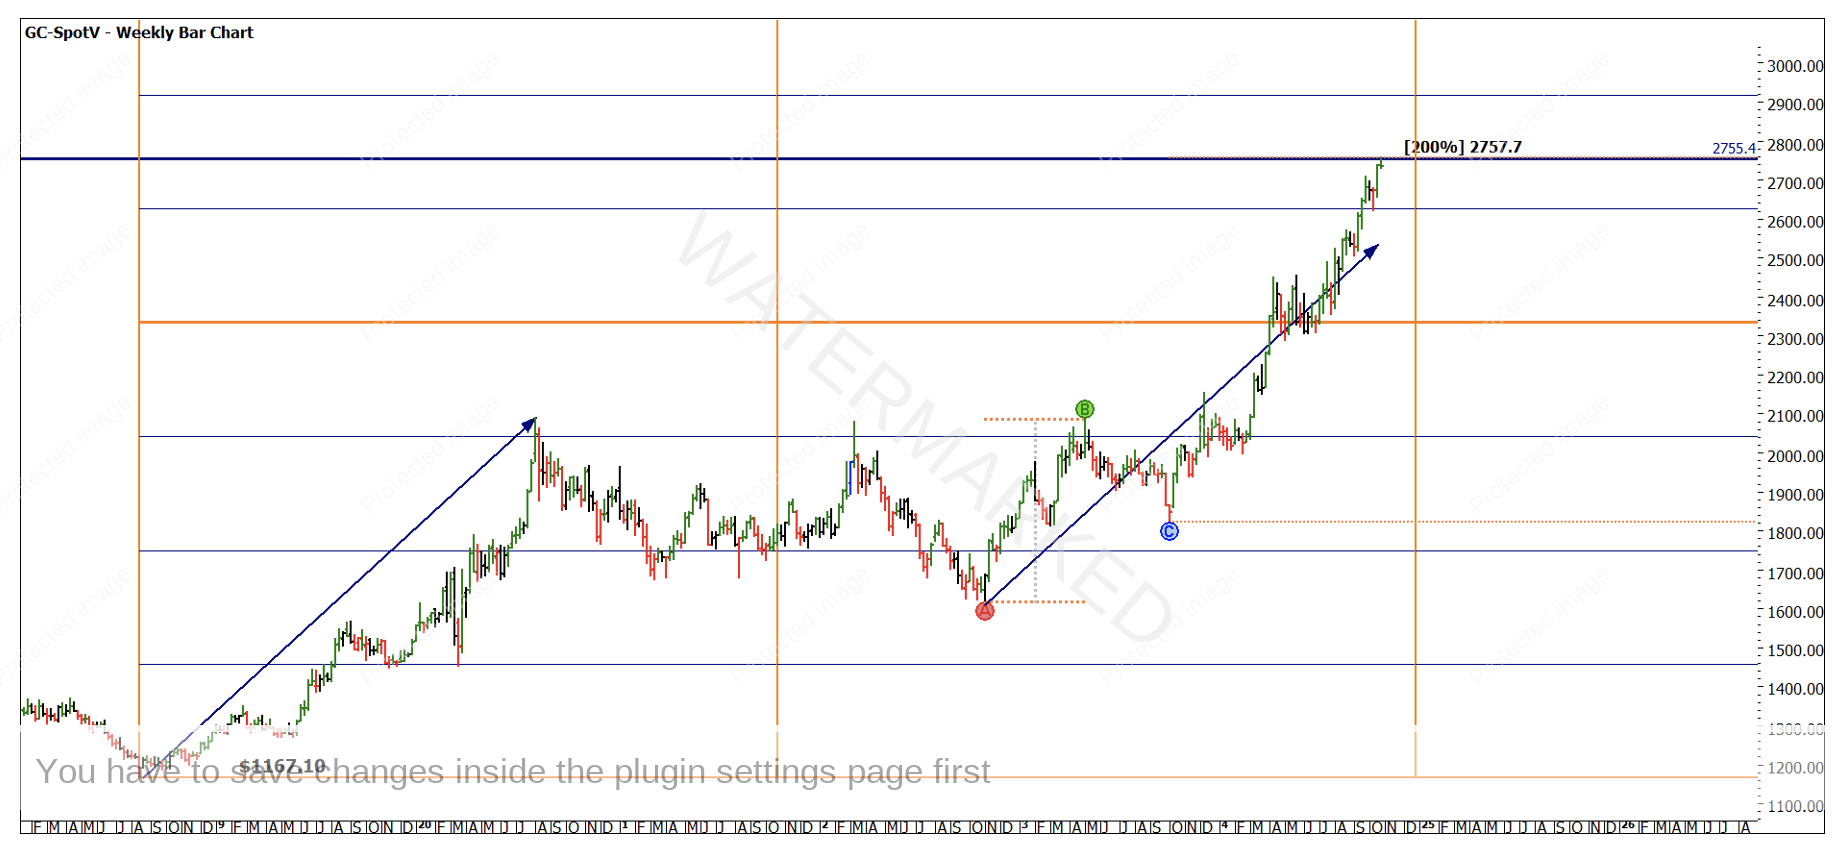
Gold has maintained its lustre as it trades at record highs. Chart 1 shows us several analysis points that I will discuss in turn.
Chart 1 – GC-SpotV Weekly Bar Chart
The horizontal line at the top shows the current highest price at $2,755.40 on 21 Oct 2024. The small picture ABC point that I have highlighted shows us we are at approximately 200% of that range (suggesting ranges are stretched) aligning at $2,757.70 which as per the Number One Trading Plan is how we go about creating clusters in price.
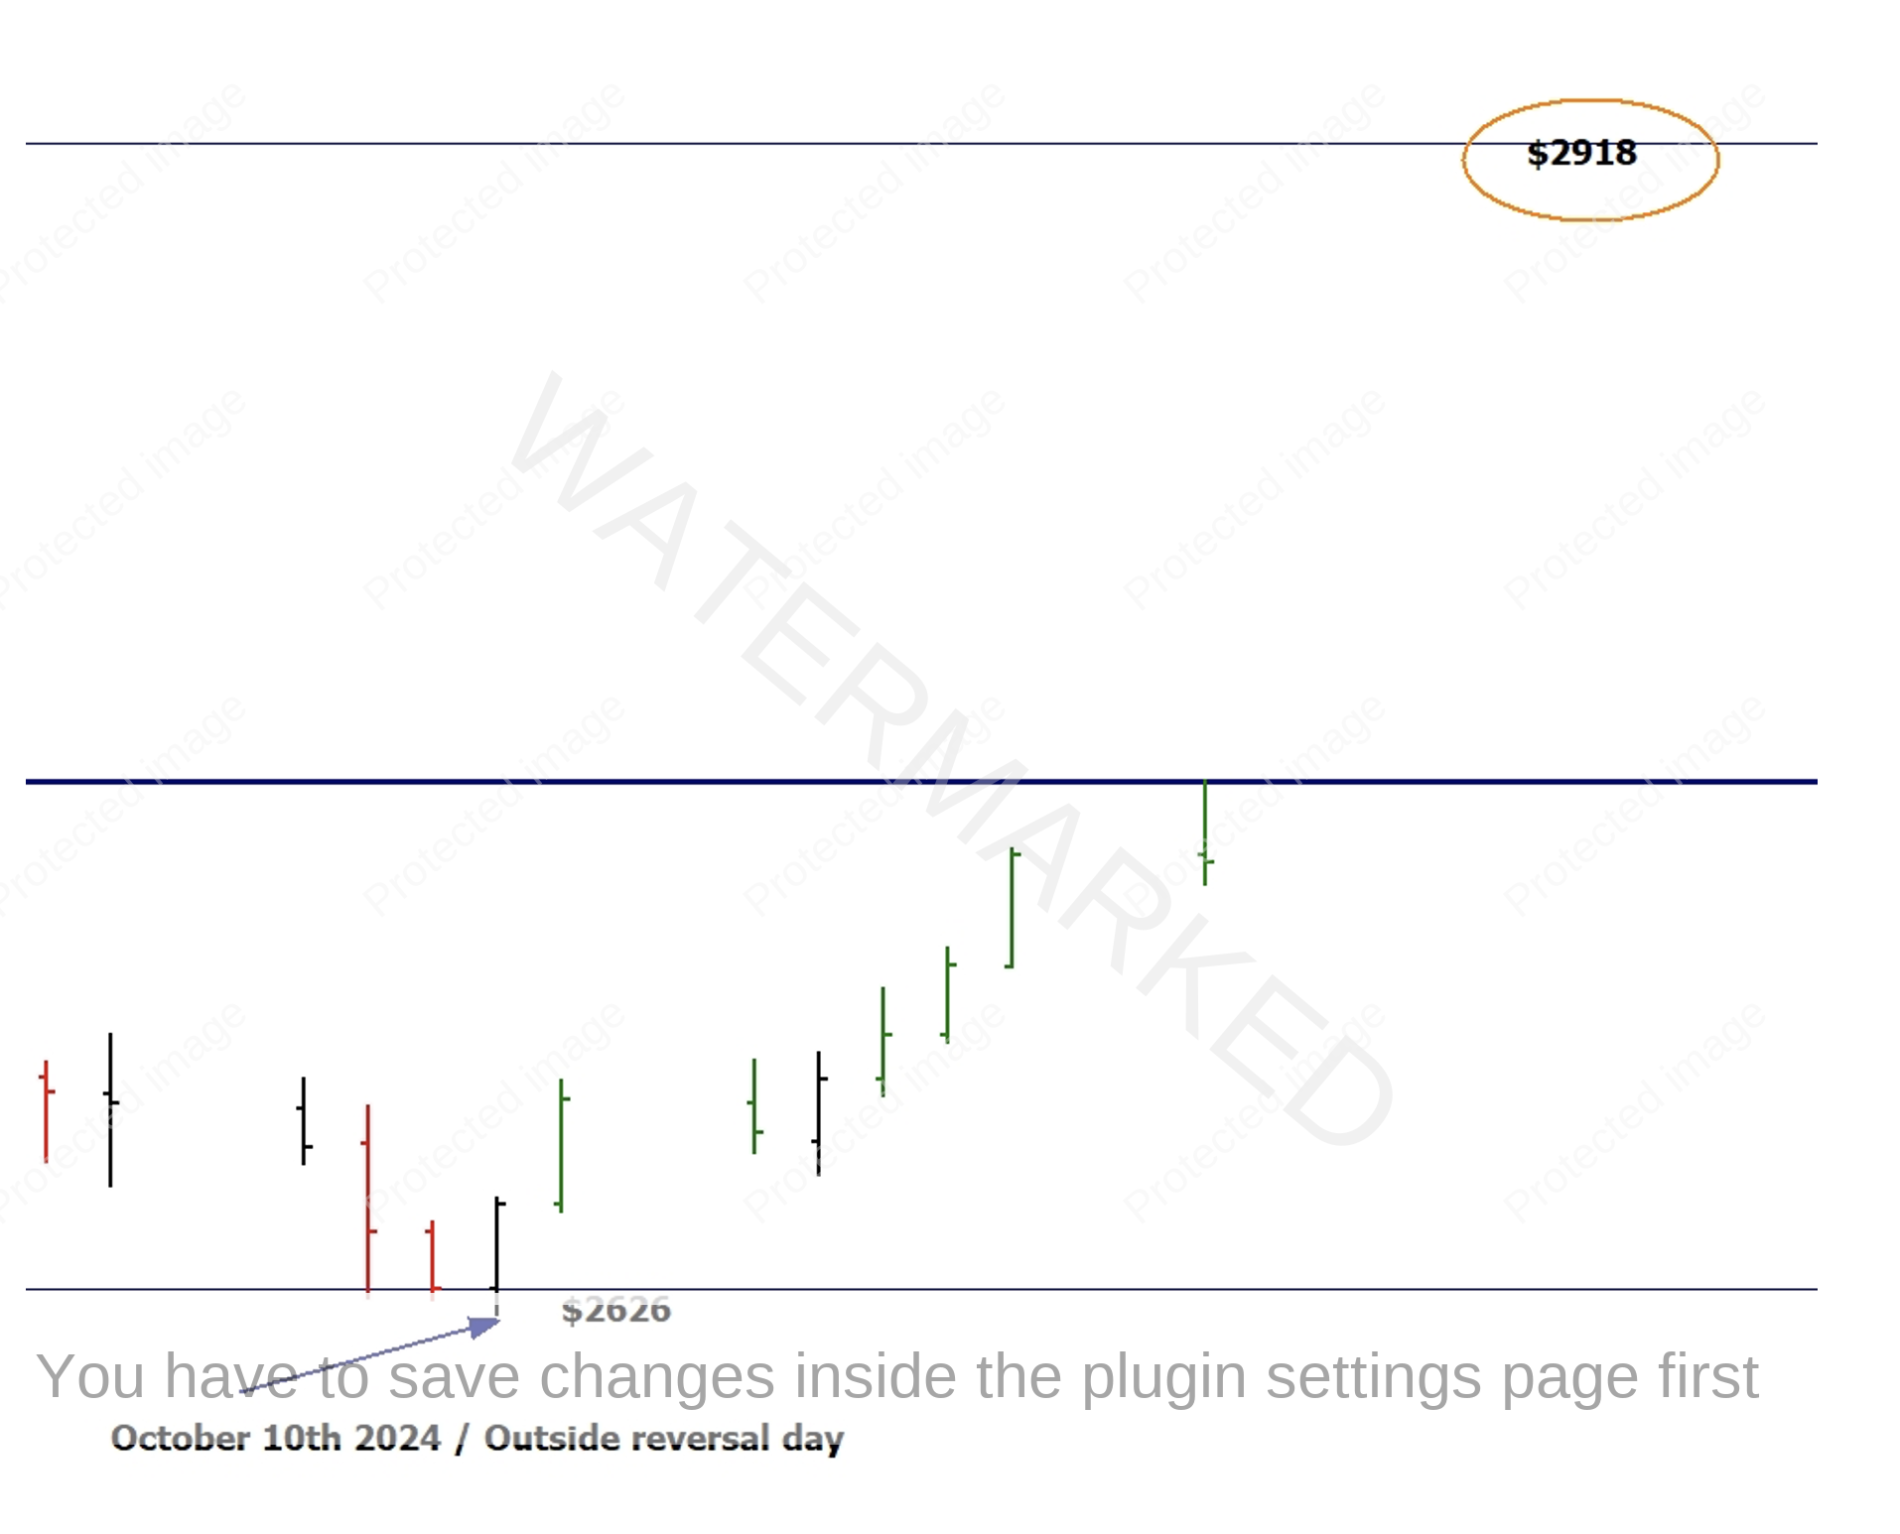
The orange box is using the technique of a Low’s Resistance Card to project prices higher in multiples of 25%. The $1,167.10 low is one low I have included to help us understand where we are on the bigger picture. This low in 2018 was the starting point of this bull market. I note that we would ideally like to cluster a full 100% multiple of this low at current levels if we were keen that this price point is one to watch. We are between two blue lines or 25% multiples. The recent bounce on October 10th is a good example of this and can be used to support our trading plan, watching for setups that align with big picture support and resistance.
I have grabbed a screenshot of this area that shows the outside day on the 10th of October at approx. $2,626 with the next 25% increment at $2,918. These two prices could be seen as bumper rails for Gold, a break down under $2,626 would be a sign that the bears have established control where long trends on swing charts could suggest $2,918 as a price point to anchor our other milestone work to.
Previously we have discussed the largest gold miner Newmont which is listed both in Australia and on the NYSE. This has been a proxy we could have used instead of trading the commodity itself. One advantage of trading this stock in the US is removing the currency aspect of trading a commodity in one currency versus a stock in a different currency. That being said everyone will have their own preference.
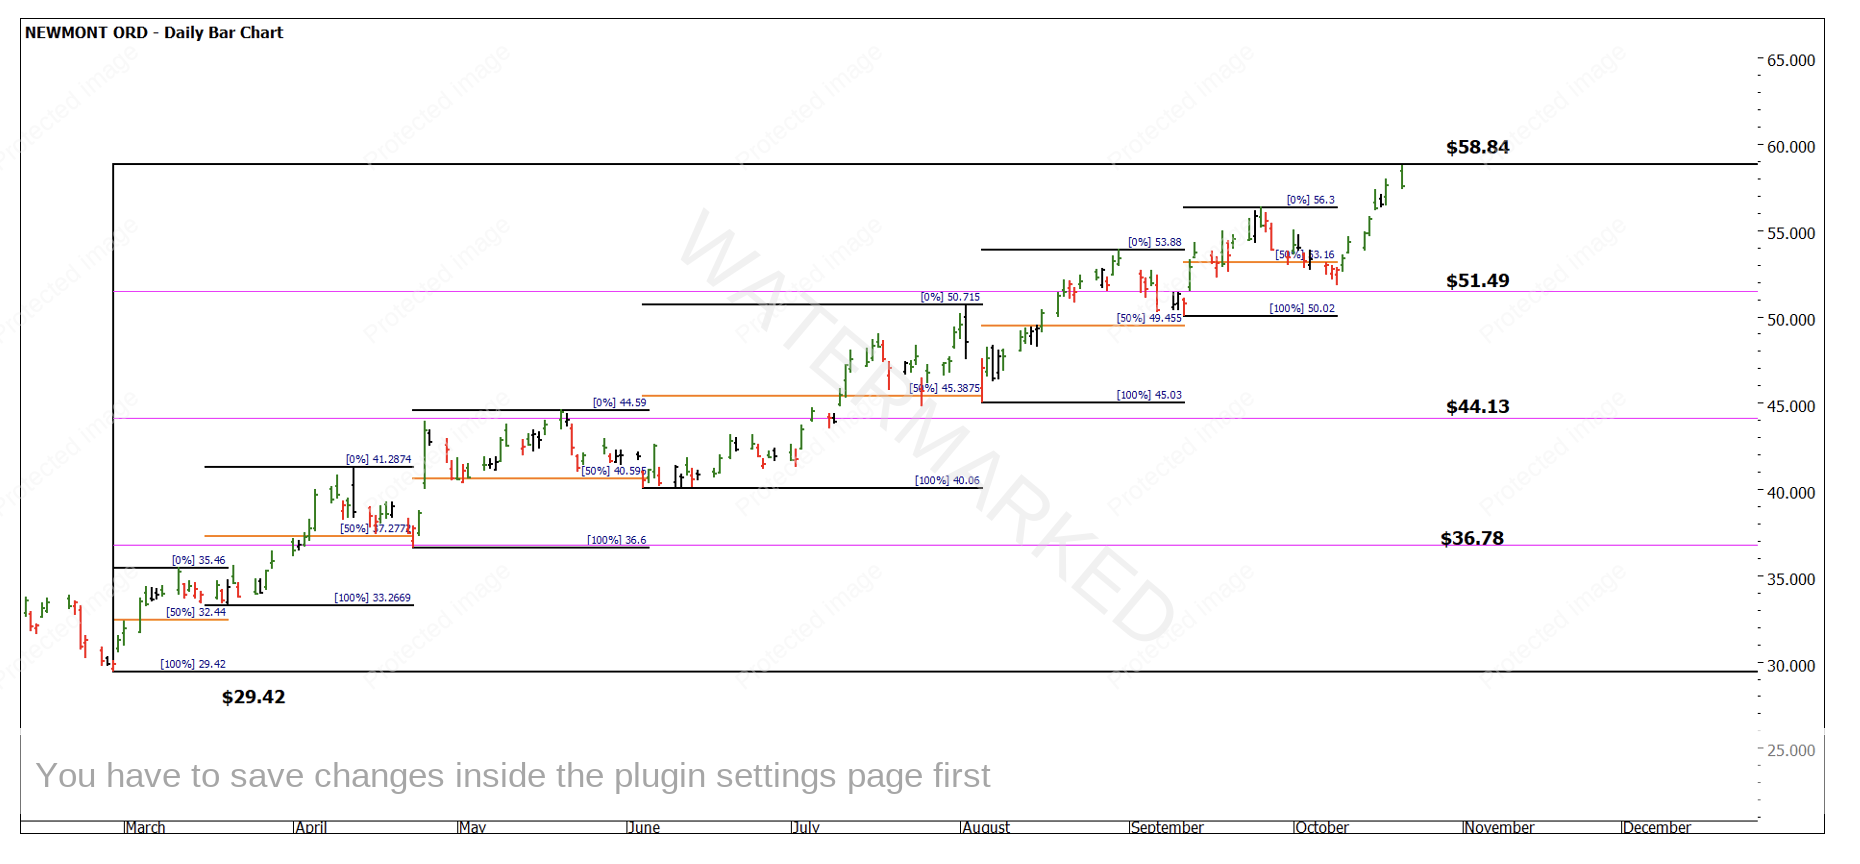
Chart 3 looks at NEM.NYSE and following on from Gus’s splendid work, the notion of testing and researching markets to know what’s normal is an excellent way to get more from your market.
Chart 3 – NEM Daily Bar Chart
The February low in 2024 at $29.42 allows us to review this bullish campaign and understand what normal retracements against the trend are. Simply put, buying the pullback on this market has been an effective strategy and one would have allowed for a simple but profitable strategy.
Again, I have used the Lows Resistance Card at that February low as a framework to watch the markets bounce around in.
Of the six defined pullbacks, Chart 5 showed us a pullback of less than or equal to 50%. With the main note being that the close prices of the pullbacks that went through the 50% retracement level all managed to close above, with bulls being in control on those days. It is only the last pullback in October that differed with a pullback close to 75% being the milestone that stopped the decline.
There was more of a tussle between bulls and bears at 50% and took longer to resolve. We are now extremely close to the level of 100% of the February low of $58.84 with NEM making highs of $58.71 in the last session.
Could we see some resistance at this level? And if this were followed by a retracement of greater than 75% of the previous range, could we use the first lower top as Gann’s safest place to sell the first lower swing top off resistance?
All possibilities should be examined and then allow the market to tell the story. By combining perspectives across the commodity, the currency, and the stock we can overlay our research. Gold has been comfortable to move with a strengthening US Dollar but for how long?
Good Trading
Aaron Lynch


