Golden Times
This month as I attempt to put some thoughts down on markets, I have found it quite challenging. The backdrop of the current political and social challenges we see growing across the world and in particular the US makes me scratch my head and wonder what the world will look like in 20 years.
This angst will often be transferred to markets as the participants are influenced by the comings and goings, and I ponder where will the current cycle complete and what can be done to prepare? As a side note, at times like this I jump straight to David’s “War Times and Market Moves” excerpts from the Master Forecasting Course and bring some lessons from Tunnel Through the Air to the forefront of the lens I apply to markets to make sure I am not missing anything obvious. This is all in aid of making sure I am as prepared as possible. We are often faced with too much information so a refresher on the big rocks can be helpful.
The economic backdrop of sticky inflation, slowing growth and higher interest rates remain major obstacles to the global economy. An area of markets we hear about on and off is of course the metals markets. Best broken down into precious and industrial metals, we see a focus on both here in Australia as we are blessed with stocks of both in our dirt.
The fortunes of iron ore and the rare earth types used in our ever-growing need for batteries get a lot of the attention, but we do produce a lot of the precious types such as gold, silver and platinum. These metal types have cross over in industry as well as jewellery and have the added following of the stackers, hoarders and folk who believe that paper currency will eventually fail, and we will need to go back to basics.
Chart 1 shows us the current price action of gold, traded as a futures contract out of the US. The variable of being priced in US dollars adds another variable to manage but this is the case in all markets we trade that are based around a physical item.
The big picture uncovers the bullish move which started in 1999 and continues in what could be described as a second section, at approximately 75% of the previous move.
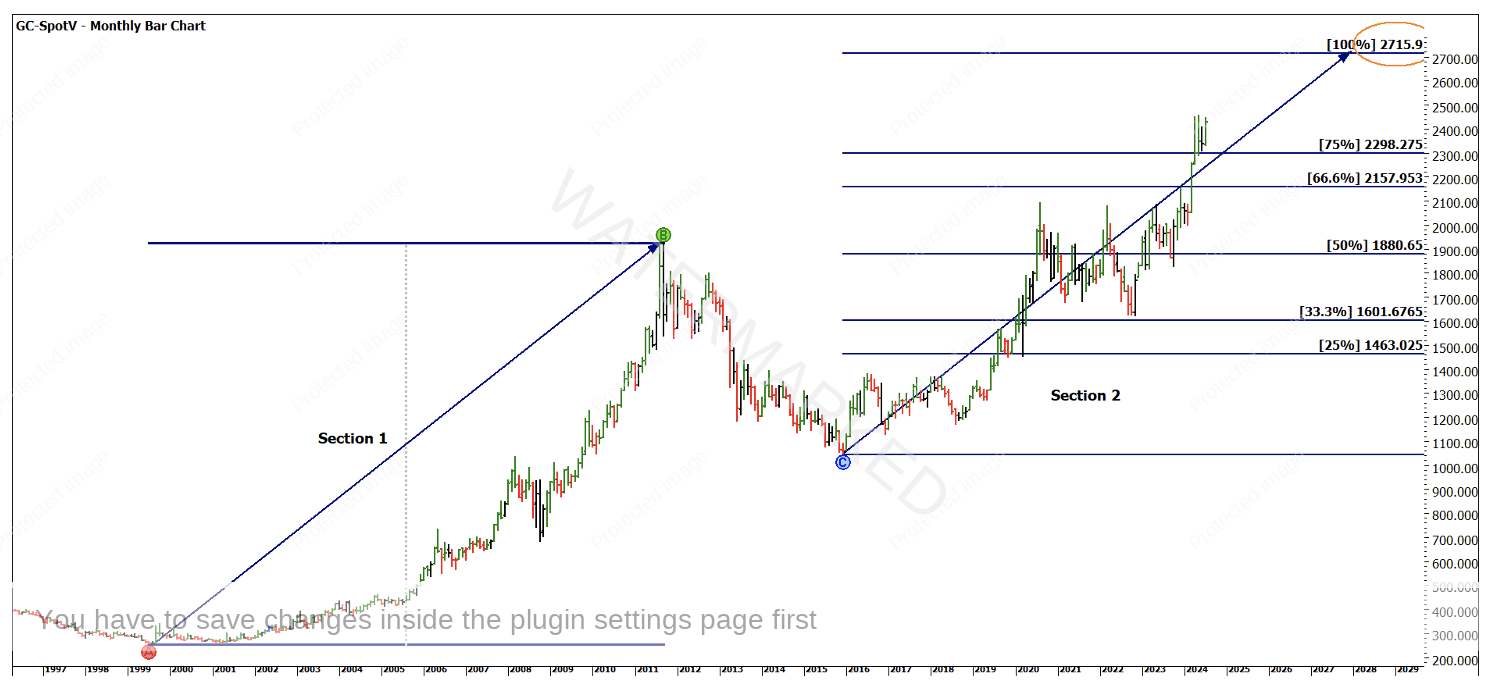
Chart 1 – Monthly Bar Chart GC-SpotV
Chart 2 takes us into the smaller picture with the last 2 years suggesting the current range has expanded compared to the previous and what could be described as a triple top on the small picture is holding at the 133% level. Overall, we have seen prices trapped sideways since April but there could be a guide to what’s next.
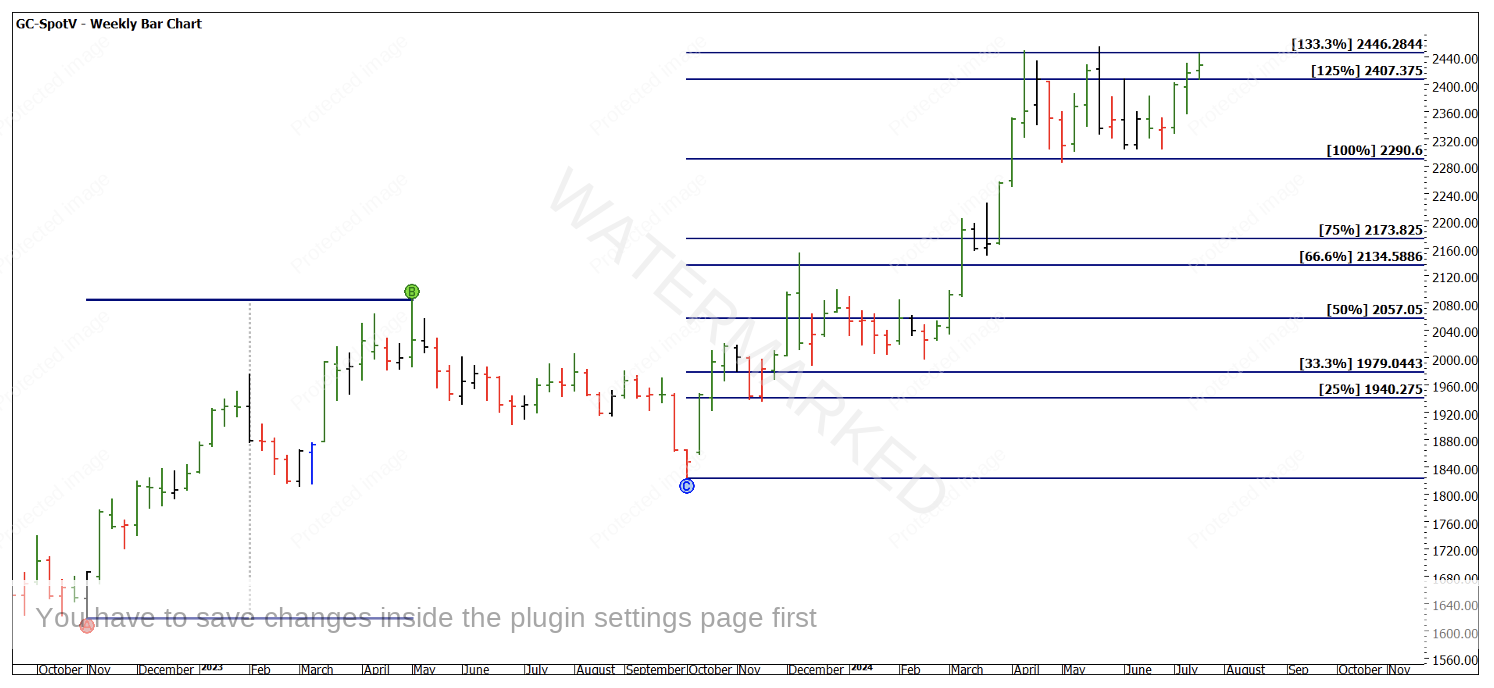
Chart 2 – Weekly Bar Chart GC-SpotV
Commodities overall will benefit from a higher inflation environment, and I think most of us would agree that our dollar is not travelling as far.
Chart 3 continues to build on the work above by adding some basic time counts to see what numbers are occurring and if they are repeating in a way we can recognise.
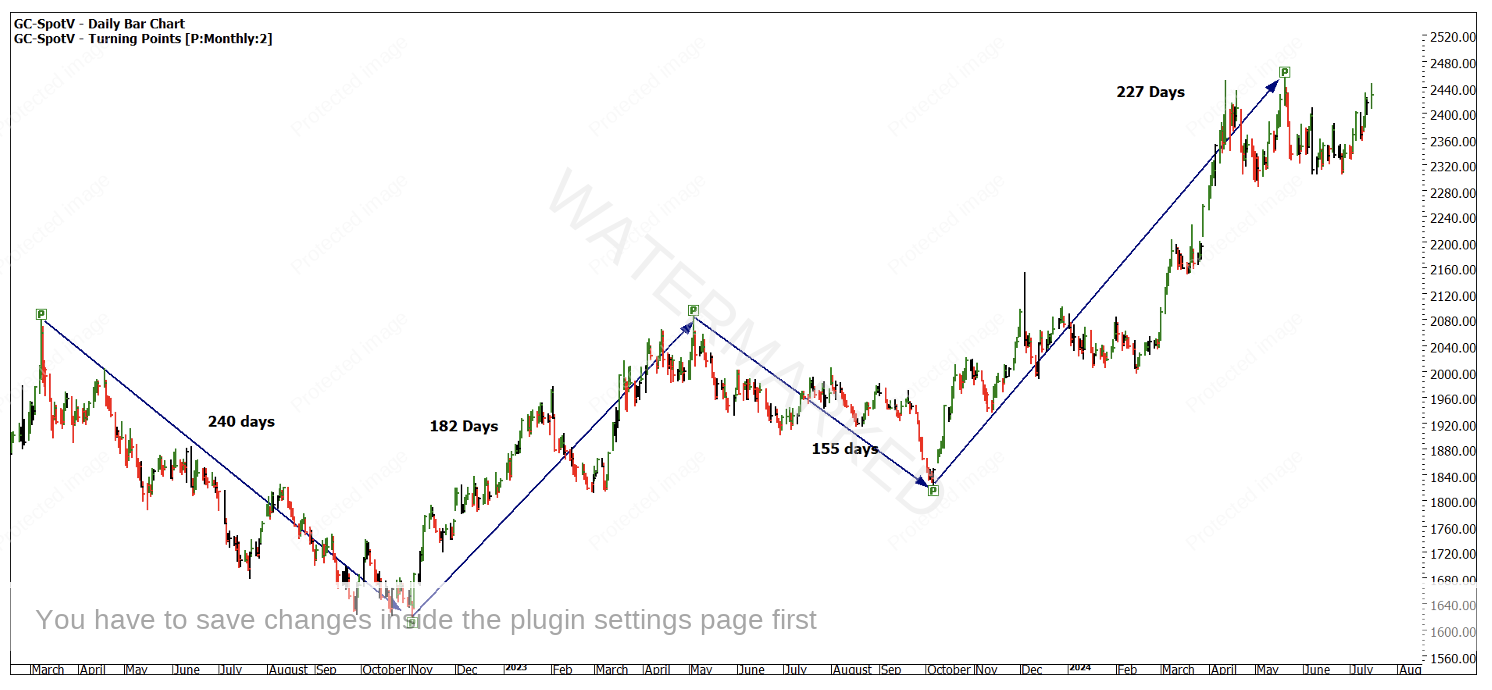
Chart 3– Daily Bar Chart GC-SpotV
These smaller time frames can then be married with the larger top to top and bottom to bottom time frames to allow us to layer some time frames over the coming months. We can see in Chart 4 three-time frames projected from the low in October 2023. This gives us some dates to anchor around in the last quarter of 2024.
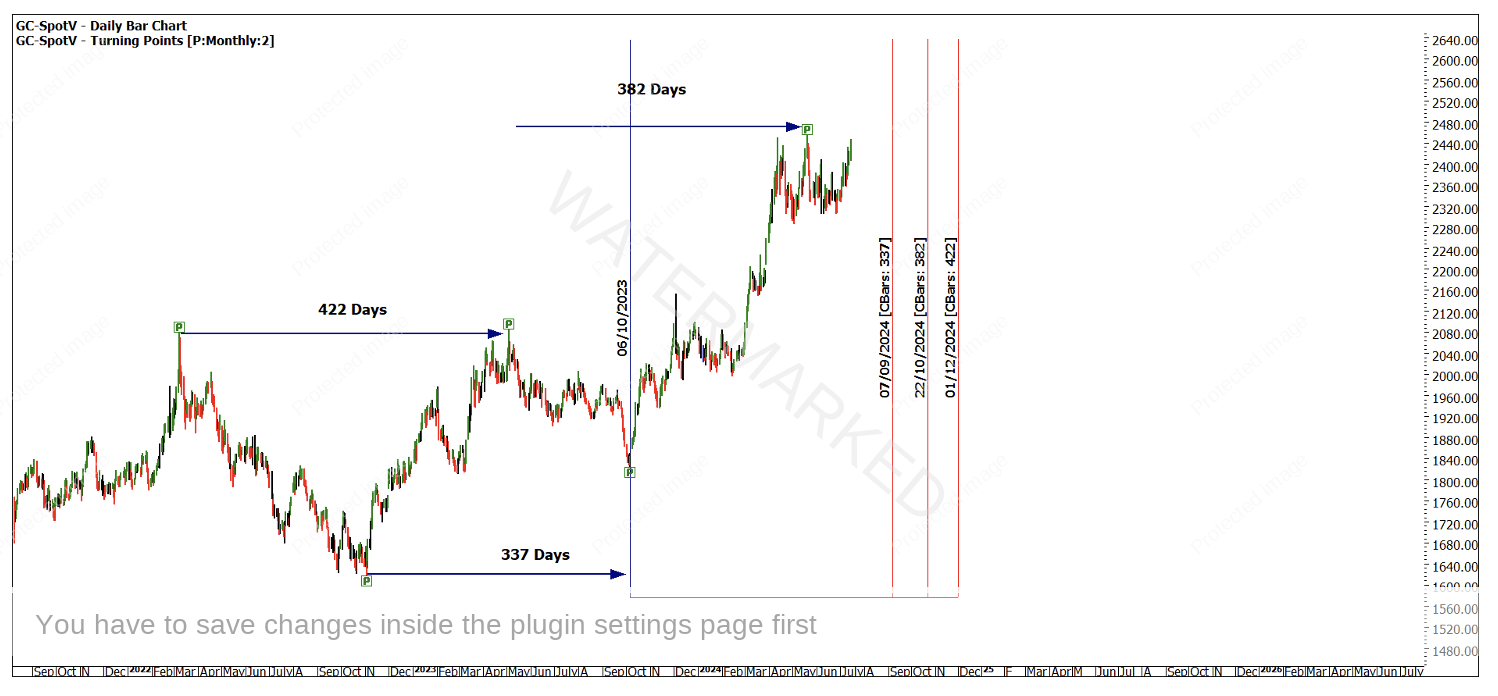
Chart 4– Daily Bar Chart GC-SpotV
Much has been written and discussed around the use of Gann’s 144 in terms of all three dimensions of Price, Time and Time and Price. I find that this broad area of analysis works historically well on Gold, and I am keen to always link it in where possible.
The final chart I will leave with is some loose anchors that relate to Road Maps I am watching. This requires us to understand turns more so based on what happened (strength of moves) as opposed to a physical top or bottom. The top in 2012 was a more tradeable turn than the 2011 high. The same with the 2018 low being an easier and stronger low than the 2016 bottom.
By using these anchors, we can see the last quarter of 2024 will give us approximately 144 months from previous turns. This should allow you to tune up your charts on Gold and see what other analysis we can overlay, then we wait for our signals via our trading plan.
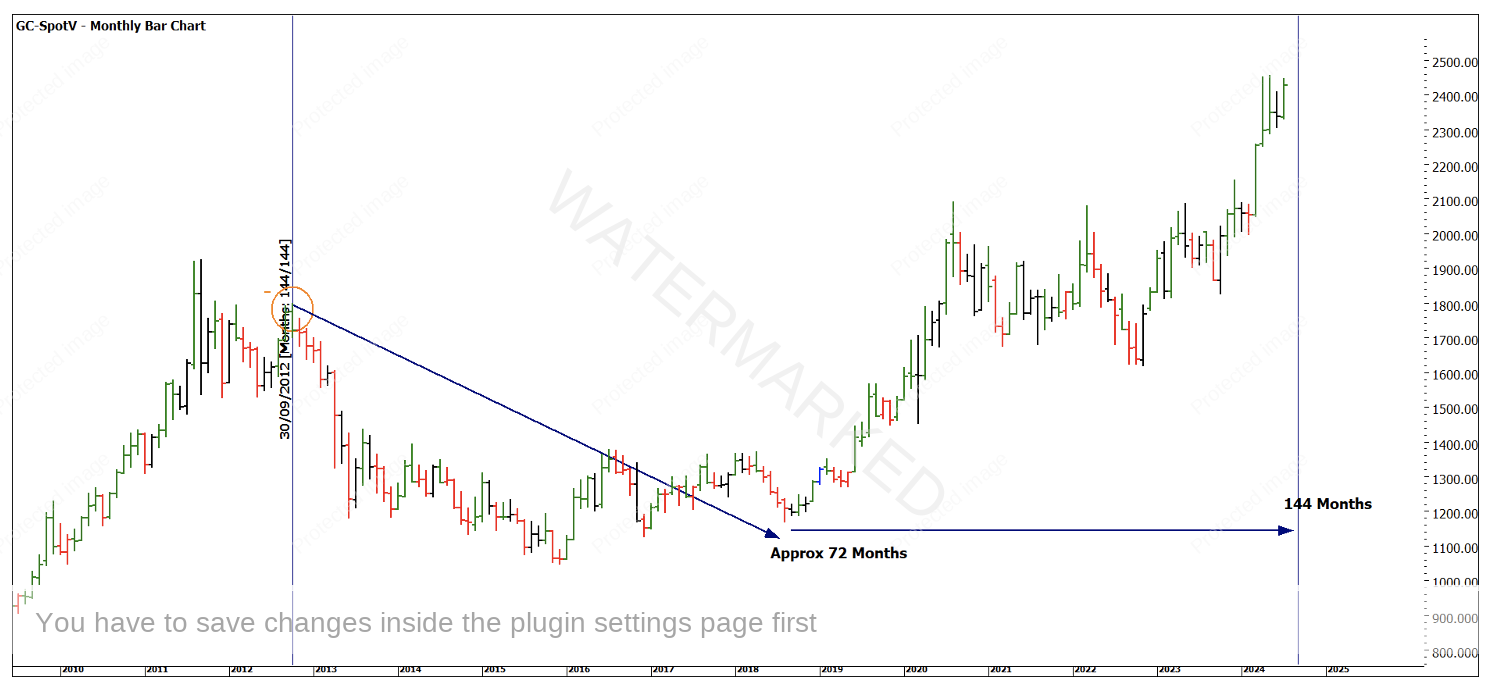
Chart 5– Monthly Bar Chart GC-SpotV
Good Trading
Aaron Lynch