High Grade Update
Back in June, I reviewed the position of the Copper futures market. This has often been a “go-to” market for me over the years when primary markets are not behaving in the way I would wish. A quick glimpse of the Crude Oil chart will tell you why that market has been a low yield trading environment in the last few months. Sideways is the theme in that market, but there is still value in analysing it to understand if this current pattern is following history or is an outlier in the data. From there we can look to understand using time-based techniques to understand what’s next.
The allure of commodity trading is that these are products needed by people for many business dealings. I have spoken about the Gold/Silver markets and the associated “safe haven” thinking that can push prices around. If I had to choose between those two, Silver is the better, more orderly, market to trade. In the case of Copper, it’s not regarded as a precious metal, and no one (that I know of) stores it in bars in a safe or under the bed. It’s a pure supply/demand process with a number of other variables thrown in.
Please re-read my article from June, Markets that Trend, to refresh your memory. We were looking at some big picture price pressure and some time elements suggesting potential resistance around the 2.65 level. Since then we have seen prices over 3.00 and potentially more to come.
Chart 1 gives us the current position of the high-grade Copper futures market HG-Spotv in ProfitSource.
The chart timeline has approximately two years of market data with the cycle from the high in June 2018 completing with a low in March of 2020. Since that low, the price action has recovered to 25% of the range (from the top) and is finding resistance around old tops at approximately the 3.00 level.
The trend is up on the weekly chart with higher tops and bottoms.
Chart 1 – Daily Bar Chart High-Grade Copper
There have been a number of tops around this resistance level in history, with Copper showing the same effect as stocks with even amounts in price. When I note 3.00, we are talking $3.00 USD per pound. One futures contract controls 25,000 pounds, so packs a punch on the leverage with each tick of 0.0005 worth $12.50 USD per contract.
We can see why the current price level has created resistance when we refer to Chart 2 and step back to the previous bullish range in the form of a Ranges Resistance Card. The orange line is the 50% level and the blue line the price level we were discussing in June. Overall, we could say the March low is a potential double bottom with Jan 2016 and further upside is possible if we can get some traction above the 50% level.
Chart 2 – Daily Bar Chart High-Grade Copper
As a keen student of history, I am seeing a previous area of the market from 2010 that looks similar to where we are now. In Chart 3 I have setup the low from June 2010 and using a speed angle I will bring that forward to the day of the March 2020 low.
Chart 3 – Daily Bar Chart High-Grade Copper
Chart 4 – Daily Bar Chart High-Grade Copper
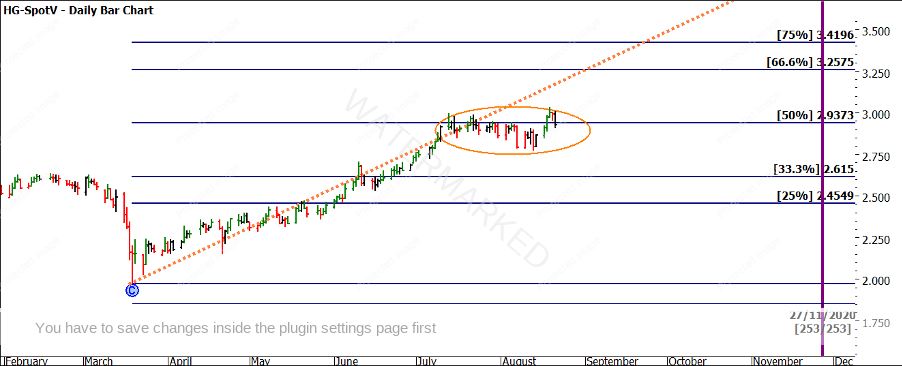
Chart 4 confirms that we are again at resistance of 50% of the move we saw in June 2010. The speed angle in orange was calling the pitch of the market until around July when it began to move away suggesting this market is running out of momentum to the upside. I am watchful of what’s next, if the Copper market can move above the 50% point, we may get some catch up back towards the orange speed angle. A point to add will be that the value of the US Dollar will play a big part of the next move.
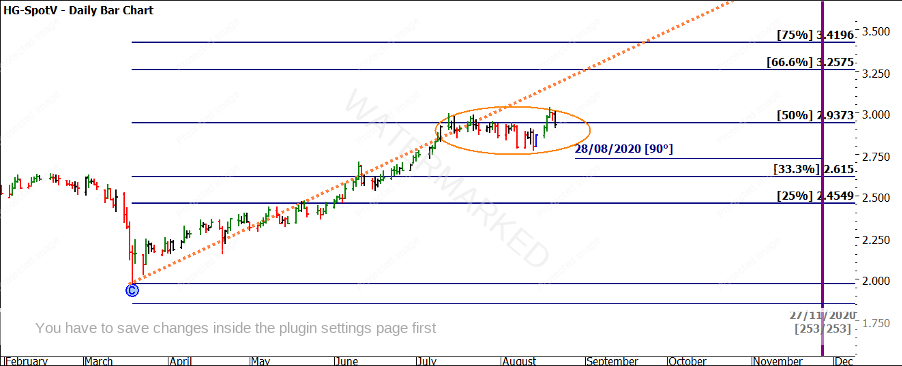
Given we can also use the end date of the June 2010 cycle, 253 days from A to B, we can now plot and end point or zero date. The purple vertical line gives us the 27th of November this year as a place to watch. In Chart 5 you can see I have run 90 degrees back from that date to give us late August as a potential turning point. Ideally, this would be a low that springboards the market higher, but as we know forecasts are nothing till the market responds with signals and confirmations via our trading plan.
Chart 5 – Daily Bar Chart High-Grade Copper
I encourage you to layer further analysis on these lows from 2010 and the current Mar 2020 low. There are some more similarities that can be uncovered in both price and time. Also, the end date in November is not shaping up as a major earth-shattering cycle end, it may be a medium-sized cycle within a larger one, in your research you’ll see how it’s syncing with an even bigger picture.
Good Trading,
Aaron Lynch


