Higher Swing Bottoms
In last month’s edition of the Platinum Newsletter, we were watching for a bottom on Bitcoin. Students who own the Ultimate Gann Course can review the article ‘Bottom’s Up’ and previous articles from the Platinum Newsletter within the Member Portal of the Safety in the Market website.
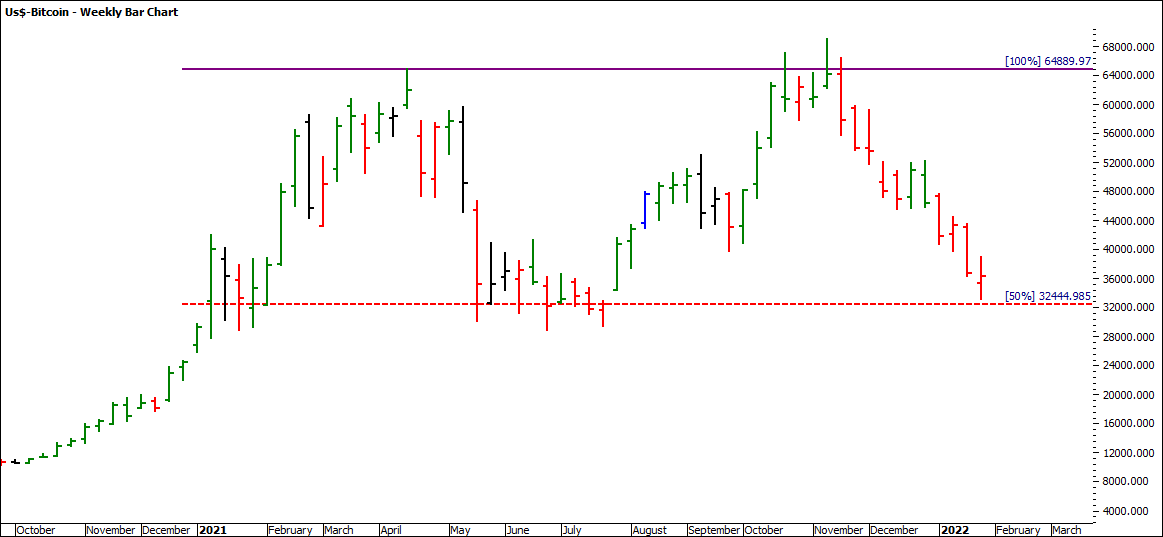
The previous All-Time High (ATH) on Bitcoin came in at 64,899.97 in April 2021. The market naturally fell to the 50% level at 32,449.99 in May 2021, finding support consecutively prior to retesting its ATH late in 2021. As you will note, the market retested the ATH, failing a third time to close above it and producing a Double Top. The market since then has fallen straight back to the 50% milestone on the All-Time Highs Resistance Card at 32,449.98.
These techniques are taught in the Number One Trading Plan and are expanded on in the Active Trader Program Online Training.
Turning our attention to the bitcoin chart (ProfitSource Code: FXBCUS), we can explore how we could have traded out of the higher swing bottom using a combination of price, swing charts and form reading.
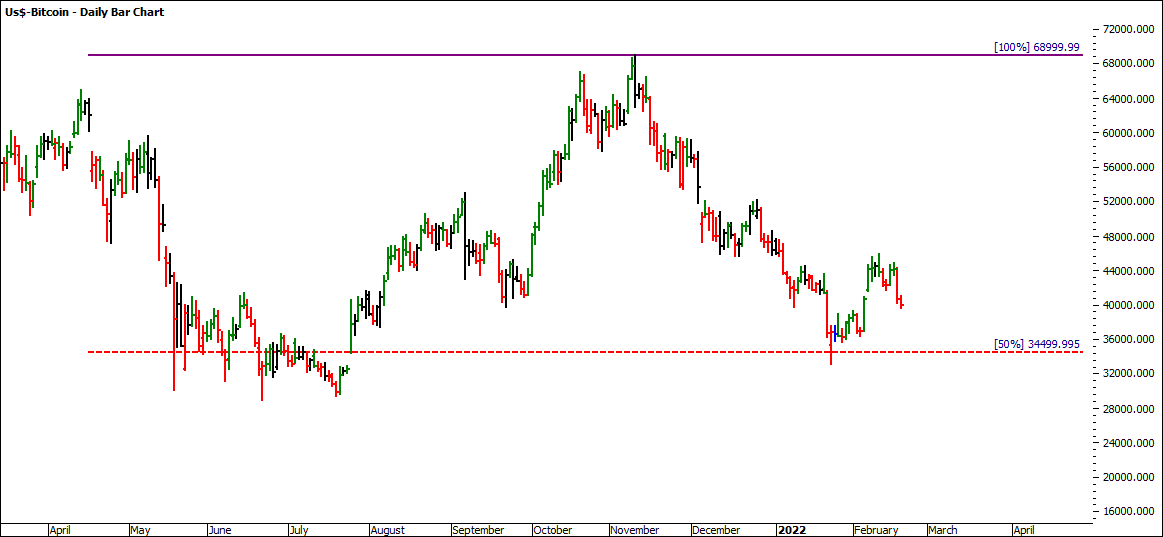
Applying the Highs Resistance Card to the new All-Time High on the 10th of November 2021 at 68,999, the new 50% level comes in at 34,499. The market made its low on 24 January 2022 at 32,950. Note that the daily bar failed to close below this level which was the first sign of a reversal.
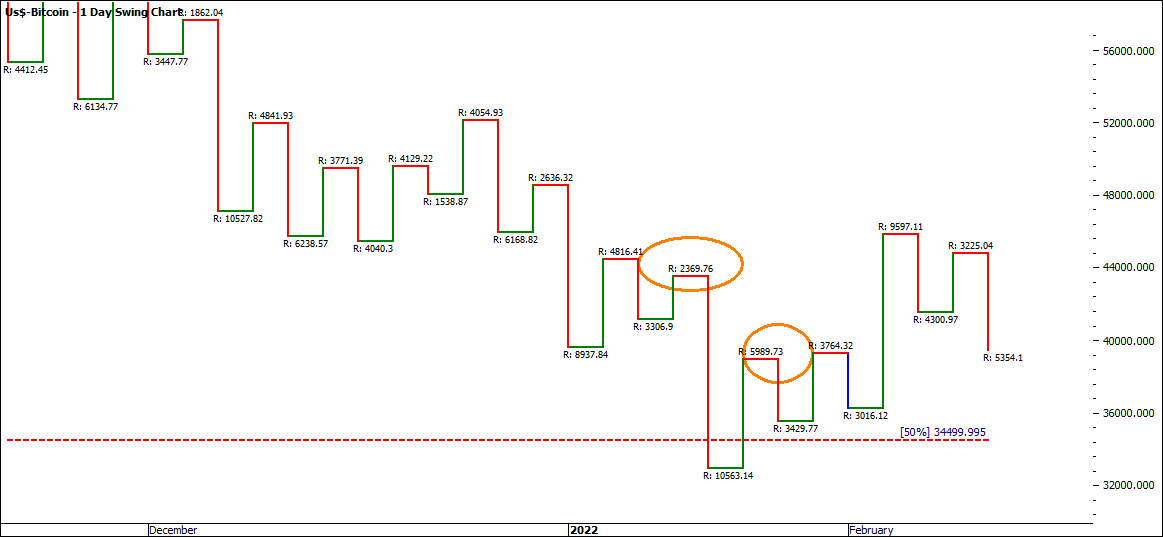
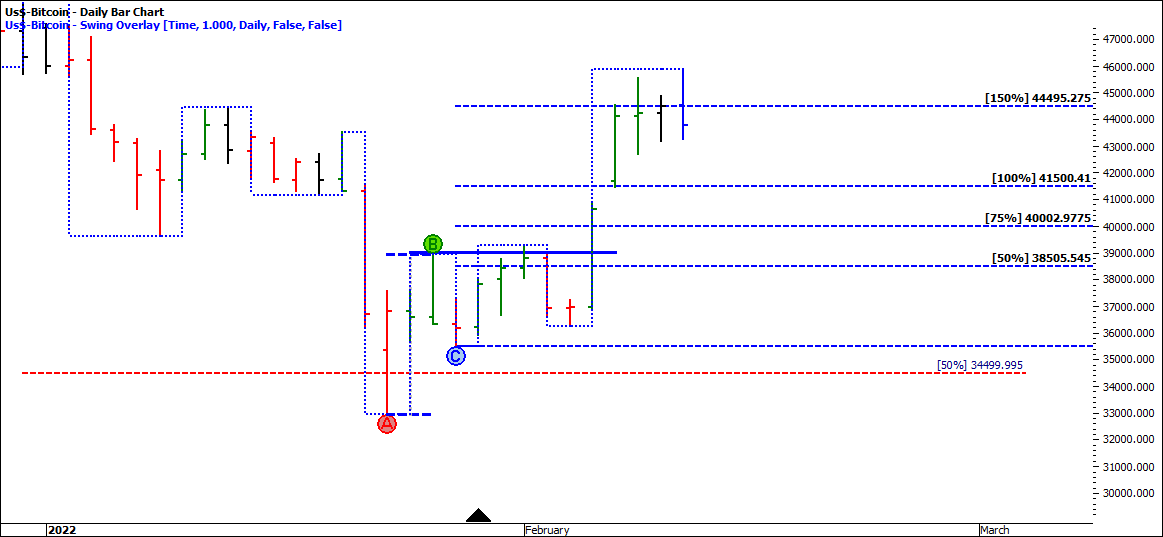
Turning to the Swing Chart, you will notice that the up ranges were expanding, and the down ranges were contracting. The upswing range of 5,989 was also two times greater than the previous up swing at 2,369, suggesting an overbalance in price.
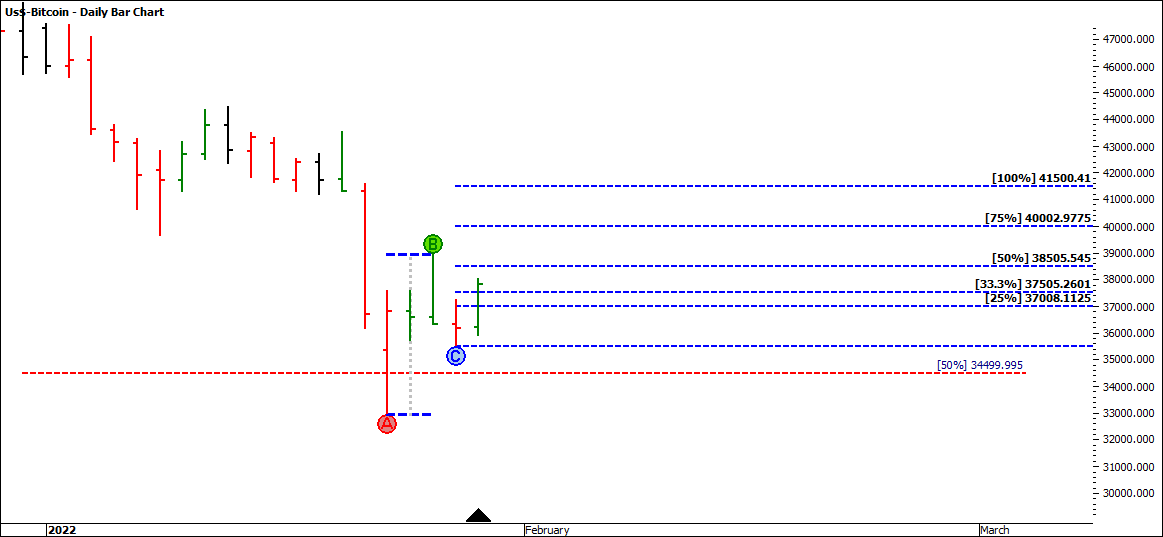
The initial Higher Swing Bottom might not have provided enough confidence to execute a trade. You would have also struggled to obtain an entry by 25% but you would have been filled if you allowed for a 33% entry limit.
Assuming you had entered the market already, the following three days would have shown an expanding upswing. The pullback provided an option to add to your position on the break of the swing tops.
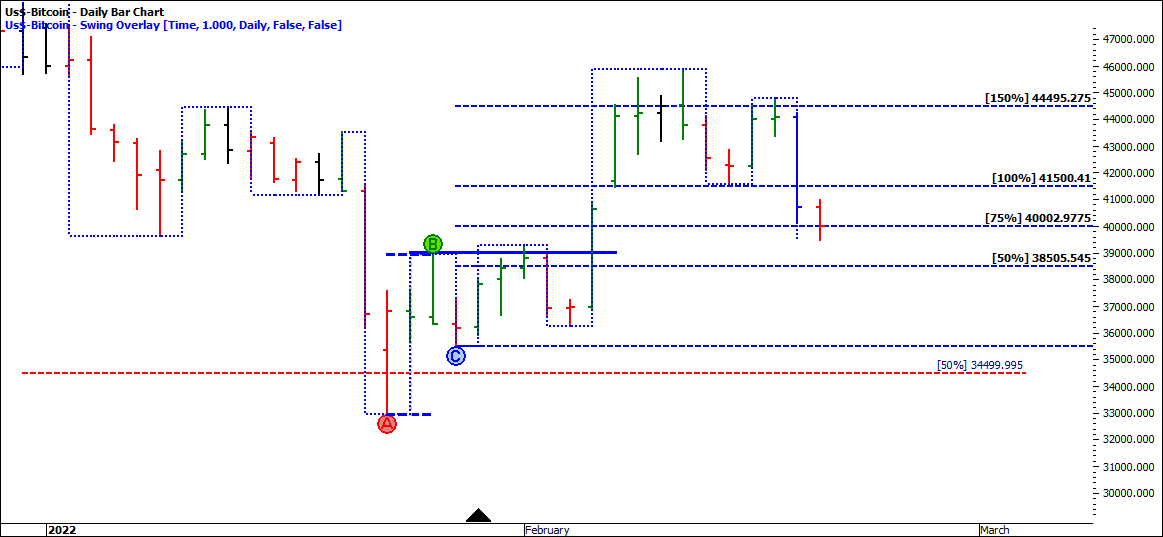
In addition, depending on your trade management strategy you could have also been stopped out at entry plus commission. Assuming you thought there was further momentum in the move you might have given the market some breathing space and moved your stop loss under the low of swing bottoms. The market continued to move higher, hitting the 150% milestone.
David tells us to watch the 150% milestone for potential reversals. In this case the market has retested the 150% milestone and created a lower swing top.
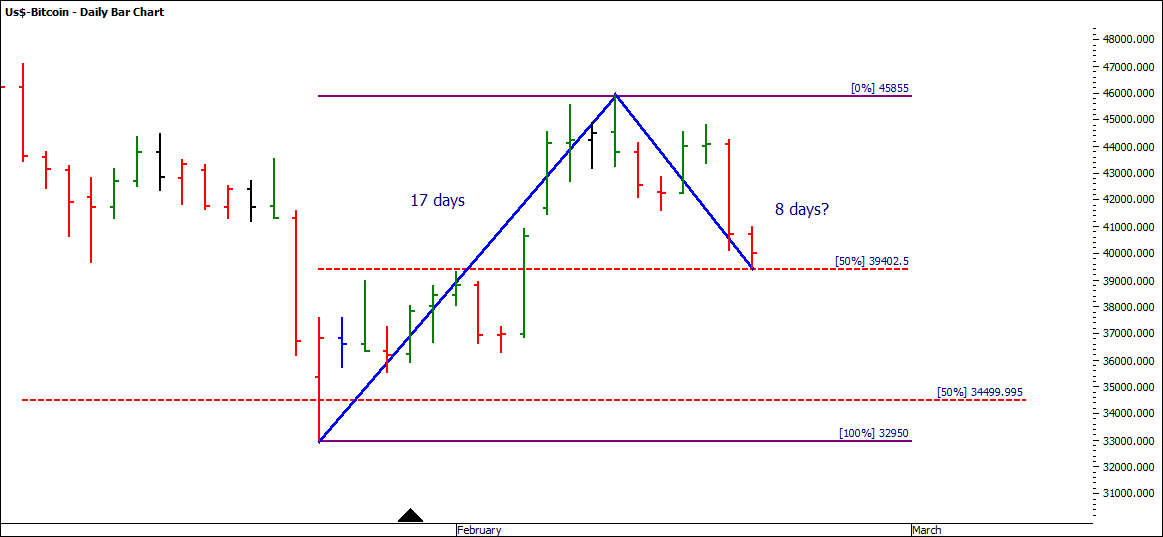
Looking at the bigger picture the market has since come back and sat on the 50% milestone of the total range at 39,402. This is a Range Resistance Card between the low on the 24th of January at 32,950 and the high on the 10th of February at 45,855. For those who are interested in taking the next step to Platinum, if you measure the days up from the 24 January low to the 10th of February, you will see that it produced 17 days. 50% of 17 days is 8.5 days or rounded to either 8 or 9 days. Currently the low sits at 8 days. This is 50% in time and price.
It will be interesting to watch the market move away from the 50% level. You will know that old tops become new bottoms. Whether that be the case or not, as time progresses, we will watch the market unfold and put together the puzzle pieces.
It’s Your Perception
Robert Steer
