fbpx

History Repeats Webinar

An Introduction to Road Maps

Saturday 19 June 2021 – 9.00 am – 5.30 pm Sydney Time

Hello,

It’s Mat here. I know that studying Gann can be both a hard road and a long one. It’s easy to get lost along the way, buried in your research and overcome by analysis paralysis, so it’s important to stay focused on what Gann and David told us right from the start – that history repeats.

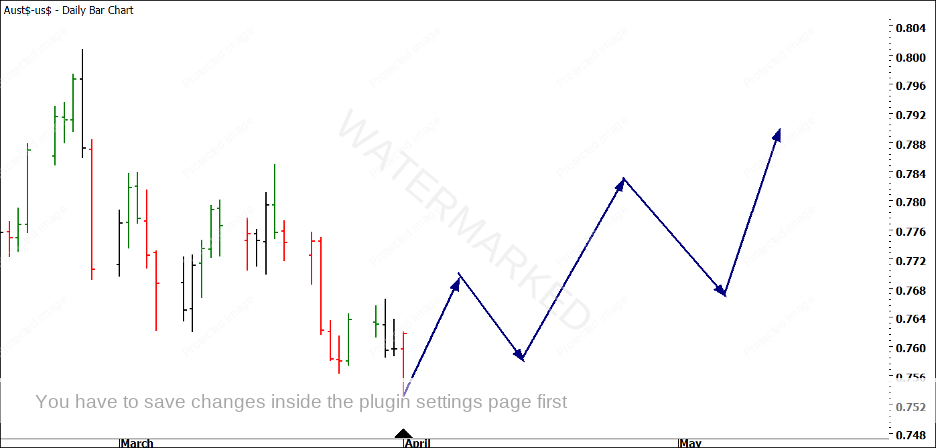
Gann wasn’t speaking in riddles when he said this. History literally repeats! Whenever I take a trade, it is ALWAYS aligned to a Road Map, a previous section of the market that is repeating… Always.

Many of you would be familiar with the Pareto Principle, also known as the 80/20 principle, which states that 80% of our results come from 20% of our efforts, and I can honestly say that has been my experience with Gann research. After more than 15 years of studying Gann, I would say that at least 80% of my results, probably closer to 90%, comes from just two techniques: Ranges, which are the first thing we learn about at Safety in the Market, and Road Maps, which are the last thing we learn about in the Master Forecasting Course.

Now, you can do a lot with Ranges alone. For example, I predicted the recent 7674 weekly swing low on the Australian Dollar/US Dollar pair, in advance, and it came in exactly correct, to the point. So, for anyone underestimating the value of the Number One Trading Plan, there’s a good lesson in there!

If I had to enter a trading contest but could only use one technique, I would use Ranges, absolutely no question about that. However, if I was allowed to use a second technique, it wouldn’t be squares, it wouldn’t be Time by Degrees, it wouldn’t be Squaring Time and Price and it wouldn’t be Gann’s Fourth Dimension, even though they are all powerful tools. It would be Road Maps.

Ranges and Road Maps are the two techniques that I use to get 90% of my results. They are the foundation of my analysis, and all of my other techniques fit in around them. Students of the Active Trader Program Online Training know the value of combining Ranges on multiple time frames. If you can add a working Road Map to your Ranges analysis to give you the shape or curve of the market, you can setup a high Reward to Risk Ratio campaign and trade it with a high level of confidence.

Chart 1 – Road Maps give you the Shape or Curve of a Market

Now, because Road Maps are a large part of the Master Forecasting Course, they are not usually discussed in webinars made available to students at the Number One Trading Plan or Ultimate Gann Course levels. However, that is about to change!

During a recent discussion with Di on what we can do to help our students, I managed to persuade Di to let me run a once off, special event called “History Repeats: An Introduction to Road Maps”. This means that for the first time EVER, I will be spending a full-day talking to any Safety in the Market student who is interested, about the power of Road Maps, not just Master Forecasting Course level students! I will show you several ways of finding Road Maps, and also show you how to combine them into your existing swing trading plan to help filter out the weaker trades. I’ll also show you how to build a position using a Road Map, giving you stronger, more reliable entries, as well as strategic places to add to your position and raise your stop loss level to lock in profits along the way.

There will be something for everyone in this event, whether you’re at the Active Trader Program level or the Master Forecasting Course level. However, the focus will be on trading the Road Maps, not forecasting. Also, please keep in mind that we spend five months on Road Maps in the Master Forecasting Course Coaching, so I can’t show you everything I know in a day, nor will I be revealing anything about (or even discussing) David Bowden’s Rating the Market lesson, although from time to time I will be referring owners of the Master Forecasting Course back to particular lessons, chapters and pages of their course.

The webinar is running on Saturday, 19 June from 9.00 am until 5:30 pm Sydney time. Due to the nature of the material being covered, we will be limiting the number of places available, and when places run out, that’s it, there won’t be any more, and we won’t be running this again in the next few years.

History Repeats – An Introduction to Road Maps

By the end of the seminar you will:

    • Be convinced that WD Gann was speaking the absolute truth when he said that history repeats
    • Know how to look for, find and set up a Road Map on most markets that you trade (a brand-new market has no history, so you will need to wait for patterns to emerge)
    • Have a new set of rules for:
      • Entering a “Ranges + Road Map” trade
      • Managing your stop loss
      • Adding to your position
      • Locking in profit based on the Road Map

The day will be broken down into six sessions of approximately an hour each, and will cover the following topics:

Session 1: History Repeats

Session 2: Finding Road Maps: Part A

Session 3: Finding Road Maps: Part B

Session 4: Rules for Swing Trading a Road Map

Session 5: Case Study: Swing Trading a Road Map

Session 6: Preparation for a Big Campaign

When you register for our History Repeats live event, you will receive:

    • A full day webinar on Saturday, 5 June 2021 (9.00 am to 5:30 pm Sydney time)
    • Unlimited access to a full recording of the webinar
    • Exercises to complete to help you cement the lessons from the webinar
    • Unlimited emails to Mat during the month of July 2021 with ANY Road Map questions (note: Mat will only discuss MFC content with MFC owners)
    • Bonus 1: Australian Dollar ‘Ranges and Road Map Outlook’ before the event
    • Bonus 2: Australian Dollar ‘Ranges and Road Map Outlook’ after the event

This is a one-off, special event that I have wanted to run for several years but the time hasn’t been right. And to be quite frank with you, had we run this event, with this content, in previous years, it would only have been made available to students at Master Forecasting Course level. However, given the ongoing challenges and disruptions caused by the pandemic, we want to do everything that we can to help our students take better trades, so for a limited time only, this event is open to ALL Safety in the Market students.

As I said, the numbers are limited because there are only so many that I can handle, both on the day and in the month of follow-up support. Once the event is full, that’s it, we won’t be running it again. Even if you can’t make it live on the day, if you wish to attend, I recommend that you lock in your place as soon as possible.

The Fine Print

Now, before you rush in and secure your place in this truly unique event, a few words of caution:

  1. I have not applied these techniques to all markets. I know that they work well on currencies and indices and this will be my focus for the event. I cannot promise that the market you wish to trade will work using these methods. I believe that they will, but not having tested every market, I cannot guarantee anything.
  2. Trading involves risk. Road Maps DO NOT eliminate that risk. They reduce the risk, while at the same time opening up much better Reward to Risk Ratios on trades, but they DO NOT eliminate the risk. I will not be held responsible for any losses made if you trade off a Road Map.
  3. Road Maps are wonderful, powerful techniques that will take your breath away at times. This makes them a wonderful addition to your trading, but it also makes them dangerous, so let me state a few things here that we will expand on during the event:
      1. WD Gann and David Bowden, despite their impressive records, used stop losses and recommended that students always use stop losses. I am no different – I ALWAYS use stop losses and recommend that you do too
      2. I’ve seen Road Maps work for only 6 weeks and for longer than 15 years, however, the majority of them tend to last from around 6 months to 2 years in length. Always remember that no matter how good a Road Map looks, it will not last forever
      3. You need to live through a few campaigns using Road Maps in order to get comfortable with them. I have studied them for over a decade. I will try to speed up your learning by going through case studies, but I encourage you to test and practice them before jumping into any live trade. 
  4. MFC Owners, although I believe you will find value in the day, I will not be discussing Rating the Market, either on the day or in follow-up emails. This is something I only discuss as part of MFC Coaching.
Please note:

You will be asked to sign a letter confirming that you have read the above fine print prior to attending the event.

Now, it’s over to you. If you’ve always wanted to see what all the fuss about Gann was and where your trading journey with Safety in the Market is leading, I can show you history repeating over and over again on markets, despite the fact that academic theory has ‘proven’ that markets are random. I can empower you to find and trade these Road Maps for yourself. And finally, I can show you how to set up trades with a Reward to Risk Ratio most people can only dream of. So, if that sounds good to you, click on the link below and secure your place in the program.

History Repeats – An Introduction to Road Maps

Click here to secure your place

Places are limited, so act now to secure your seat.

If you have any questions at all, please forward them to di@safetyinthemarket.com.au

I look forward to working with you on Saturday 19 June 2021 and taking both your trading and your analysis to exciting new places.

All the best

Mat