Hold Steady
The March Equinox came and went without providing any major kind of setup on the SPI200. However, it was trading short out of the 27 March weekly swing high that gave you the best opportunity to be trading with the major trend.
You should always be looking at the contract month as well as the continuous chart as we had recently seen contract roll over, so the data between these two contracts have some differences.
The June contract month showed three daily sections up with an exact 100% repeating daily swing range into 8070. See Chart 1 below.
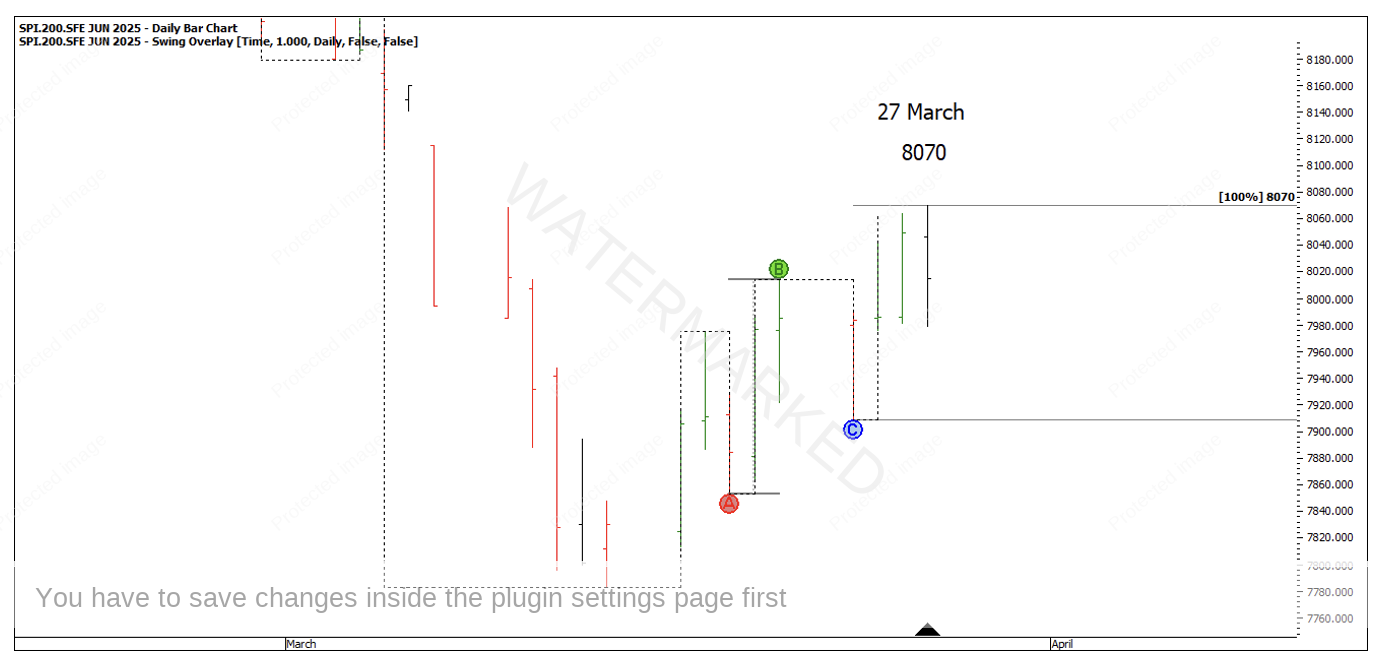
Chart 1
This is where cross referencing both contracts is essential as you don’t have much data on the contract month chart, and you need to tie it together with the bigger picture.
Looking at the continuous chart, we see a daily swing failure at 50% and a 100% repeat on the weekly swing chart well below the 50% retracement.
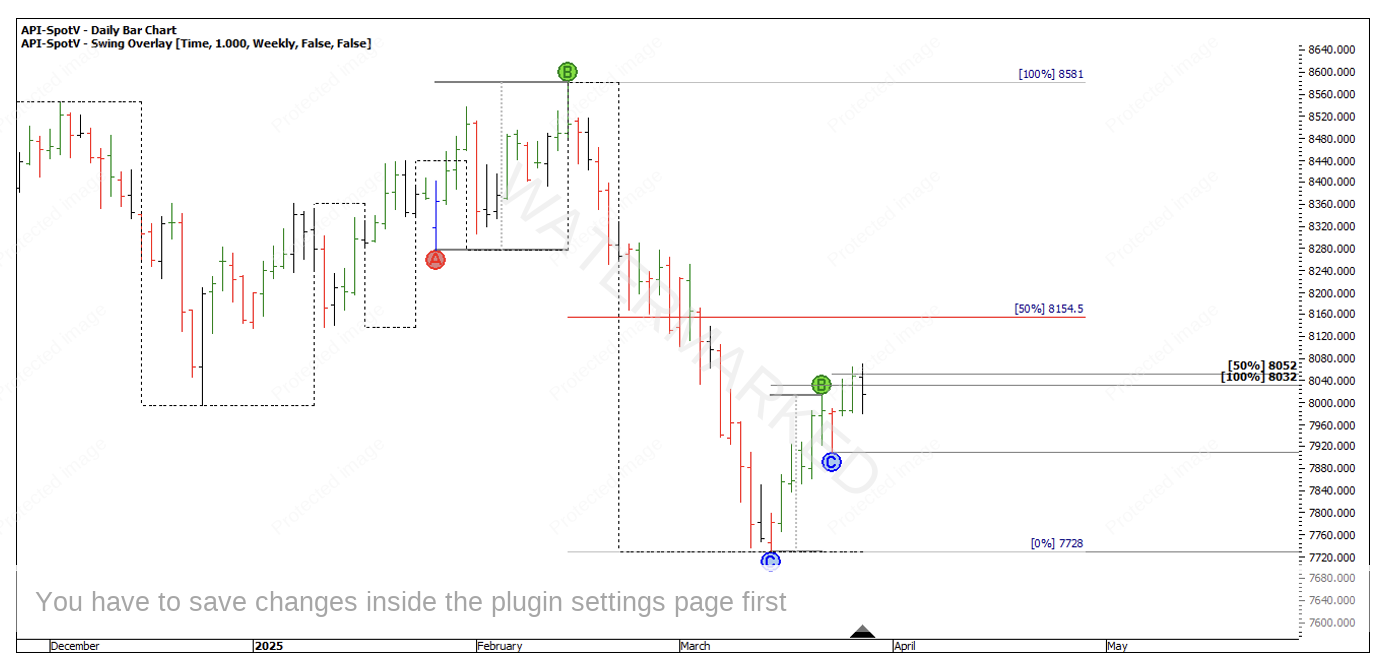
Chart 2
Under each of my price swing charts I have a time swing chart drawn up. Sometimes the time swing doesn’t offer any more clarity but at other times it does.
If a picture tells a thousand words, the classic Overbalance in Price swing with a 50% retracement is a picture that should be ingrained into everyone’s mind as a setup to watch. If you draw a weekly time swing, you will see what I mean. You will also notice just how long ago it was since the SPI200 put in a weekly swing down of 28 days!
What if you missed the 27 March high? Study the price swing chart below, as like the weekly time swing it’s one of the best representations of a great setup. Three sections up into a price cluster followed by a 200% Overbalance in Price, then a 100% repeat of the last swing up into a lower top. In this case price went 15 points through but this is one of the times where you might ‘wear the market like a loose garment’ as David Bowden would say.
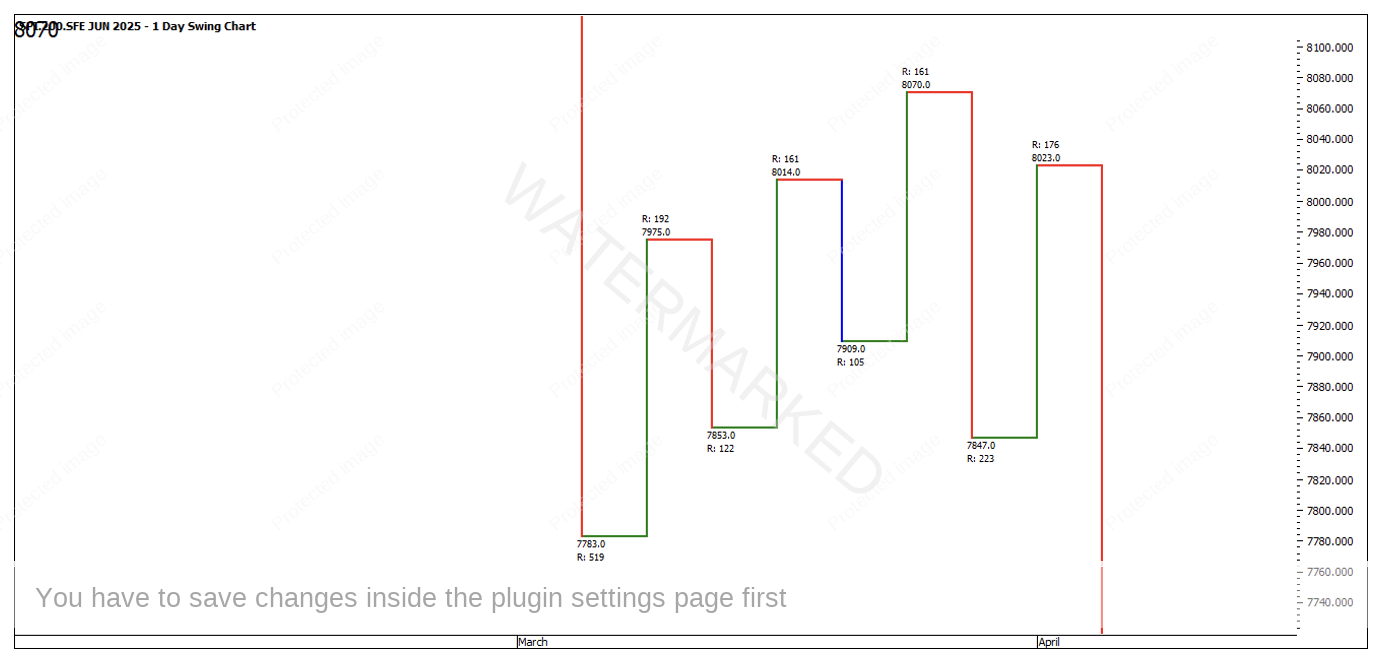
Chart 3
For Time harmony, 3 April has been one of the best Time by Degrees dates on the SPI200 in recent years. Also, the 3 April high of 8023 found itself under the 2×1 running up and 1×1 trading day angle running down.
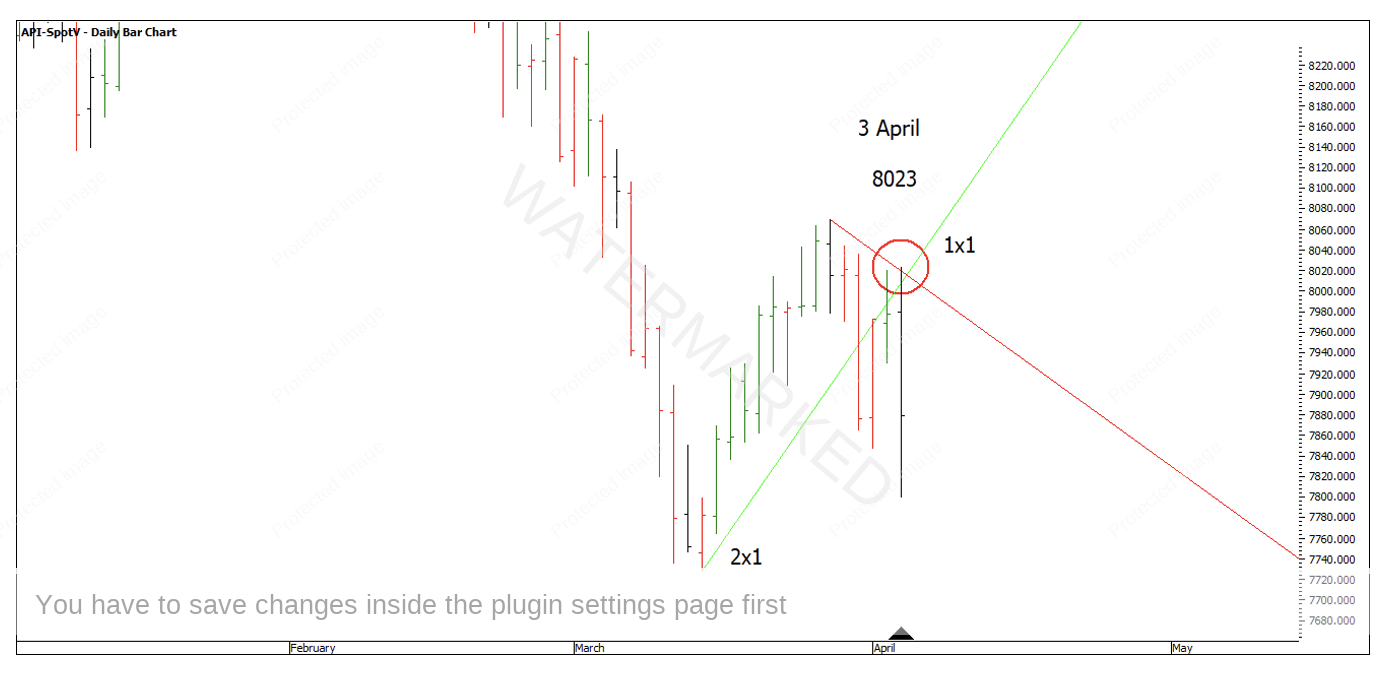
Chart 4
The setup was there, however was the entry signal as clear as the setup was?
At this point the daily swing chart has it’s sign of completion, and now looking at our Wheels within Wheels mythology, the 4-hour swing chart shows a failure at the 50% milestone.
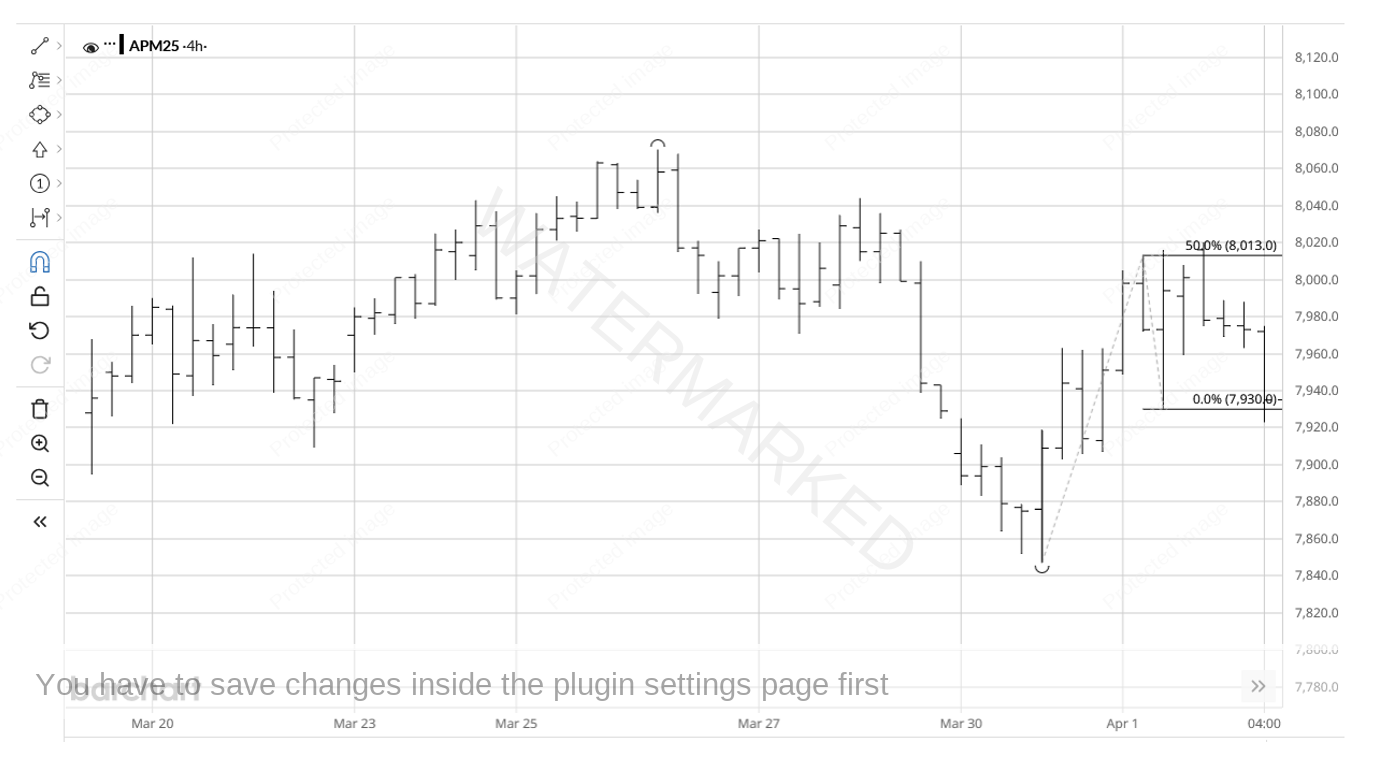
Chart 5
Now we can look at the 1-hour bar chart and see a final contracting swing up into 8020. This would be my preferred method of entry as so often the SPI200 puts in a final contracting swing into a turn.
However, as you can see the challenge was not being stopped out by the small double tops made during the wee hours of the morning!
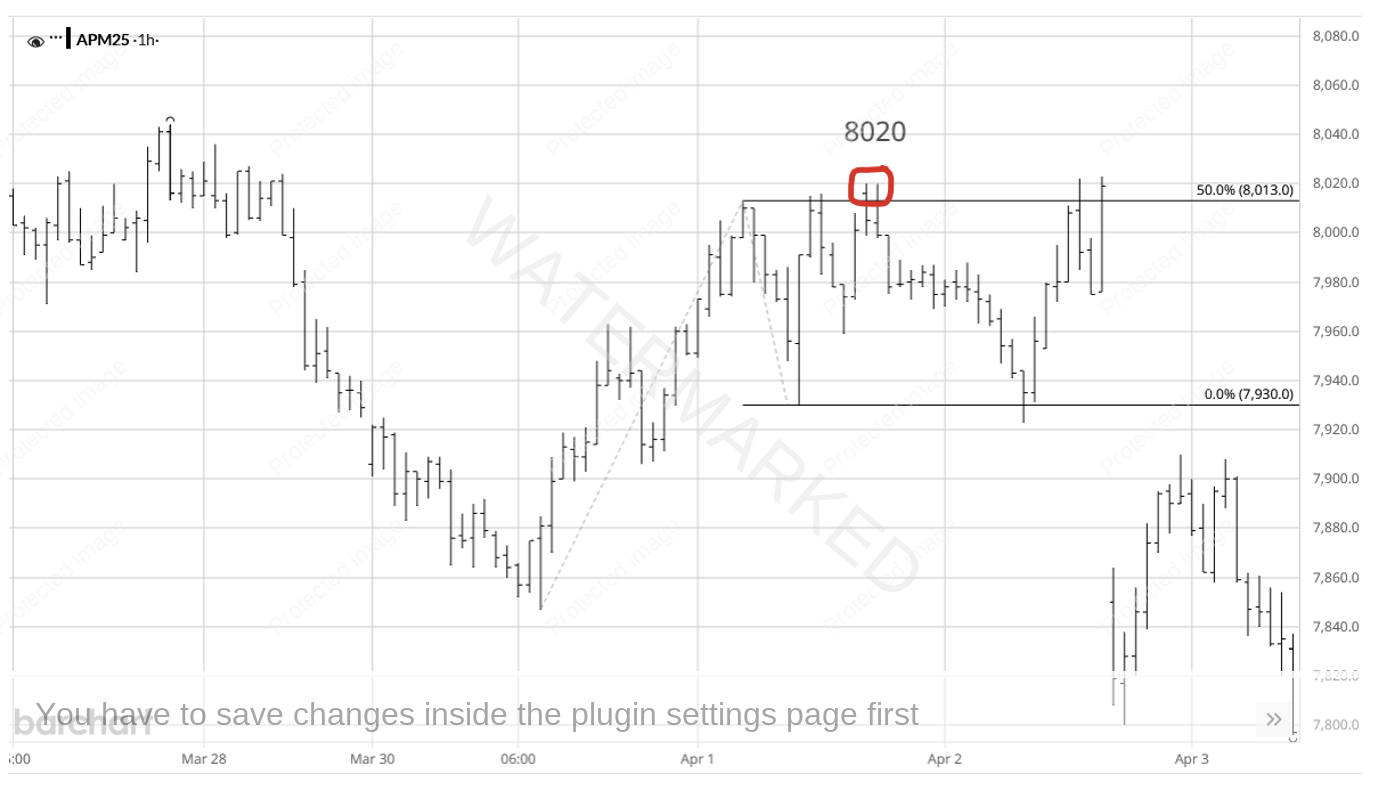
Chart 6
To wake up and find yourself stopped out only to see the market gap down on open can be a very frustrating experience! If this is a regular occurrence, look at having your stops a bit further away. If not, then just move onto the next trade.
So far, the SPI200 has found some support at 7172, a long way through my initial cluster of 7440! However, we can see some good milestones coming together here.
100% off the yearly swing chart at 7278 and well past a 200% Overbalance in Price on the quarterly swing chart.
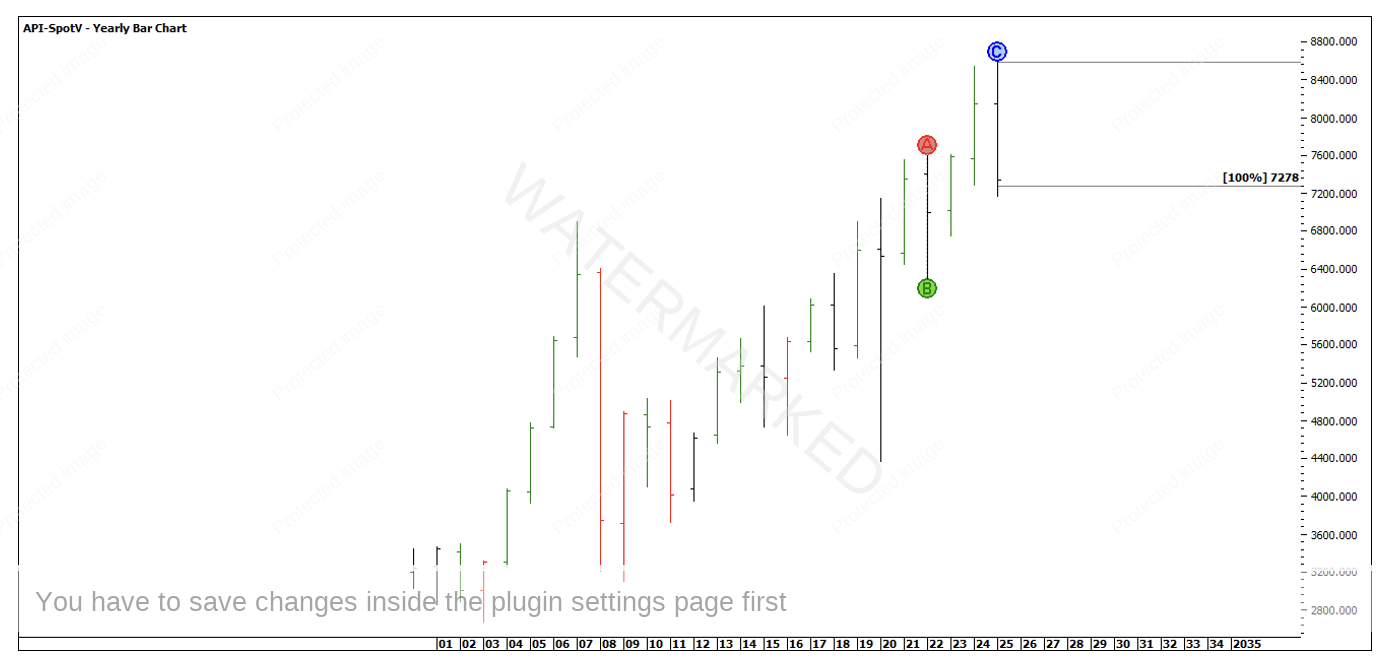
Chart 7
The monthly double tops have found support at the 250% milestones and a repeating weekly swing range at 7217.
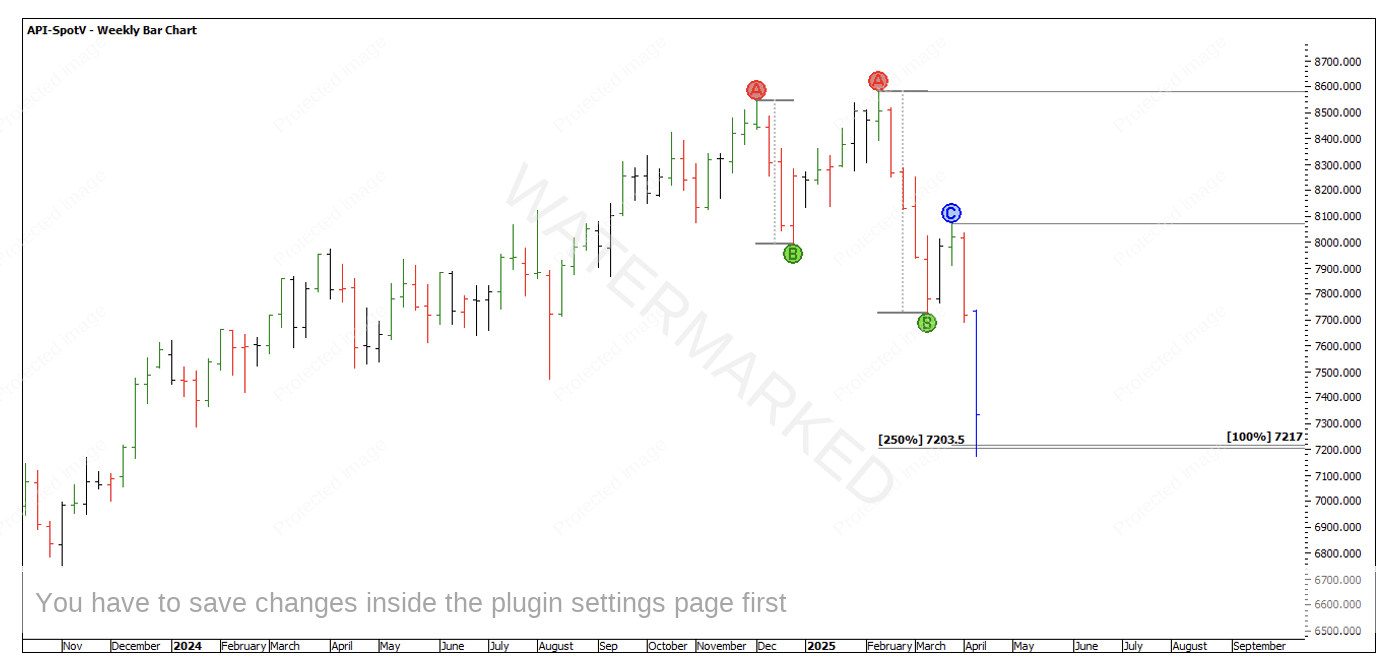
Chart 8
Interestingly enough, 50% of the COVID bear market is 7193.
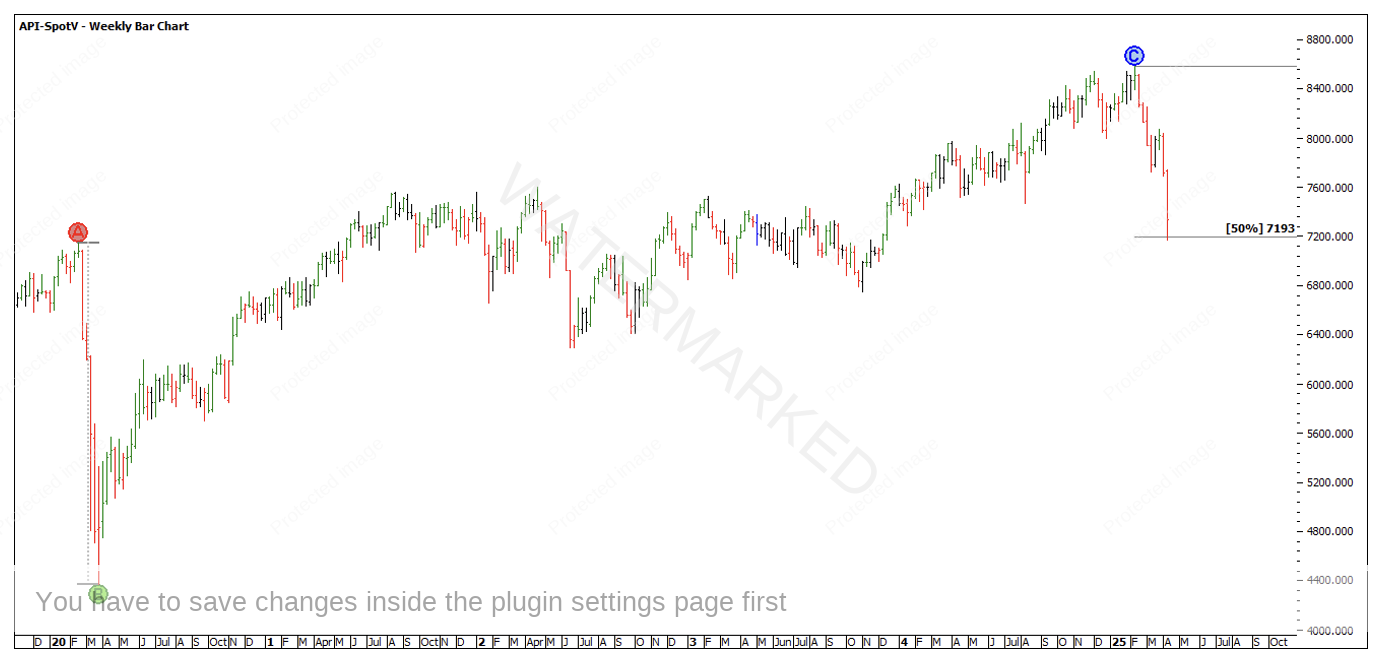
Chart 9
There have been some fantastic trading opportunities on the Indices lately, although sticking to your trading plan is essential!
Happy Trading,
Gus