How Low Can Gas Go?
Welcome to the March edition of the Platinum Newsletter. Stalking big picture setups is a great way to be able to capture many of the big moves across different markets over the year. Saved Chart Pages, Alerts and a good daily/weekly routine should keep you on top of the decent moves.
One setup I’ve been keeping an eye on this year is Natural Gas (NG-Spot V in ProfitSource). This setup caught my attention when I saw two, 200% milestones clustering together. In the last week, I can now add a third 200% milestone into the cluster. See Chart 1 below.
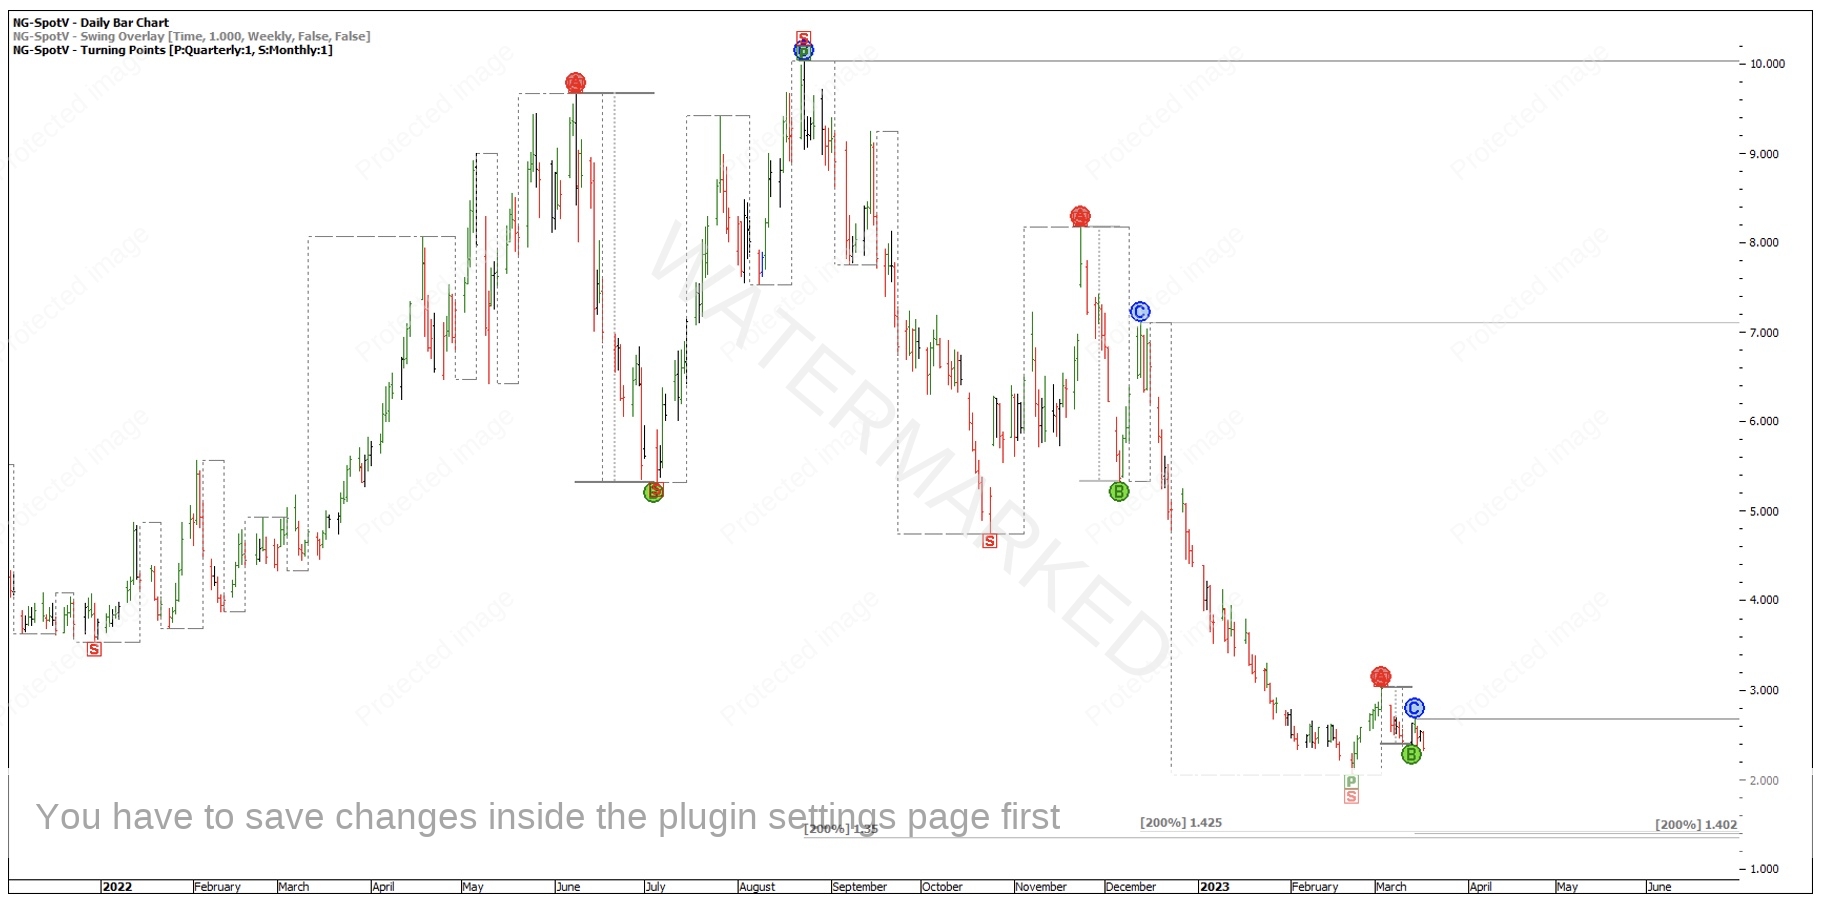
Chart 1 – Price Cluster
Historically, 1.30 – 1.40 is generally as low as Natural Gas seems to go, with the early to mid-1990’s being the last time Natural Gas was trading at that level. If this market gets down there, it will be breaking major bottoms formed back in 2016 and 2020. It will be interesting to see how the market reacts if that happens.

Chart 2 – Quarterly Bar Chart
The quarterly bar chart also gives me an interesting perspective of what could be in store for NG. I feel the current market looks very similar to that of 2001. It’s also quite close in Price and Time.
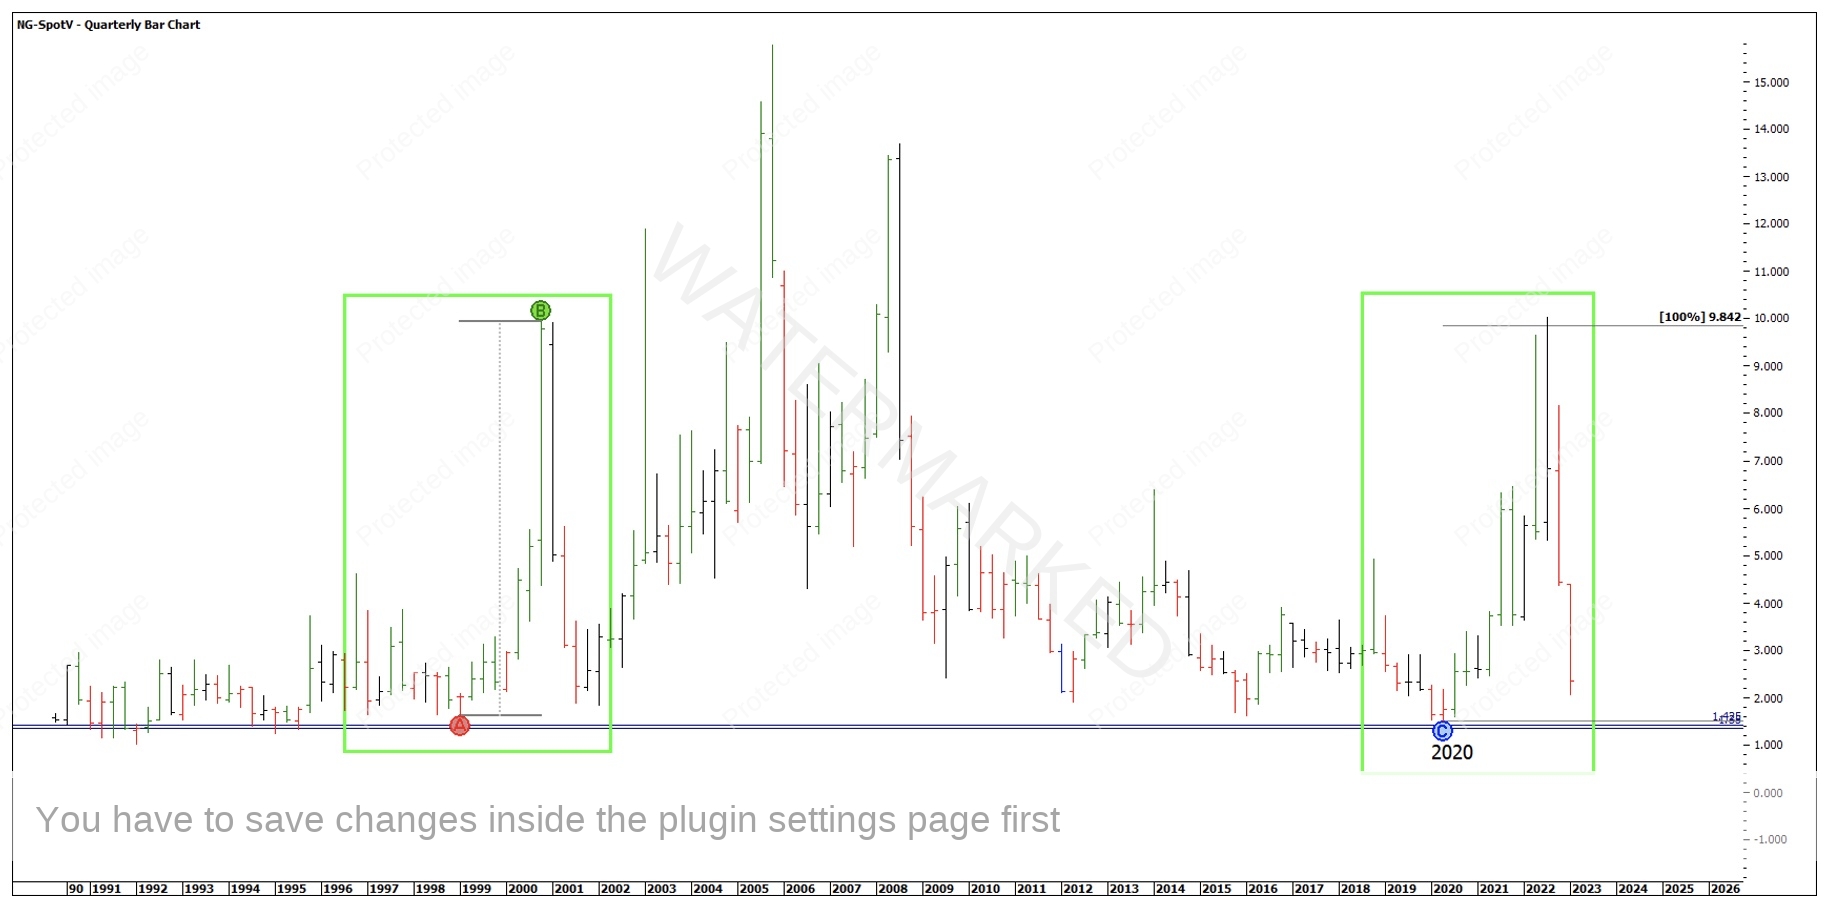
Chart 3 – A Previous Bull Market
Being able to identify when the market is turning can really help give confidence when a setup comes together at the right time. In the chart below, there is a lot of repetition of dates.
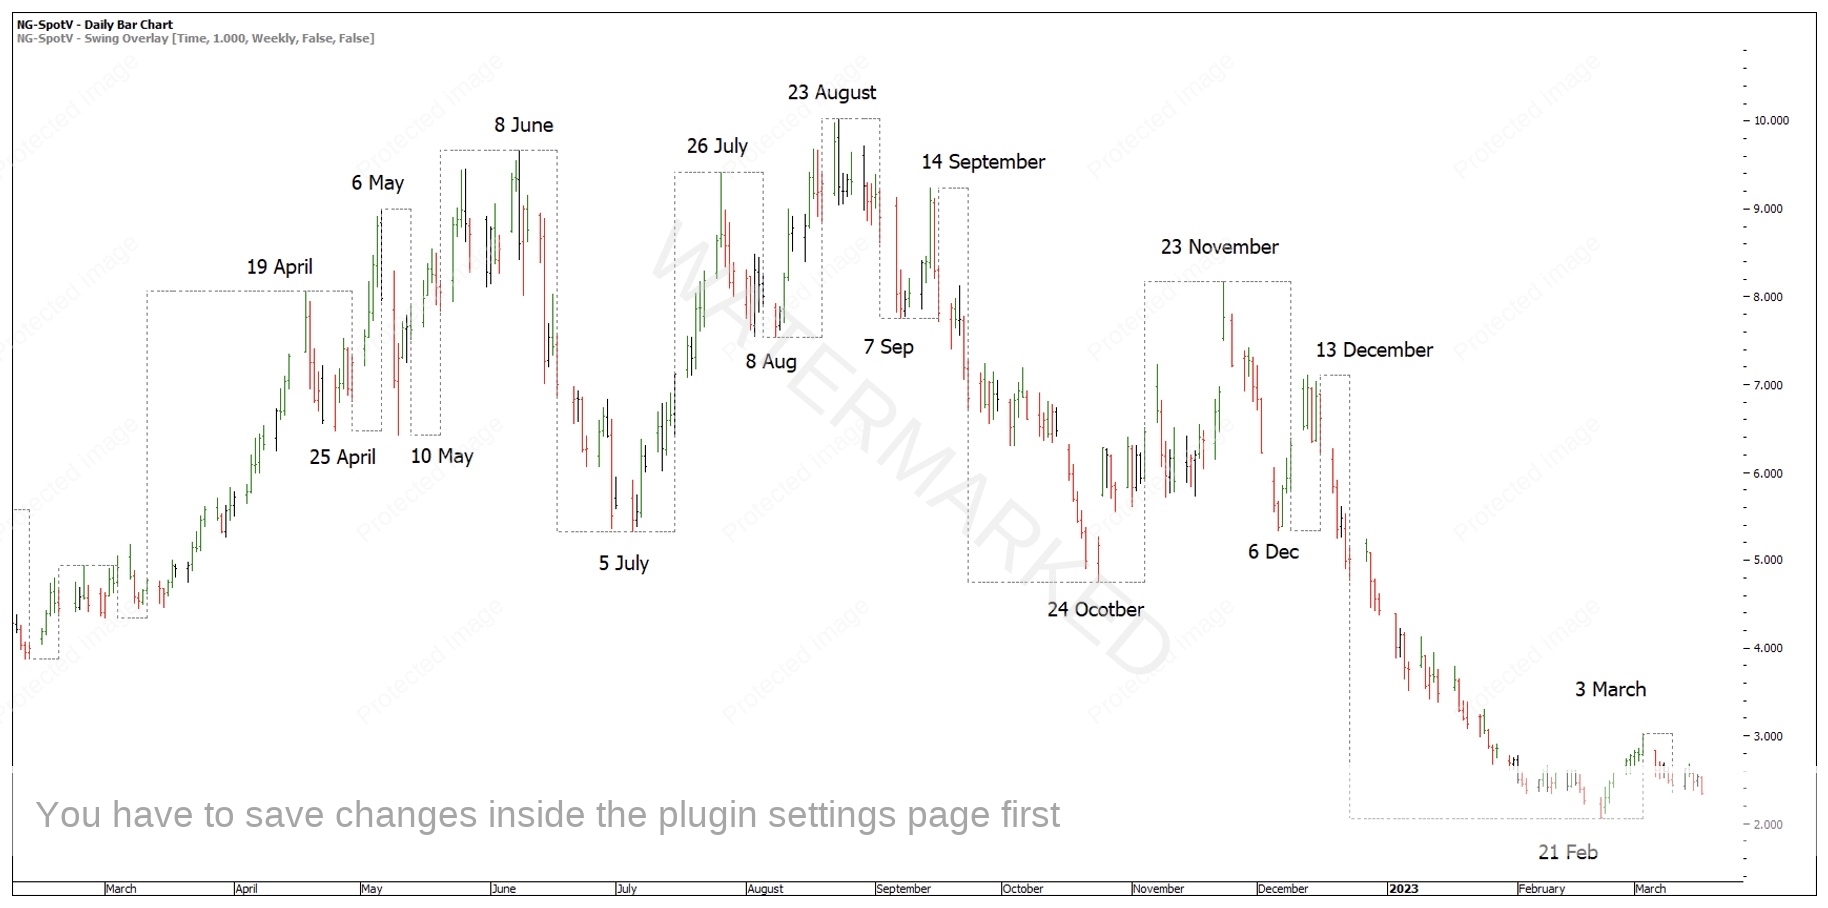
Chart 4 – About Time
We could also start watching our Time Trend Analysis and the length of each weekly run. The current weekly swing up of 10 days is a contracting swing in terms of Price, however it is an expanding swing in terms of Time compared with the last weekly swing up of 7 days. You can run Balancing of Time Counts from tops and bottoms to give key dates to watch going forward.

Chart 5 – Weekly Time Trend Analysis
Where to from here?
- We can set alerts either in our trading software or online trading platform to inform us when the market gets close to our target.
- We can also review Natural Gas daily or weekly to see how it’s unfolding or, don’t look at it until an alert is hit!
Another thing to consider is to visualise the outcome we would like. What would you like the swing charts to look like if the cluster is hit before you take a trade?
You never know if a market is going to get to a certain price level, that is out of our control. Sometimes markets don’t get to the price clusters, other times they go through the cluster. However, what is in our control is that we can be prepared!
Happy Trading,
Gus Hingeley