How to Find Trades with Large Reward to Risk Ratios
There is a difference between trading a large move in the market and achieving a large Reward to Risk Ratio. You can trade a huge move in the market and make money, but if you are risking a large amount as well, then your Reward to Risk Ratio is not going to be all that impressive. In fact, you’ll find that it can actually be more profitable for you to trade smaller moves IF you can get in early enough. In this article, I’ll explore the concept of a high Reward to Risk Ratio trade, and since I’m filling in for Rob this month, I’m sure he won’t mind me using the recent move up on Tesla (TSLA.NASD) as an example.
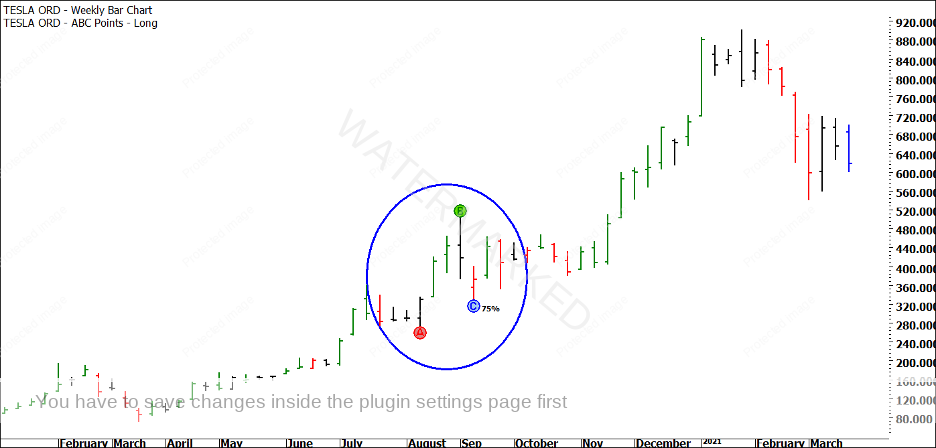
Let’s say you bought TSLA shares at $400 in September last year and sold them in January for $900. I think it’s fair to call that a pretty large move in the market! However, a large move is no guarantee of a large Reward to Risk Ratio. Let’s take a closer look. In Chart 1 below, you can see a weekly ABC Long setup on Tesla (TSLA.NASD).
Chart 1 – Tesla Weekly Bar Chart
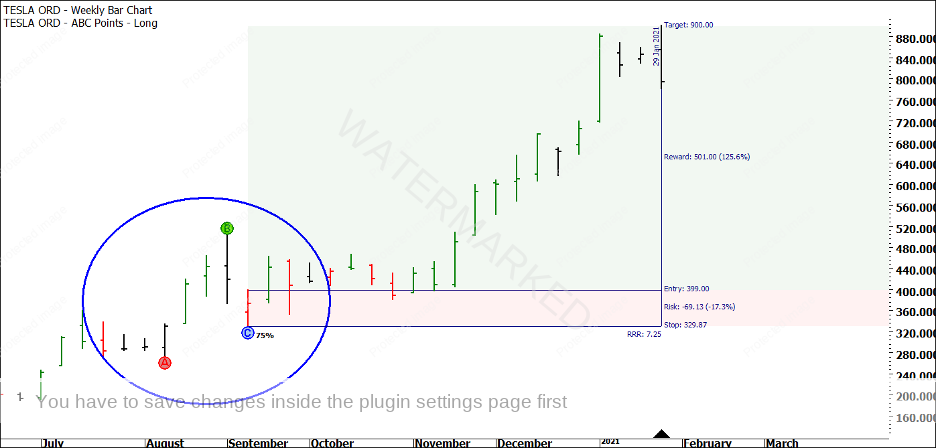
Now, I’m not saying that you would have taken this trade, which had an entry stop at $399. I’m also not saying that if you HAD taken it, that you would or could have held it until the $900 mark. I’m just demonstrating a point regarding the Reward to Risk Ratio, so please bear with me. In Chart 2 below, you can see that this trade, if executed to perfection and held for maximum profit, would have returned a Reward to Risk Ratio of just over 7 to 1. The tool I have used in ProfitSource software is the ‘Risk to Reward’ tool, located in your Drawing Tools.
Chart 2 – Tesla Reward to Risk Ratio
Now, a 7 to 1 Reward to Risk Ratio is certainly not a bad trade. But considering that you had to hold the position for four months and that the share price more than doubled during that time, I think a 7 to 1 return is an average result at best. So how could we increase that Reward to Risk Ratio? You can do it one of two ways.
The Reward to Risk Ratio involves two numbers: the amount per share or per contract that you will make if you are right, and the amount per share or contract that you will lose if you are wrong. In the case of this Tesla ABC setup, the 7.25 to 1 Reward to Risk Ratio comes from the profit potential of $501 per share (remember, that’s the MAXIMUM profit, it’s unlikely you would have held this trade for that long), divided by $69.13, which was the amount of risk per share. $501 / $69.13 = 7.25 to 1. This means that for every dollar risked on the trade, you could potentially make $7.25 in profit. If you risked $100, you could have made $725. If you risked $1,000,000, you could have made $7,250,000.
Now, as I said, there are two ways to increase that Reward to Risk Ratio. Firstly, you could increase the Reward on the trade by holding on longer. If you aimed to hold those TSLA shares until $1,000, your potential Reward would be $601 and your potential Reward to Risk Ratio would now be 8.69 to 1 ($601 / $ 69.13). While 8.69 is larger than 7.25, it’s not a LOT bigger. It also means that TSLA would have to go an extra $100 per share, just to increase your profits by a measly 1.44 to 1. At the time of writing this article, you would still be holding on as TSLA has come down from its January high.
The other way to increase your Reward to Risk Ratio is by reducing your risk per share on the trade. Now, you cannot do this on an ABC trade without breaking the rules. And this is why, no matter whether you trade a daily ABC, a weekly ABC, a monthly ABC, a quarterly ABC or a yearly ABC, your Reward to Risk Ratio is not going to change much and will always be stuck somewhere between 2 to 1 and maybe 10 to 1 at most. So how do you achieve a Reward to Risk Ratio that is larger than 10 to 1? I’ll spell it out for you in one sentence:
“Trade using a large swing chart for your reference range, and a smaller swing chart for your entry.”
That’s it! That’s the whole secret. Instead of using the weekly swing chart to enter the weekly ABC on TSLA, you could look to use a smaller swing chart to enter, such as the daily chart or even the hourly chart. By using a smaller swing chart (such as daily or hourly) to enter a larger swing chart reference range (such as weekly or monthly), you are both INCREASING the Reward on the trade, and DECREASING the Risk on the trade. And that is how you achieve a larger Reward to Risk Ratio. It is as simple as that. The larger the gap in time frame between the swing chart you are entering on and the swing chart you are using as a reference range, the larger your Reward to Risk Ratio will generally be. For example, an hourly swing chart entry on a monthly swing turn is going to have a larger Reward to Risk Ratio than a daily swing chart entry on the weekly swing chart reference range.
The key to being able to use this ‘multi-swing chart time frame’ approach is mastering Price Forecasting. Every Price Cluster is a potential turning point on a swing chart. You need to be able to identify the possible Point A or Point C in the market in advance, and the only way to do this is by mastering Price Forecasting. I have three recommendations for mastering this technique:
- Study the Price Forecasting chapter in your Number One Trading Plan manual
- Watch the One Day Price Forecasting Webinar we recorded back in 2017 (and complete the Case Study examples)
- Complete the Active Trader Program Online Training lessons on Price Forecasting
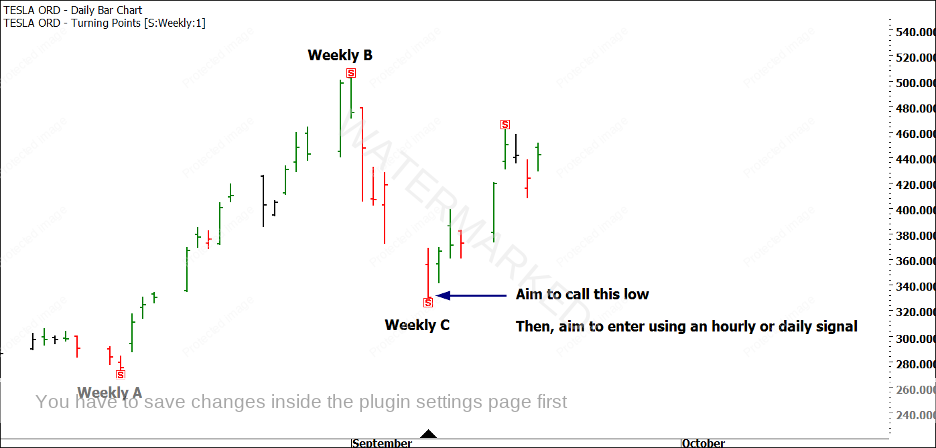
Let’s go back to TSLA. In Chart 3 below, I have marked the weekly A, B and C points, along with the weekly Entry Stop.
Chart 3 – TSLA Daily Bar Chart with Weekly Turning Points
Notice that in Chart 3, I am using a daily bar chart with the weekly turning points marked. You can use the ‘Turning Points Tool’ in your HiLites within ProfitSource and then set it to display ‘weekly turning points. In Chart 4 below, I will show you the key areas to target if you want to increase your Reward to Risk Ratio on the weekly trade.
Chart 4 – TSLA Advanced Entry
Please take the time to study the chart above. My preferred way to enter a trade, and the one that guarantees the highest Reward to Risk Ratio on the trade is as follows:
- Identify a tight Price Cluster to call the potential weekly (or higher) low
- Look for an opportunity to enter as the swing chart turns up on one of the following:
- Daily bar chart
- The 4-hour bar chart
- The 1-hour bar chart
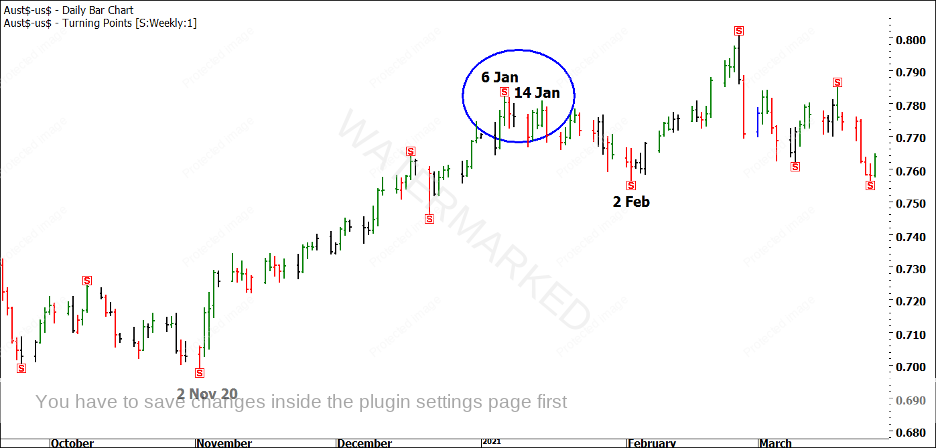
And that, in a nutshell, is how to take trades with a large Reward to Risk Ratio. If you focus your attention away from ABC trading and onto Price Forecasting, you’ll find that just about all of your trades have a Reward to Risk Ratio of 10 to 1 or more. And you won’t have to wait four months for your profit, either. For example, in Chart 5 below, I took a trade on the Australian Dollar out of a Price Cluster on the weekly swing chart on 6 January 2021. Now, the trade wasn’t a major top, it was just a weekly swing top. I also didn’t trade it for very long, but when I closed it less than two weeks later, I had a Reward to Risk Ratio in excess of 10 to 1.
Chart 5 – Australian Dollar Weekly Swing Chart Trade
The reason for the high Reward to Risk Ratio is that I had a very low risk, which meant that the market didn’t have to travel very far for me to bank a nice profit. I call this the Wheels Within Wheels approach, and I use it to trade larger reference ranges by entering on smaller swing chart time frames. It is detailed in the Active Trader Program Online Training, step by step.
Using the same approach, I was also able to enter long trades out of the 2 November 2020 low and the 2 February 2021 low, also shown on Chart 5. This is why I don’t focus on standard ABC trades. I don’t scan for them, I don’t look for them, and I am quite frankly not interested in them. Instead, I simply look for strong Price Clusters on the weekly swing chart or higher, and then I aim to trade out of them using the daily swing chart or a smaller swing chart to enter. ABC Trades are the best way to learn to trade and to learn about swing charts, but they are merely a stepping-stone on the way to more advanced swing trading.
If you’d like to learn more about this approach, you can check out the Active Trader Program Online Training by clicking on this link. Active Trader Program Online Training Demo.
Remember, your goal as a trader is NOT to capture big moves (although you will capture many), and it is not to be right all of the time or to be in the market all of the time. Your goal is to be profitable over time, and the best way to do this is to focus on trades with high Reward to Risk Ratios. When you are wrong, you lose ‘one unit of risk’, however much that represents for you at present, whether it is $100 or $100,000. When you are right, you make many, many multiples of that ‘one unit of risk’, whether that is many multiples of $100 or many multiples of $100,000.
We have students in our coaching programs who shorted the Australian Dollar out of the 25 February high with only ten ticks (0.0010) of risk and are currently sitting in profitable trades with a Reward to Risk Ratio in excess of 30 to 1, with 15 to 1 locked in already (through the movement of a stop loss) and more profit potentially on the table. That’s a little bit better than the average ABC trade!
Be Prepared!
Mathew Barnes


