How to Take Better Swing Trades in 2023
I’ve always been amazed that swing charts are not as widely studied as they should be. People love to talk about candlestick charts or about the latest charting fad, but mention the word ‘swing chart’ and you’ll get blank stares in most cases. But after almost 20 years in this field, I am yet to see any other kind of chart that gives us the information that swing charts do when it comes to both identifying the trend (or trends!) and calling turning points. This is why I still recommend the Active Trader Program Online Training (ATPOT) as the first place for any new trader to start.
I would love for 2023 to be the best trading year yet for all of you, particularly with the big moves coming on the Australian Dollar and other markets, so I thought I’d start with three key principles for taking better swing trades in 2023:
1. Always Look at Two or More Swing Charts Side by Side
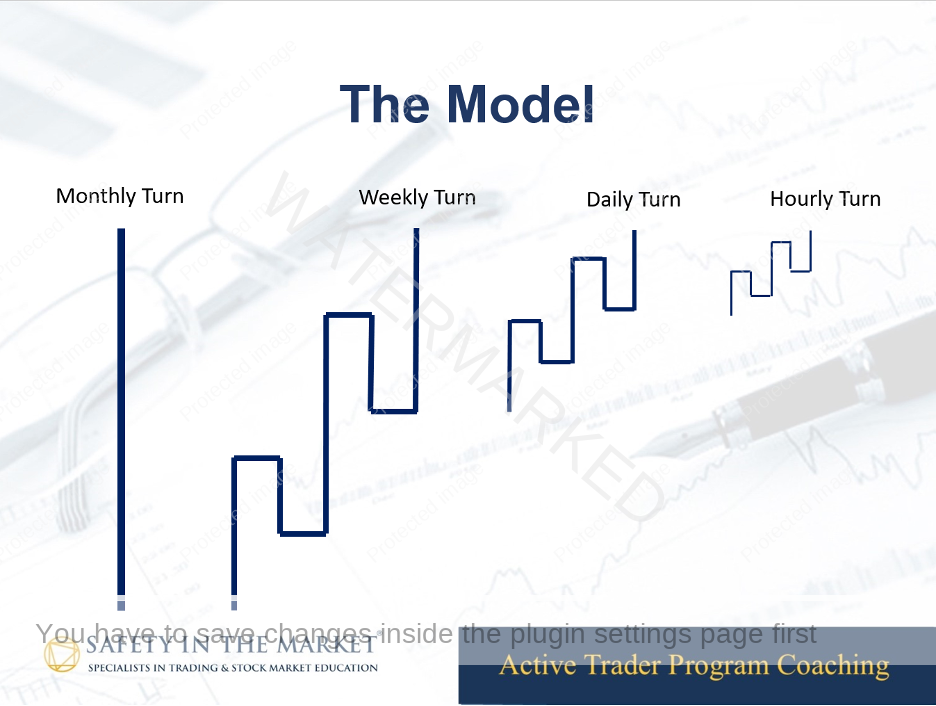
No swing in the market exists in isolation. As you can see on the Trading Model above (which is taught in the Active Trader Program Coaching), every swing is made up of smaller swings, while also being part of a larger swing as well. For example, take a weekly swing. You could break that weekly swing down into smaller daily swings. In addition, that same weekly swing is a smaller wheel in a larger monthly swing. If you want to take some great swing trades this year, it is vital that you look at a minimum of two swing chart time frames side by side.
I usually focus on the monthly, weekly, daily and 4-hour charts on the Australian Dollar, and look to take trades using the larger ranges (monthly and weekly) as my reference range, and using the smaller ranges (daily, 4 hour or smaller) for my entries. To help find these trades, you will need to master Price Forecasting, as discussed in Step 2.
2. Apply All Price Forecasting Techniques to All Swing Chart Time Frames
There are only three main tools that we use for Price Forecasting:
- Swing chart milestones
- Resistance Cards
- First Range Out
These tools can and should be applied to all of the swing chart time frames that you wish to trade, to give you an idea of when and where those swings are likely to end (ie a turning point). Sometimes, a daily or a weekly turn will be hard to spot, however a study of the 4-hour chart will give you the precise turn. You don’t always know which time frame is going to be the clearest, so you need to study all of your time frames in isolation, looking at techniques like price clusters or the First Range Out to tell you that the swing is about to end.
Each swing of the Trading Model (whether it is a daily or a monthly or even a 5-minute swing) will have its own First Range Out (FRO). You can find this FRO by looking at the smaller time frames. It takes a bit of practice, and not every FRO is easy to see, but with a bit of practice you can spot most of them. So often, the end of a swing will come in on 200% of the First Range Out as an ABC, or at 400% of the First Range Out applied as a Square (see David’s 256-point range example in the Number One Trading Plan).
If you focus on the Trading Model (Step 1), and apply your Price Forecasting to each swing (use the Wheels Within Wheels spreadsheet from the Active Trader Program Online Training), you WILL find great trades, on every market, in every year. It’s just up to you to stay on top of your analysis and on the ball so that you’re ready to trade them when they arrive.
So far, we have looked at the Trading Model, and you have hopefully chosen some time frames and found some turning points on those time frames. This analysis is both fun and fascinating, but it won’t pay the bills – only trading will do that!
3. Trade Large Reference Ranges Using Small Swing Chart Time Frames For Entry
In the Smarter Starter Pack, David teaches us to look for daily swing trades in sympathy with the weekly swing trend. For example, if the weekly swing trend is up, we look for daily long trades. A great example is a first higher swing chart trade on the daily swing chart out of a weekly (or even a monthly) turning point.
However, we can expand this thinking and take it to the next level. Imagine you are looking at a potential daily first higher swing bottom trade, out of a weekly turning point. That daily swing is going to be made up of smaller ranges on the 4 hour or 1 hour swing chart, which means there will be an additional possible first higher swing bottom entry on the 4 hour or 1 hour chart.
The point of all of this is to find trades with a higher Reward to Risk Ratio (RRR). If you trade a daily swing trade in isolation and exit at 100% of the previous range, you will likely have a RRR of around 2 to 1 or 3 to 1. If you trade a weekly swing using a daily entry, that RRR might increase to around 5 to 1 or 8 to 1. If you trade a monthly swing using a daily entry, the RRR goes higher again, and if you trade that same monthly swing using a 4 hour or even a 1-hour entry, your RRR goes even higher.
Let’s recap these three points before I give you an example. First, remember that no swing exists in isolation, so make sure you are watching a series of swings together on the same market, never just one. For each of those swings, pay attention to the Price Forecasting analysis because it will often get you very close to the end of that swing! You can use the Wheels Within Wheels spreadsheet from the Active Trader Program Online Training to keep track of these. Finally, once you’ve got your market up and running, simply be on the lookout for bigger picture turning points, then trade them using smaller swing charts for the maximum Reward to Risk Ratio.
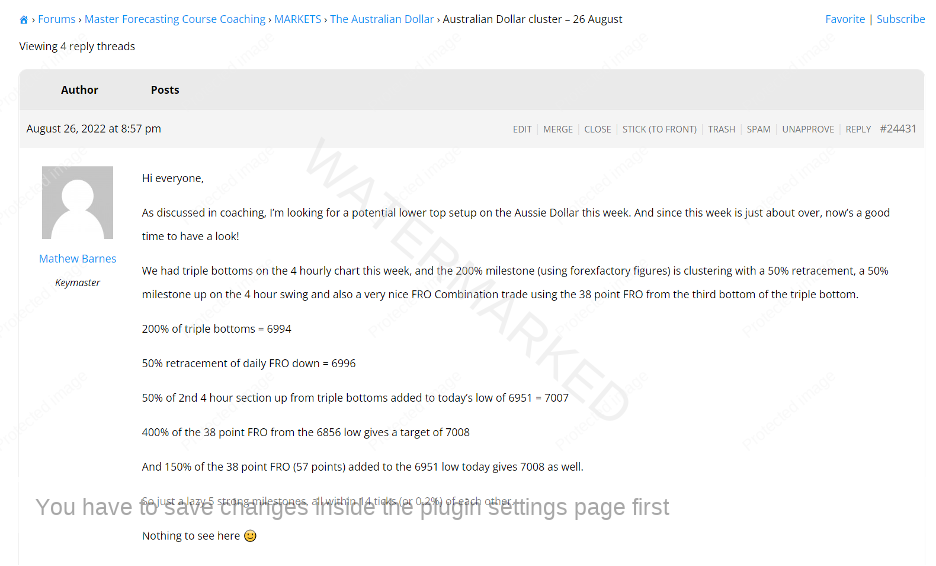
How large can your Reward to Risk Ratio get? In August of 2022, I took a trade that returned a 57 to 1 RRR on the Australian Dollar. I posted details of a very strong cluster on the MFC Coaching forums before the top came in. For those who haven’t seen it, I have included a screenshot of that post below – I would strongly encourage you to work through this post, try to understand it for yourself and try to replicate it. You can use TradingView to access the intra-day data.
My goal in 2023 is to take some trading campaigns with a Reward to Risk Ratio exceeding 100 to 1. This means I will need very strong turns, and I will need to be on top of all of my swing charts so that when the turns occur, I can enter close to the extremes. This style of trading is more aggressive and will at times see you stopped out of the market a couple of times at a big turn. But it’s the way to higher RRR trades.
This article has been a little bit longer than I had intended, but I wanted to give you the best I had when it comes to swing trading, to help you get off on the right foot for 2023. As I mentioned in my introduction, we will be closely following the Australian Dollar this year with an eye on several key dates that I will be sharing in our coaching classes. In addition to this, I will be aiming to look at over 100 markets throughout the next 12 months in our Active Trader Program Coaching. I won’t be keeping track, but each month we will regularly open new markets and look at the swing charts side by side to seek out these high probability, high Reward to Risk Ratio entries.
I am sure that there will be numerous terrific trades out there in 2023 across all kinds of market – stocks, currencies, indices and commodities. But they are not going to find themselves! It is up to us as traders to do the work to find them. If you would like to join us for coaching, download your registration form and send it back ASAP. Our first live session is on Tuesday night, 31 January at 7pm Sydney time. Don’t worry if you can’t make the live session, EVERYTHING is recorded, and you have unlimited access to that recording. See you in coaching!
Be Prepared!
Mathew Barnes

