How you can be profitable and wrong?
Global tension and uncertainty are again drivers for markets. The longer I spend in the game, the more I come to realise that we are always moving closer to the next headline and always creating historical reference points to anchor from into the future.
This month’s article is a follow up on Crude Oil from last month with a twist from a student’s email that I received via the team. I am always glad when people digest the articles, do the work, and then seek further understanding especially when faced with a new scenario. Your journey to arrive at your definition of success is very much guided by surviving long enough to see numerous examples and events and learn from them to apply next time around.
This is never more important than when we make Time and Price projections that then deviate from our analysis. We must ensure that we don’t fall in love with our opinions of market movement as ultimately the market is always correct. If we quickly review the position of Crude Oil last month, we would have been forgiven for thinking that Middle East tension and geopolitical risks would be a bullish factor for price. This is even before we open a chart and look for pressure points.
The important lesson is how can we be wrong and profitable? For me it’s a case of building a hypothesis and adjusting when the market tells you that you are wrong. To be clear and open with my realities of trading, being wrong is a normal and expected part of trading. Real world losses have taught me the value of accepting that its not a game of ego, but profitability in your account.
Chart 1 is lifted from last month’s article and was current when I committed it to paper. The market had confirmed a higher swing bottom and what I had prepared for as a 3rd leg (small section) of the move out from the June 2023 low.
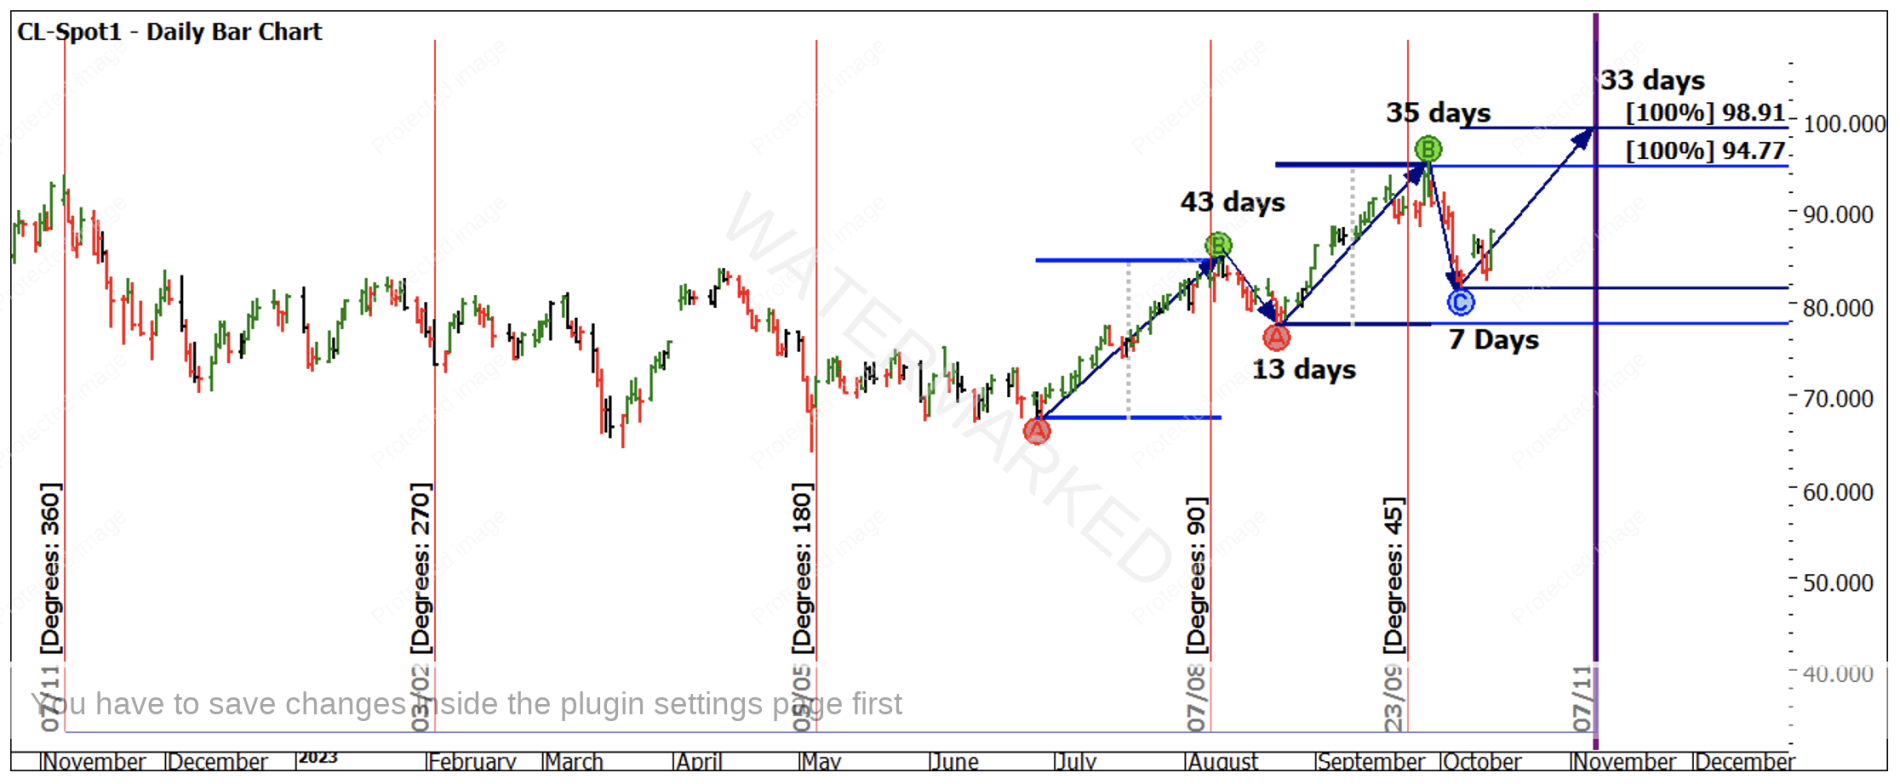
Chart 1 – Daily Bar Chart CL-Spot1
Keep in mind that this area would be considered an intermediate section of a market, certainly not a primary market cycle. As David said, if you want big results then focus on big things. Whilst I did not articulate this in the article, I was not expecting the November date to be a yearly top even if the price had pushed to that level.
A side note to this equation too is that it’s much easier to trade this 3rd section long if you had banked profit from the first two moves up. It’s often a conundrum that towards the end of any move if we are trading, the last 25% its easier to make loses. I have always found that the most profitable runs are out of an expected turn not into them. David often referred to the latter as “cheeky money”.
Back to the picture at hand, the first higher swing bottom had triggered in early October. Chart 2 is the December contract for Crude, and you can see it moved from approximately USD$80 to $89.85 on the 20th October.
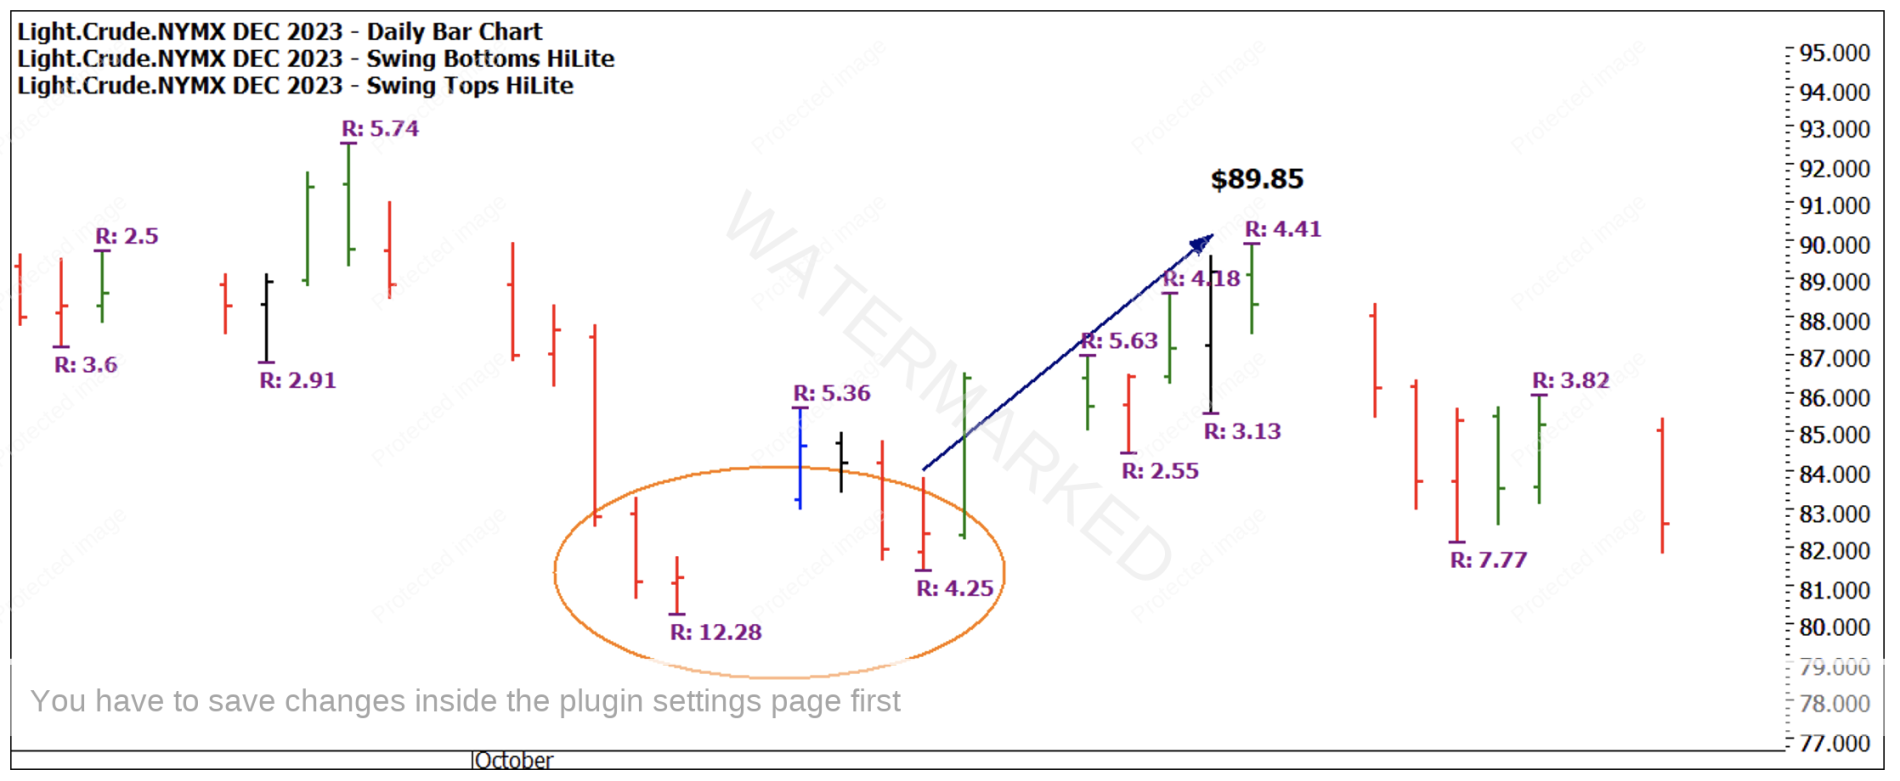
Chart 2 – Daily Bar Chart CL-2023.M
If we go back to last month’s article, the move from $80 to a potential move of $99 is approximately $19. If we see it move 50% of that move, we should be locking in at least a break even or small profit. One of the questions I received was, would I still be long into that price? Absolutely not is my answer, once the market moves against me, I have stops to safeguard to my emotion (or better described as ego).
Chart 3 shows how the price action was able to reach 75% of the range and approximately $90 before it reversed. As a side note, we know how important 90 is as a number for Time, but I also watch it in Price.
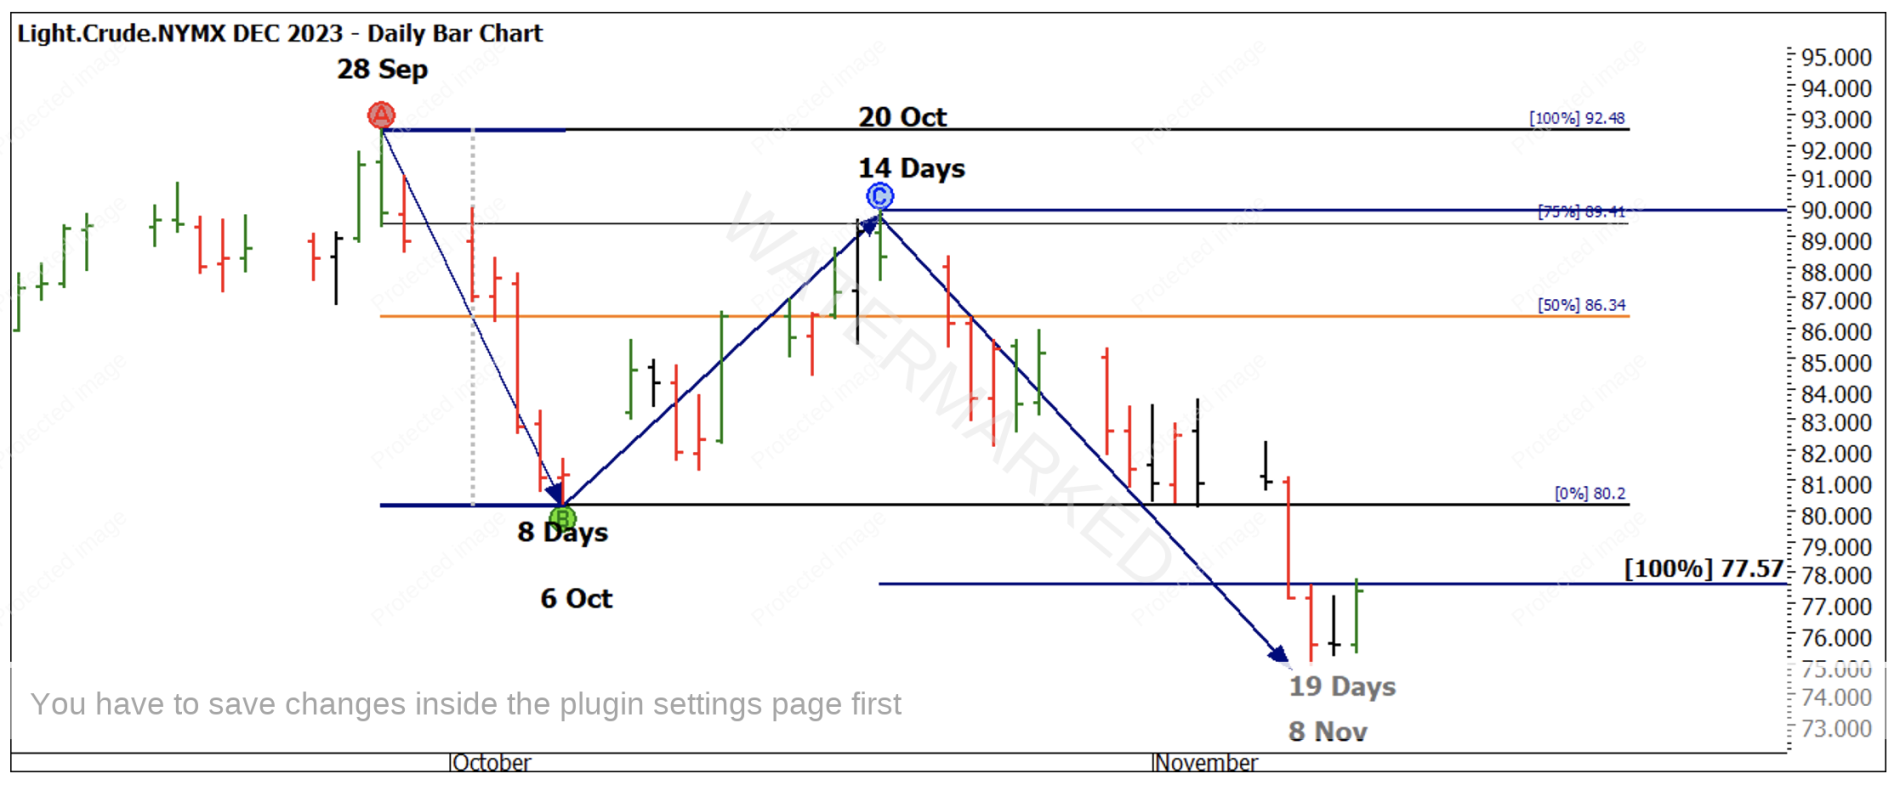
Chart 3 – Daily Bar Chart CL-2023.M
The run down may have provided an opportunity to stop and reverse, exit the long position, or open a new short position. For me based on a variety of factors I left this move alone but remained focused on what would happen around the November seasonal date. As it stands, currently it is a low on our 1-day swing chart, so we could see what we expected as a top being confirmed as a low. That again reminds us of the loose garment theory, that we can’t always expect the market to do what we want.
Chart 4 delves into the relationship between 180 degrees and the previous patterns we saw earlier this year. Crude delivered a low, high then low in March, April, May.
This has been replicated (similar day counts) in the current pattern but as a high, high then low (potentially).
It’s not a surprise that mid-October reacted strongly as its 180 Degrees from 12 April. The test will be to see a strong reaction in November to see if that 180 link is calling the market.
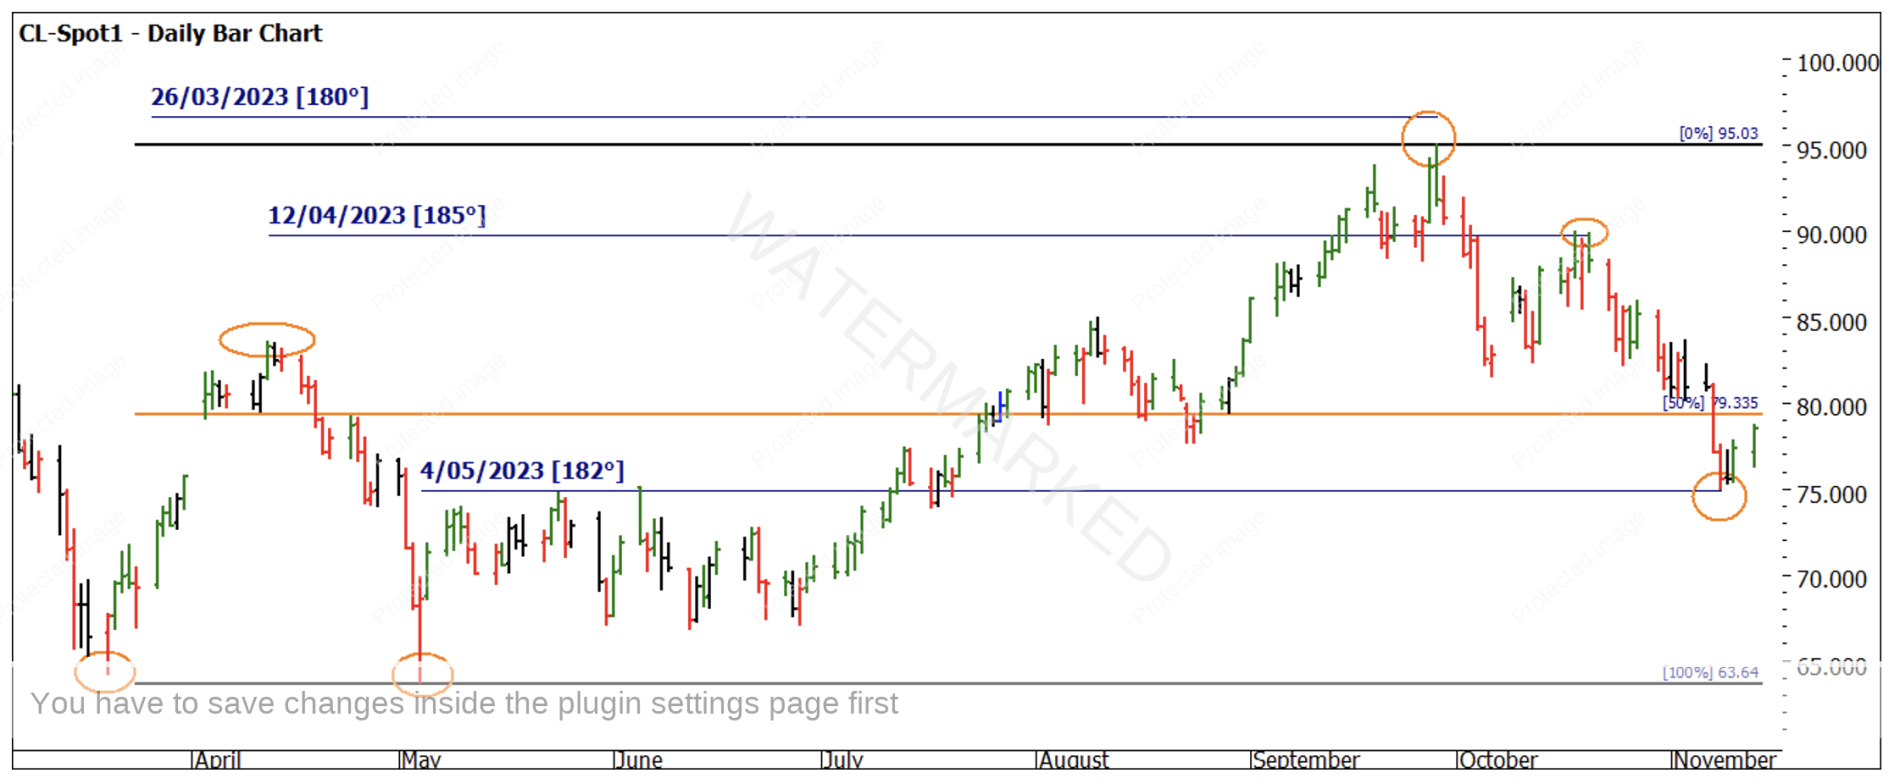
Chart 4 – Daily Bar Chart CL-Spot1
Chart 5 is some analysis I am stalking, if this mini pattern from earlier this year is repeating in time but not aligning with tops or bottoms, could we be seeing Price repeat using the April / May range as a guide from the October high? Time will tell.
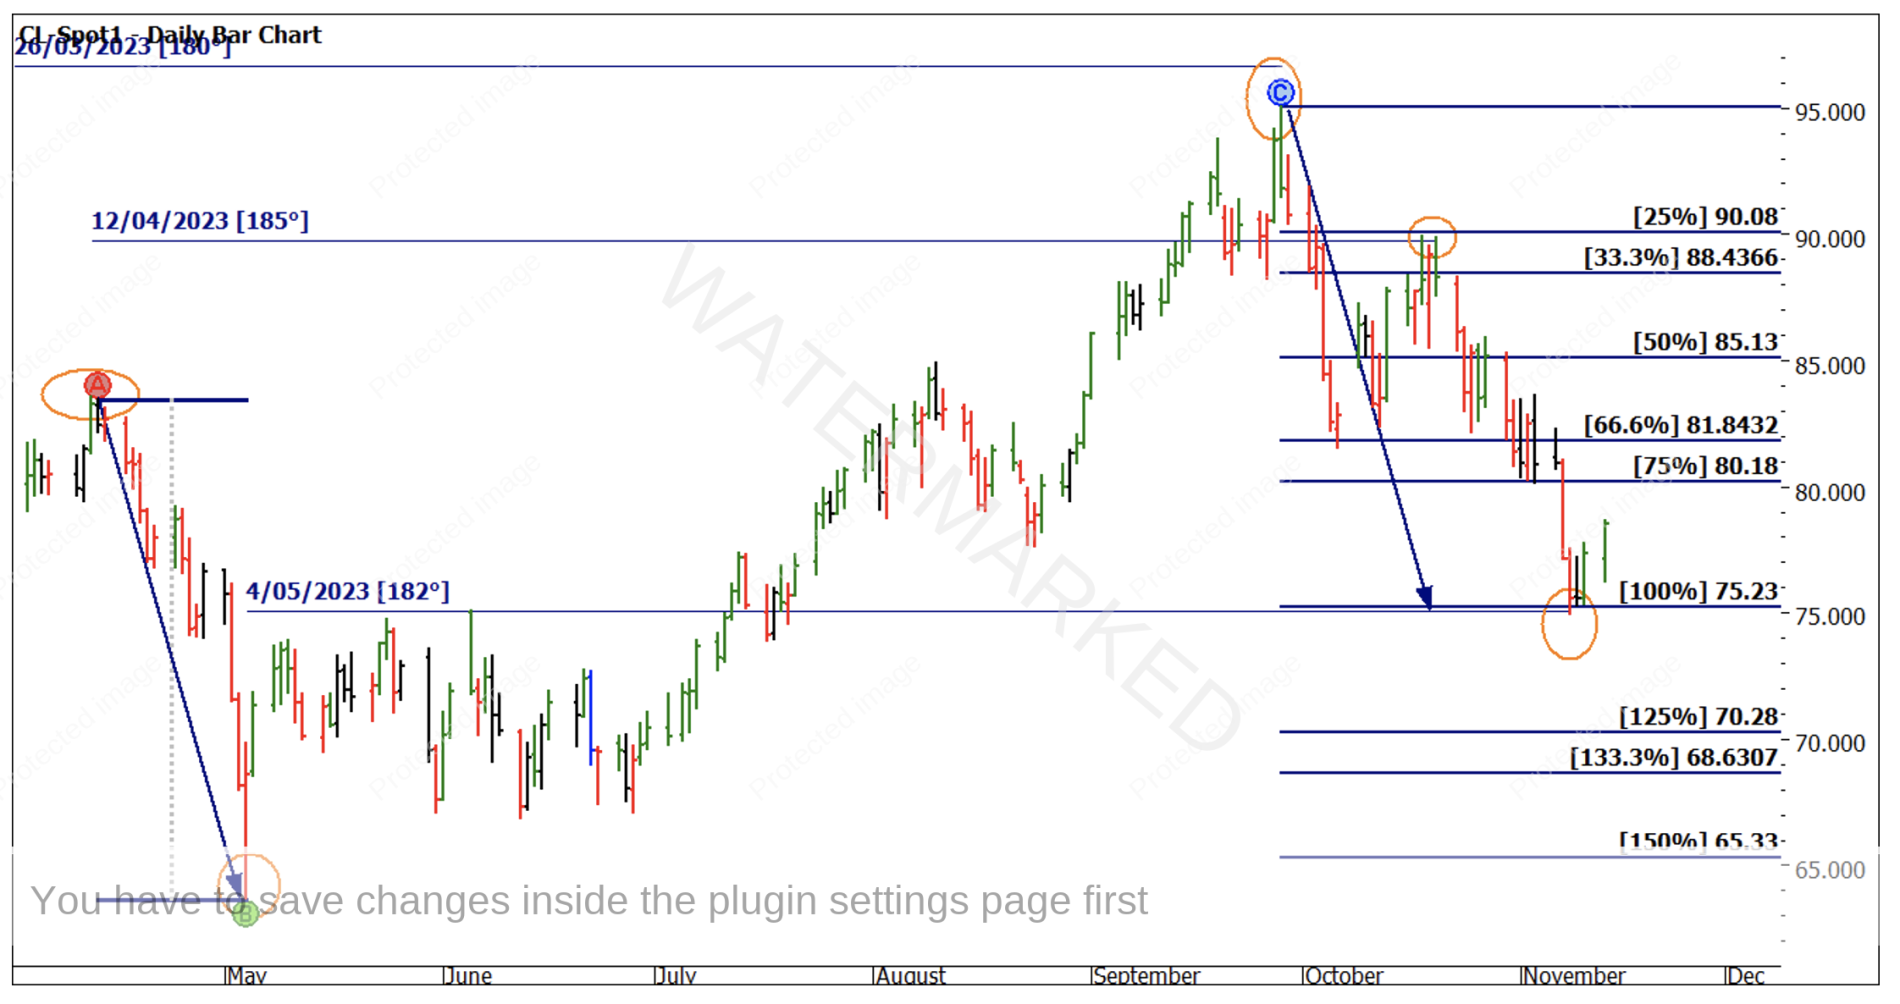
Chart 5 – Daily Bar Chart CL-Spot1
We are at a key junction with Crude, and I was happy to sit out this recent move as I feel what’s next will be important for its future direction.
Analysis is not perfect and nor is the trader, we must shape our view and combine this with the market. You can be wrong in terms of what dates end up being tops or bottoms. Time is more important than Price and I feel if we can get that dimension working then we can use our “trading skills” to navigate situations when markets “invert” or just do not provide clear signals for action.
Good Trading
Aaron Lynch