It’s Complicated!
Markets can run to the rules like a textbook and other times they can leave us scratching our heads. In these uncharted times of COVID and the global reaction, we might expect the historical norms of what markets should do to hold true or we can throw the historical textbook expectations out the window.
Now I am not saying that history is no longer repeating, far from it, in the past we as participants attempt to rationalise down outcomes to simple outputs to be better prepared for the same event next time around. This does not always hold true, and the main point I am grappling with right now is the role that inflation, commodities, and the US dollar play in terms of pricing assets.
We know that most major commodities are priced in US dollars and that when central banks expand monetary policy, as they have globally, that this typically sees a reaction on the inflation front. Now we know there is record debt, low-interest rates, and central banks expanding their balance sheets since the GFC. We are yet to see global inflationary pressures that flow to the USD and of course commodity prices. We have seen some green shoots of inflation in the US in 2021 as they have stabilised after 2020 and the pandemic’s hit to the economy. This kick to the inflation numbers could be short-lived as a return to pre-pandemic levels brings the economy back to the same levels, but could it be the start of a broader cycle?
We must consider if capital is chasing a finite supply of labour and goods or is there slack in these areas that can absorb the acceleration? We are placed somewhat differently in Australia with lockdowns now affecting half the country. The reason I raise this is to understand the implications to the commodities space. Commodities are complicated, they can move dramatically without a necessary shift in underlying demand. How this occurs is if we see a swing in US dollar pricing.
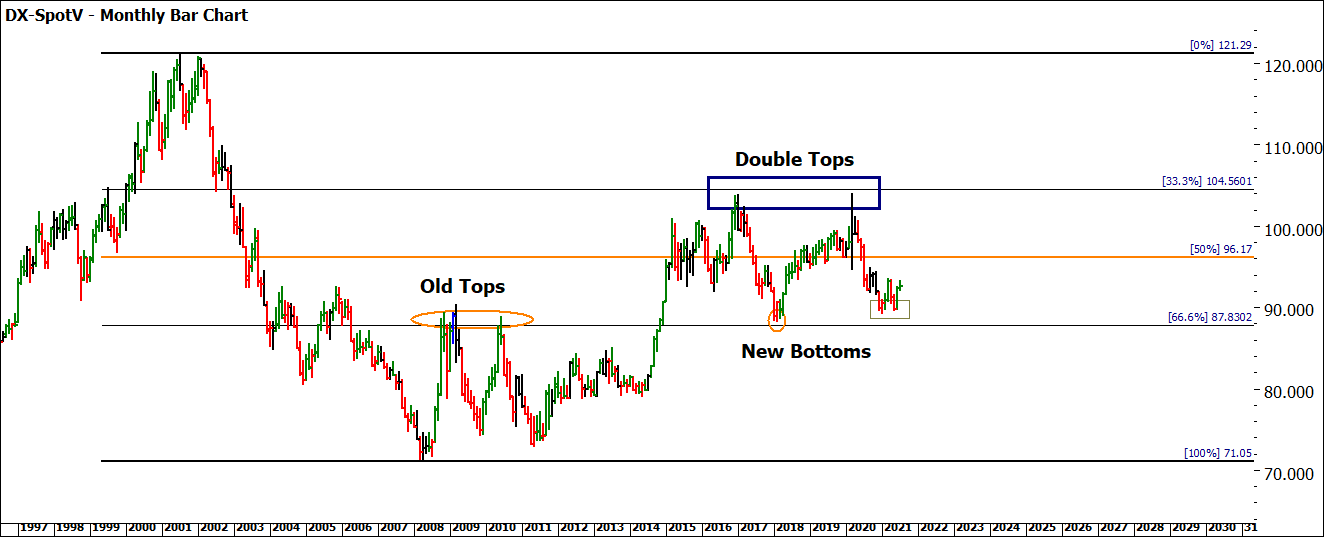
Chart 1 shows the big picture of the US dollar index on a monthly chart. The highest point is the 2000 tech wreck high followed by the decline into the GFC Lows. We see those prices for over a decade have been under the 50% level, so technically a weaker market. Some old tops in 2008 created support levels in 2018 and we are sitting under a clear double top pattern between 2017 and 2020.
Chart 1 – Monthly Bar Chart -DX-Spot
The general position shows that under the 50% level and with the potential 200% of the double top we may be wise to expect some potential weakness. This in turn would follow the narrative that commodities continue to rise in prices, this is observed in markets like oil and iron ore which are so important to the major Australian miners.
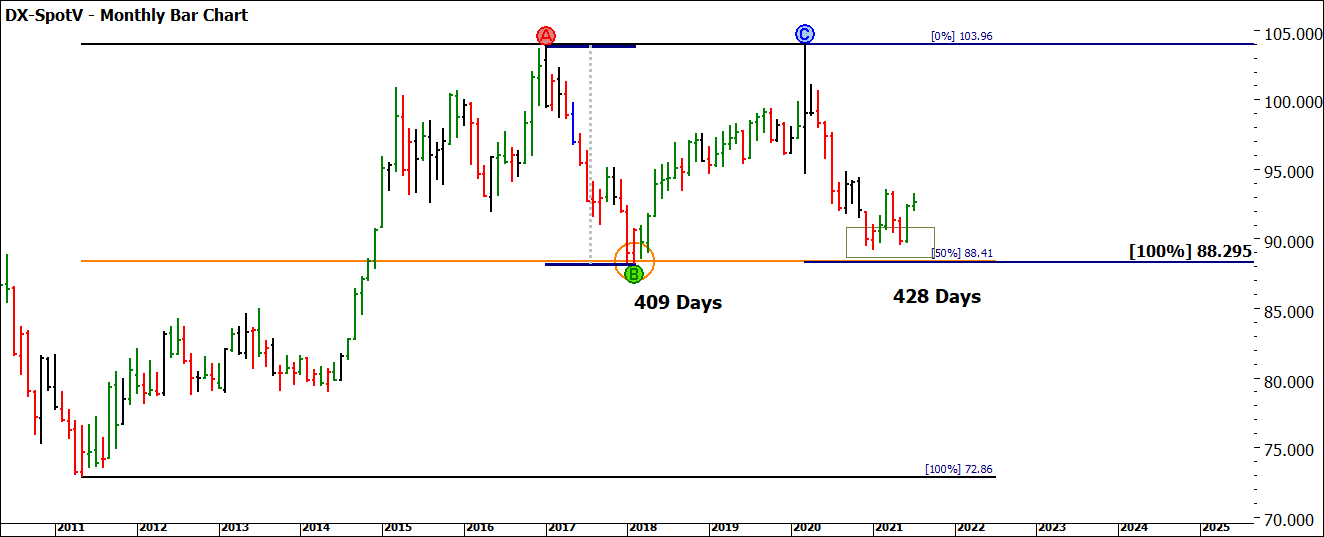
Chart 2 shows a smaller picture on the US dollar, with a different view on the future price movement. Using the 2011 low and 2017 high we can see the 50% retracement holding as support.
Chart 2 – Monthly Bar Chart -DX-Spot
A typical pattern we might see when double tops form is David’s rule of 200%. Once the high in 2020 was confirmed, and the decline lower began, if a sustained bear market were likely we would expect a faster fall in time and price under the low of 2018. This has not occurred and the longer duration in time and the subtle pull up of price above the 100% level at 88.29 does signal that there is some strength in this market currently.
This to my mind is why the study of charts, as opposed to economic statements of what should occur, makes more sense. From what I am seeing on the multiple commodity charts, we may be seeing a disconnect between the general rules to ones where single market factors are driving price action.
For those that have been reading my discussions on high-grade copper, there was a case as to why the May high was a strong area for shorting the market, this initially paid off and delivered some short profits, but allowing the trade to develop with “wider stops” meant that we have returned some unrealised profits. There was a strong case for a stop and reverse strategy, and I will expand on that next month as the scenario plays out, being nimble has meant there is a chance to re-join what could be the dominant trend.
I do hope that you have picked a commodity to study and work on in these current times as they have delivered strong trends in recent times. As we continue to move into more uncharted economic conditions the value of “hard assets” could be the asset class that delivers well into 2022. Remember that commodities can seem like 3D chess as we have more variables to consider, if in doubt though the chart and your skills at reading them will be your best guide as to what is next.
Good Trading
Aaron Lynch

