Just Another All Time High?
I remember the hype around Bitcoin in late 2021 when it was nudging $70,000, with forecasts (mainly from friends) that Bitcoin was soon to be in the hundreds of thousands of dollars. Facebook feeds were filling up with anyone and everyone with their methods of how to make money in cryptocurrencies, the buzz was real and seemed everyone was talking about it.
Fast forward to the current day and March 2024 has seen a new all-time high at 73,803 and there doesn’t seem to be much chatter about it!
What’s the difference? Is it because old all-time highs are old news, or is it because BTC isn’t in the final stages of a bull market yet and there is plenty more to come?
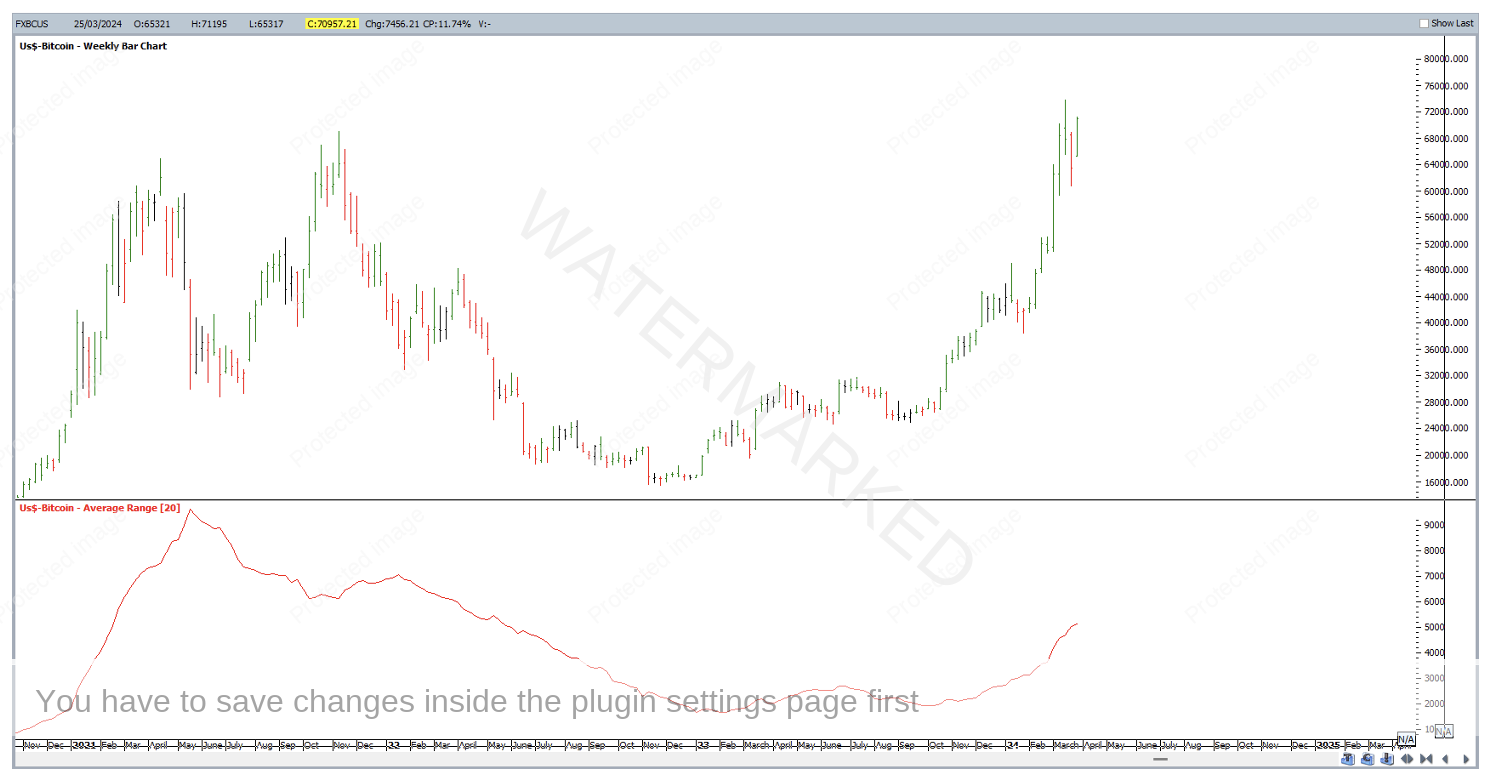
Perhaps volatility has a part in it? The volatility of BTC when it gets going is outstanding, considering the average weekly range back at the start of 2023 was around $1,700-$,1800, while it is now roughly $5,000 and increasing, although it’s still about half the range of 2021.
Chart 1 – Bitcoin Volatility
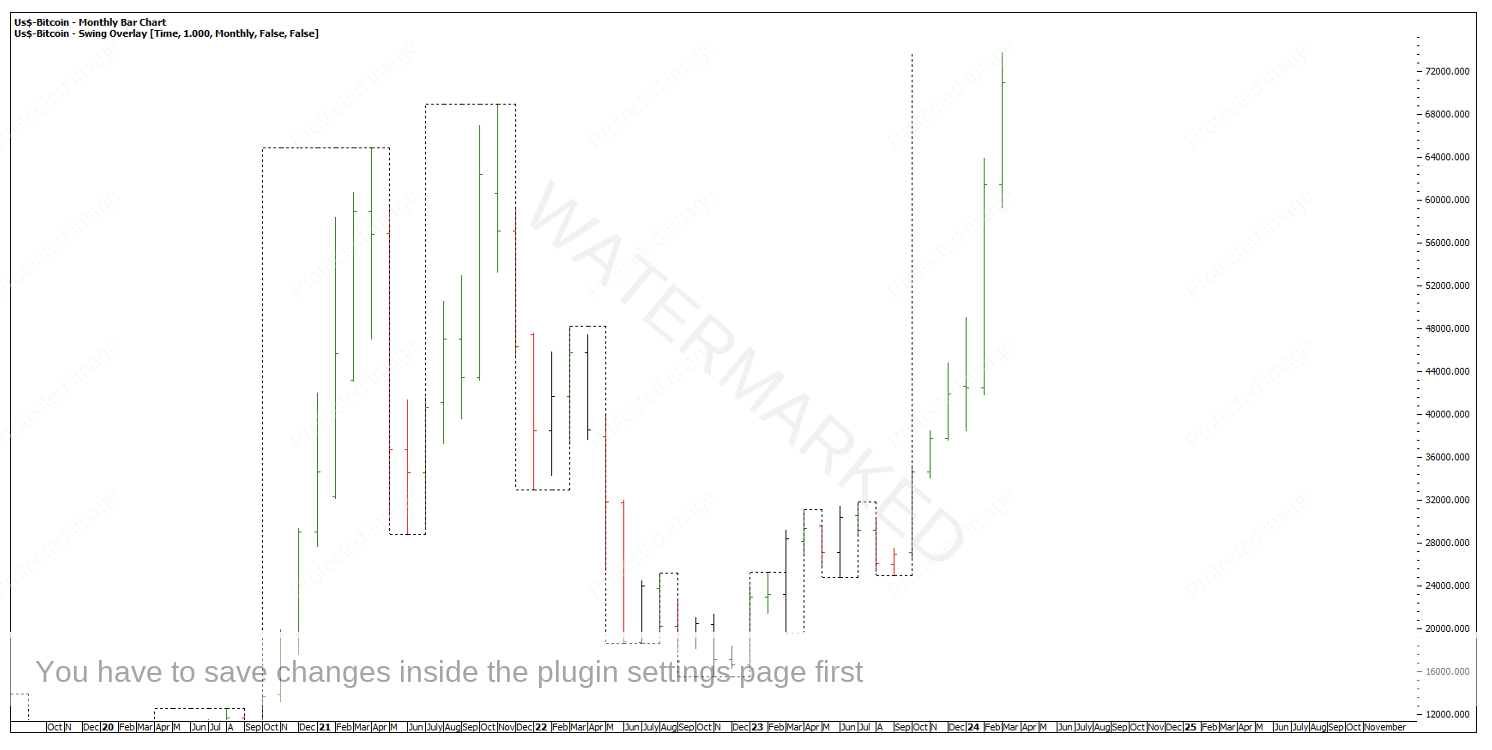
With volatility increasing, all-time highs being broken and the last weekly swing down less than a 50% retracement, I would only be interested in trading long, even though BTC is well into the winter of this monthly swing up.
Chart 2 – Current Monthly Swing
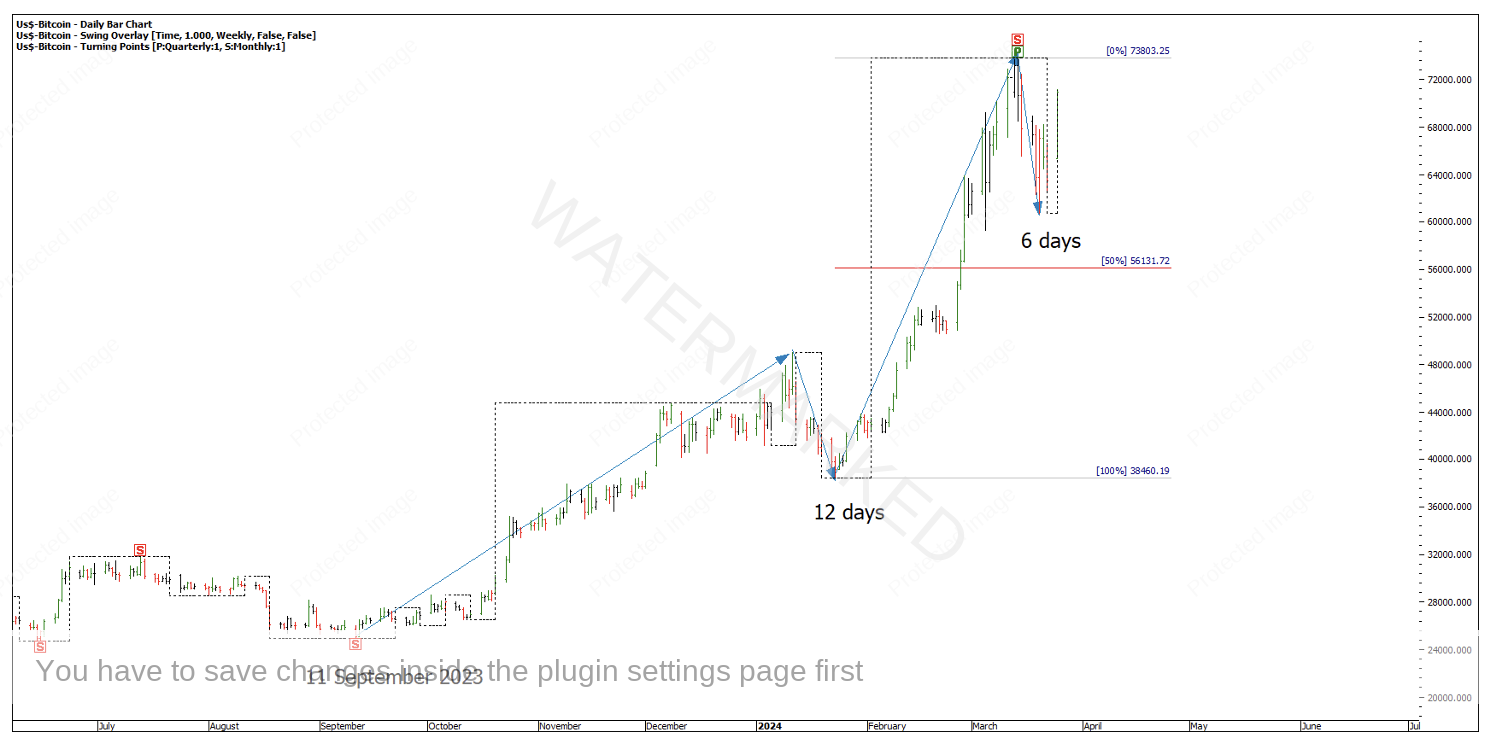
Within this monthly swing starting 11 September 2023, BTC now looks to be in a third weekly section up after a big expanding second weekly section. The current weekly swing pull back is less than a 50% retracement and is a 50% time retracement compared with the previous swing down.
Chart 3 – Weekly Sections of the Market
Big runaway bull markets operate differently and looking over the history of this market, when all-time highs are broken, BTC generally has a very good run and big expanding monthly swings are the norm. See 2013 and 2017 and the market that follows after the previous major tops were broken. Is this the kind of market we are about to witness?
At some point before this bull market is over it’s likely there will be a monthly swing pull back, and potentially a very short sharp one!
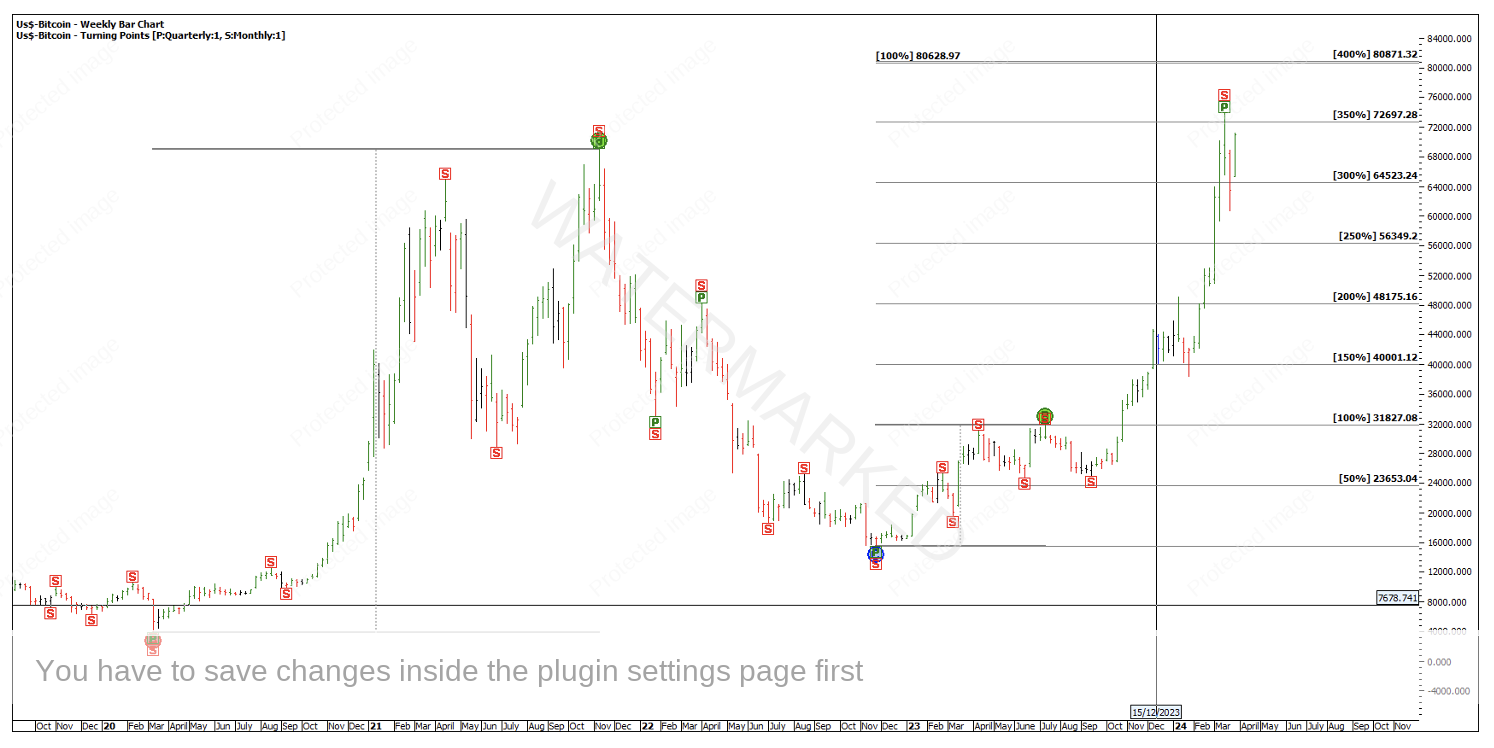
We can still look for the next major milestones and see how the market approaches it. If you combine a quarterly swing chart 100% repeating range and multiples of a potential First Range Out (FRO) then we have the makings of a tight cluster approaching at around $80,600-$80,800.
Chart 4 – Potential Cluster
The market seems to be respecting some of these milestones. However, what is the real likelihood of BTC stopping here? You would at least want to see some weakness start to creep in, some sign that the market is running out of puff.
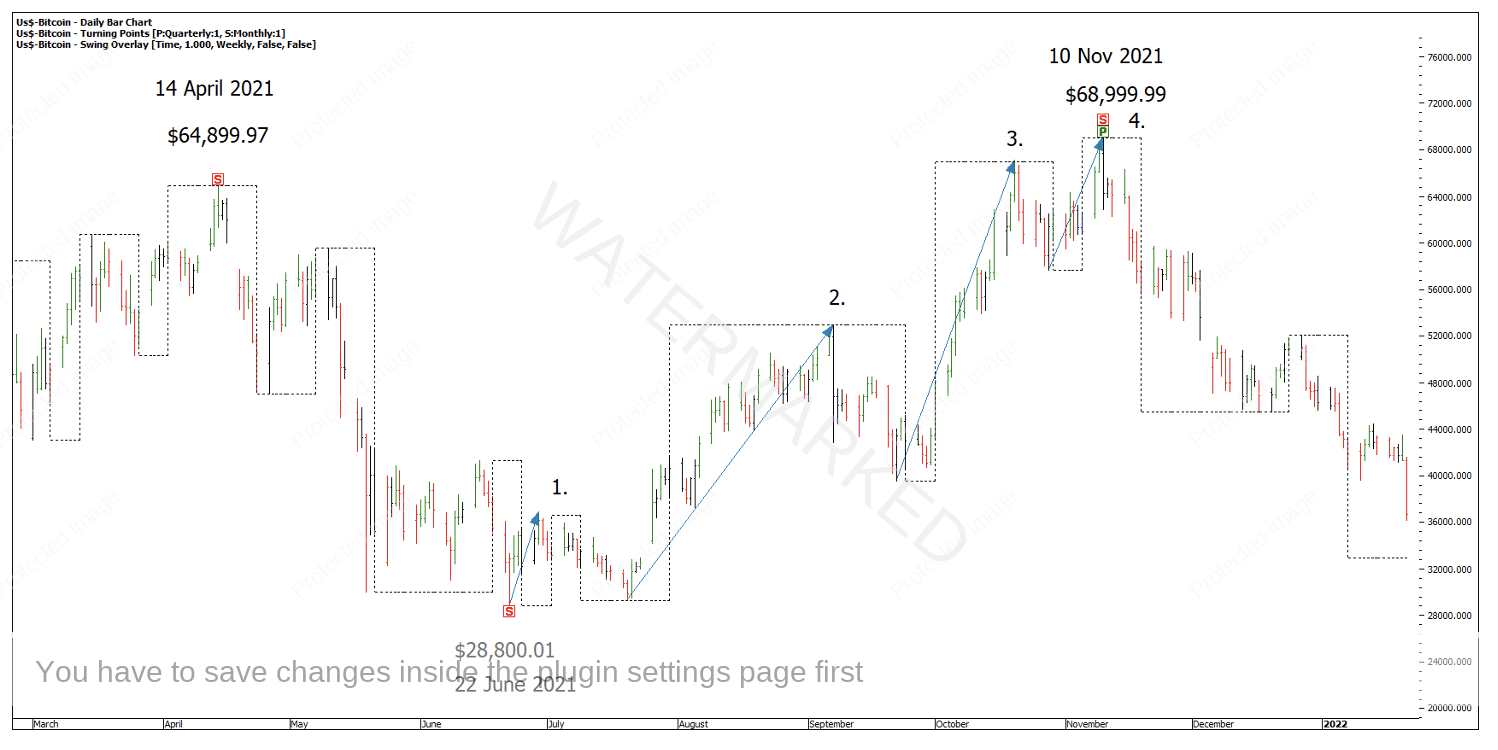
A good example of this is the run up into the 10 November 2021 all-time high. This was a contracting monthly swing for one, but there were four clear weekly sections leading into this false break double top. Section 4 was also a contracting weekly swing range.
Chart 5 – Previous Sections of the Market
The above is a much different scenario than we see at present. I firmly believe the trading opportunities lie in long trades from the pull backs. This market has a history of producing some wild retracements so your entry and stop managements would be crucial if you plan on getting in and holding on.
If you can get set and hold on then you have the potential for a very high Reward to Risk Ratio return.
Happy trading,
Gus Hingeley
