Keeping Focus
Sometimes, it’s the little things like routines and focus that make the biggest difference…
As much as things change, they stay the same. The background of noise from politics, news, markets, family and life was hard when I was learning the skills to trade back in the early 2000’s. It’s fair to say that these challenges are most likely harder now than then. I often think about how hard it would be for me to start my trading journey in 2019.
I have teenage children now, a life that seems to extract more of my time (mostly in a good way) than it did when I was in my twenties. To glue this all together we are also blessed (maybe cursed?) with technology that invades us at every turn to deliver more content (relevant or not) into an already crowded mental space, so if you feel like you can’t get clarity, I can certainly relate to that. I have always had a knack for identifying a problem, but I am sure you are asking ‘what’s the solution?’
The extreme solution is simple, they say we are the average of the five people we interact with based on time. If we could build an island called Trading Survivor the rules would be; combine a heap of great traders, established as well as up and comers and then the only way to get voted off the island was to make 1 million dollars trading. I did say it was extreme…
To study this interaction would be the best reality show ever, would you not work hard so you can stay around like-minded people, or would you work harder to hit the target and get back to your life? Would this environment make you study and learn faster or make you settle in for the intellectual stimulation?
This concept is one that I see daily as I circulate in the world of finance and markets, if I allowed myself to become the average of the 5 people I interact with professionally each week I would never get off the island. Ignoring the “noise” and maintaining the focus on markets is essential. That is why independent routines are critical, more on that in a moment.
The example that jumps to my mind is that of China and its markets. Who has noticed that there seems to be a lot less in the news and media on how China is good, bad or indifferent? During the mining boom, you could not turn a page, click a link or talk to a pundit without hearing them mention China. Guess what, it hasn’t disappeared, and its markets are still trading. When was the last time you studied a chart of China and its markets? Is it on your radar, or are you waiting for the media to reignite your interest?
The importance of China and all its positives and negatives to Australia and the globe will only increase over the coming years. How will you participate in this changing landscape? The last time the media talked up China and its impacts was in Q4 2018 where trade tensions between China and Trump exploded with tariffs and tweets and sent equity markets into a 20% decline. If you checked your 2018 super statements, then you will have seen the impact. Since the cease-fire in rhetoric, markets have bounced and hard, what does this mean to you? Well ask the five people closest to you, if it was important to them its likely something you have noticed and acted upon, if not you are waiting for me to explain what’s happened. Here is where a good routine ensures you don’t miss information. It does not always mean trades or profits, but you are ready to react when needed not when prompted by the noise.
Trading instruments for the Chinese markets are challenging, the one I use as a proxy for the health of the market and its trends /timings etc is the DJSH. This is an index put together by Dow Jones using the major constituents of the shares traded on that exchange.
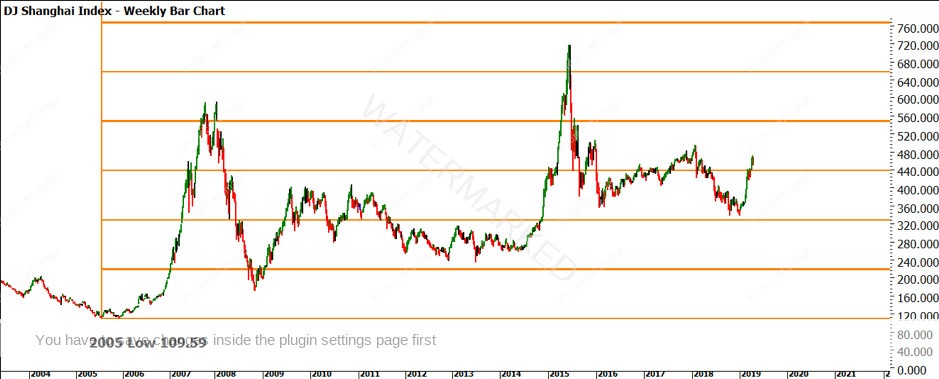
Chart 1 shows the lows resistance card for the all-time low back in 2005. We can see prices have just broken through 4 multiples of the low, you could zoom in and use other lows also as a technical guide.
Chart 1 – Weekly Bar Chart DJSH
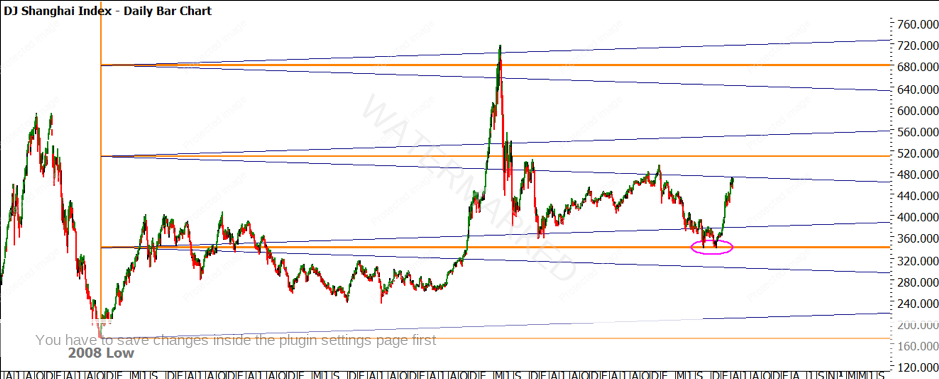
Chart 2 represents a more compelling case for the recent double bottom lows in late 2018. The next lows resistance card comes from the 2008 GFC low @ 170.09.
Chart 2 – Daily Bar Chart DJSH
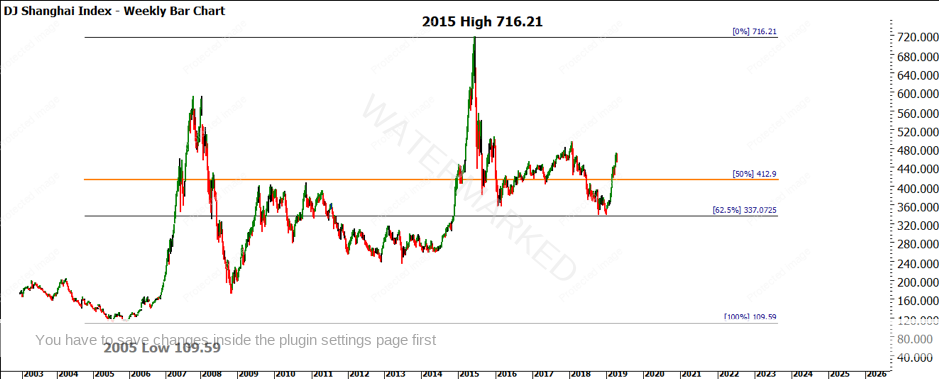
Chart 3 again focuses on using our standard techniques on the big picture, we have a ranges resistance card on the all-time low to all-time high with the recent double bottoms landing around 62.5% of the range (or closer to 61.8%) Fibonacci ratios.
Chart 3 – Weekly Bar Chart DJSH
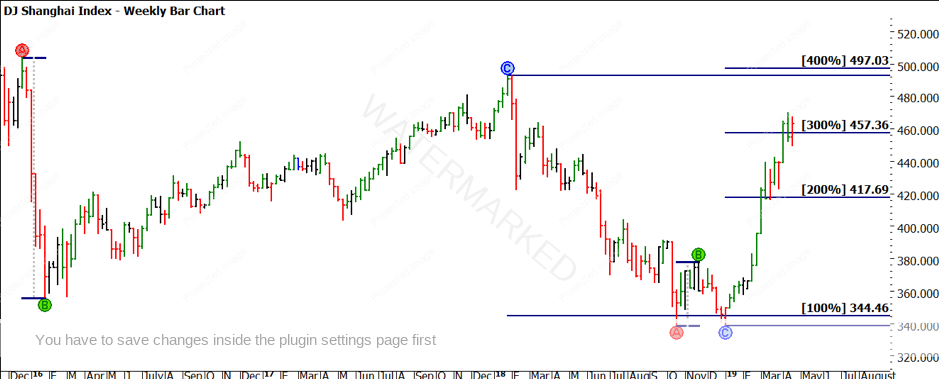
Finally, in Chart 4 we zoom in to the double bottom lows of 2018 that occurred in October and Jan 2019. We have since seen the price action accelerate away (as many index markets have done globally), there is some nice symmetry with the price range of 2016 repeating again into the lows.
Chart 4 – Weekly Bar Chart DJSH
These few charts are easy to set up and have to review as part of your routine, again this means we are less likely to be distracted by the noise. Maybe its time to review your routines to ensure you don’t miss the boat. I can hear some saying how this is not important as they don’t trade the Chinese markets, I certainly hear your point. I use this information to assist broader thinking especially around commodities and inter-market analysis.
Good Trading,
Aaron Lynch


