Know Your Numbers
Welcome to the February edition of the Platinum Newsletter. It never seems to take long for sentiment to change, whether it’s bullishness that changes to bearishness or vice versa.
If you listened to the news to base your trades off, you could easily be long, short and sideways all in the one day. News may have an effect on the markets, but often the major trend is already underway and it’s our emotions that cloud our judgment and get in the way of good analysis.
As I have watched the tensions growing between Russia and Ukraine, I sincerely hoped that war was to be avoided between the two countries. However, I’m aware that whatever happens is out of my control and has very little bearing of how I analyse a market.
The problem I find is there’s always something brewing that’s being pumped up by the media to get your attention. Not that long ago it was Brexit, the elections, COVID, riots, then more COVID and now Russia just to name a few.
One great advantage of being a technical trader is the ability to identify time and price clusters on any given market and being able to choose when to trade and when to sit out. We have plenty of great techniques at our disposal thanks to WD Gann and David Bowden.
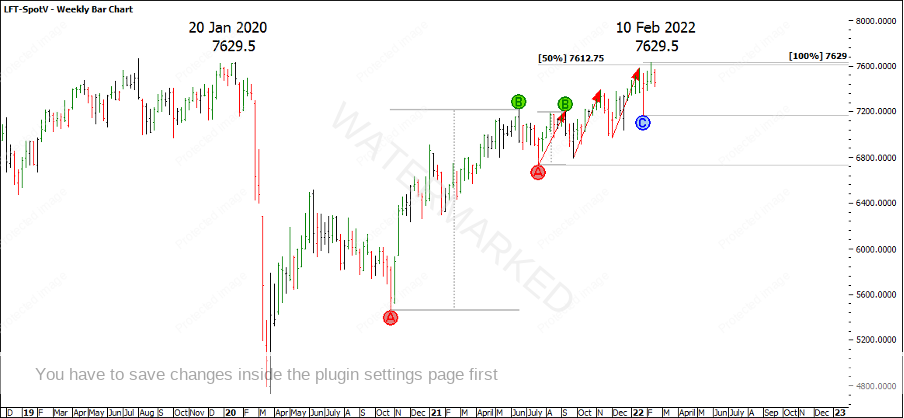
Utilising techniques out of the Active Trader Program and Ultimate Gann Course, I’ll continue the discussion on the FTSE100. In January’s article I wrote about the price cluster looming around 7709-7712, although I shouldn’t have overlooked the cluster at 7612-7629.5.
Chart 1 below shows the price cluster I refer to and how I see four sections into a larger 50% milestone which double tops with the 20 January 2020 top exactly.
Chart 1 – FTSE Cluster
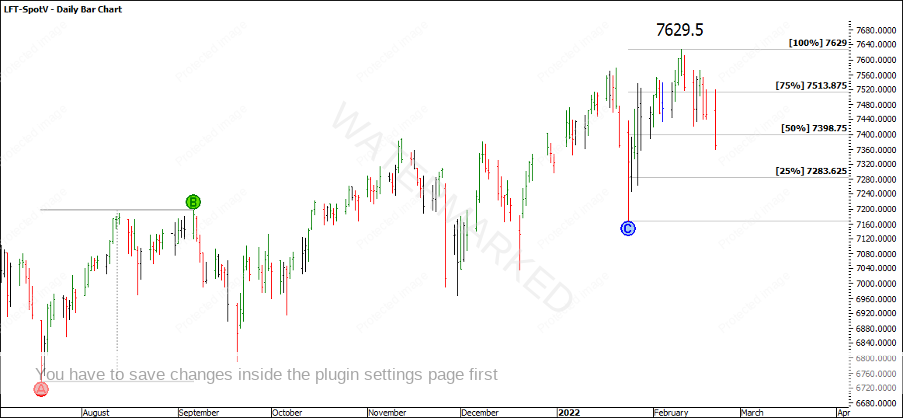
Also, the last weekly range up is exactly 100% of the July to September First Range Out to within half a point.
Chart 2 – Sections of the Market
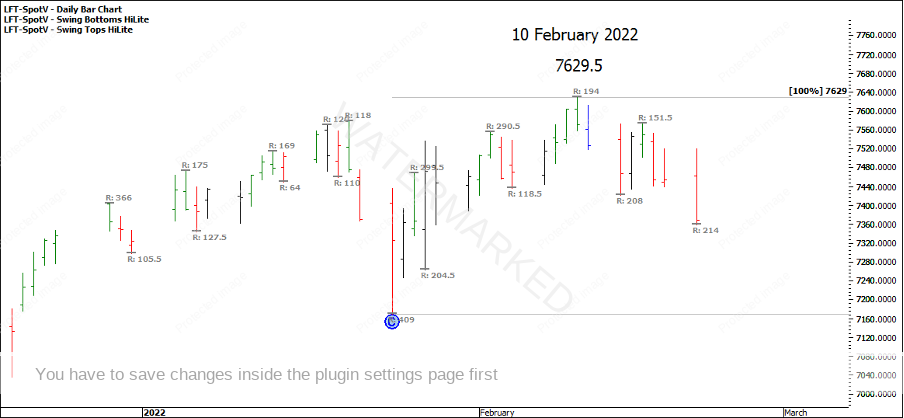
Form reading this last weekly swing, we can see three daily swings with the last two of them showing contracting ranges. Then for extra confirmation, an expanding daily swing down, which confirmed a first range out of 208 points, followed up by a third contracting swing up at 151.5.
Chart 3 – Daily Swing Ranges
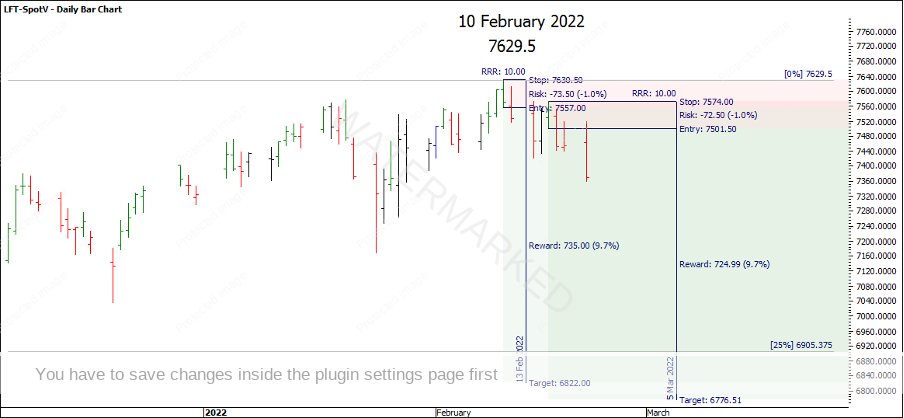
So far, there have been two end of day entries, one being the signal bar on 10 February and the second, a first lower swing top entry on 16 February. Both entries presented with the same amount of points of risk, 72-73 points each, meaning for a high Reward to Risk Ratio to be achieved we would need to see the FTSE drop around 720 to 730 points from entry for a 10:1 Reward to Risk Ratio.
Chart 4 – Reward to Risk Ratio
The end of day entries were definitely the cleanest, however you still might like to look at the last daily swing and break it down into intra-day ranges to see if you could supercharge your RRR. Not only does a smaller risk give you a much greater chance of a high Reward to Risk Ratio, it also gives you the opportunity to bank a high Reward to Risk Ratio trade much sooner.
Happy trading
Gus Hingeley


