Less is More
The goal is always to pay more attention to stronger setups, and less attention to the weaker setups. So how can we do this?
Nothing has changed. Double tops and double bottoms at the 50% resistance level of a major range are a strong technical set up. Scroll through a list of markets on a regular basis, and these set ups will appear. With enough practice, hindsight will become foresight, and it will no longer be too late for you to trade the opportunity.
The goal as always is to pay more attention to stronger setups, and less attention to the weaker set ups. So how can we do this?
To begin with, have your chart at the weekly time frame. By default, in ProfitSource, your chart will usually open on a daily time frame, so hit the PLUS (+) key once, and this will change the resolution of the chart to weekly. Double tops and double bottoms that appear on a weekly chart are stronger than those that appear on a daily chart, and usually always result in a bigger move.
Secondly, when it comes to price analysis, keep it simple and switch off the less significant resistance levels. This article emphasises this by only showing the 50% resistance level – the strongest and most important. Of course, with your drawing tool in ProfitSource you would leave switched on the 0% and 100% levels as these are at the high/low (or vice versa) of the Resistance Card when you place it on the chart. This is done with the Gann Retracement tool in ProfitSource, and it implements what we know as a Ranges Resistance Card.
So, you are probably already thinking, if I begin my analysis with the chart on a bigger time frame (i.e. weekly as opposed to daily), and switch off the less significant resistance levels (those other than 50%) won’t this result in a lot less trading opportunities?! The answer is yes, but the good thing is that most of the trades this cuts out will be the weaker ones – the losers. So the message here? – Less is more.
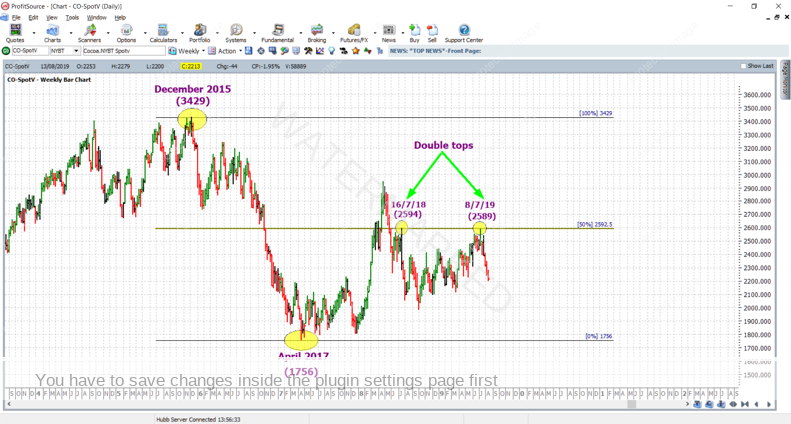
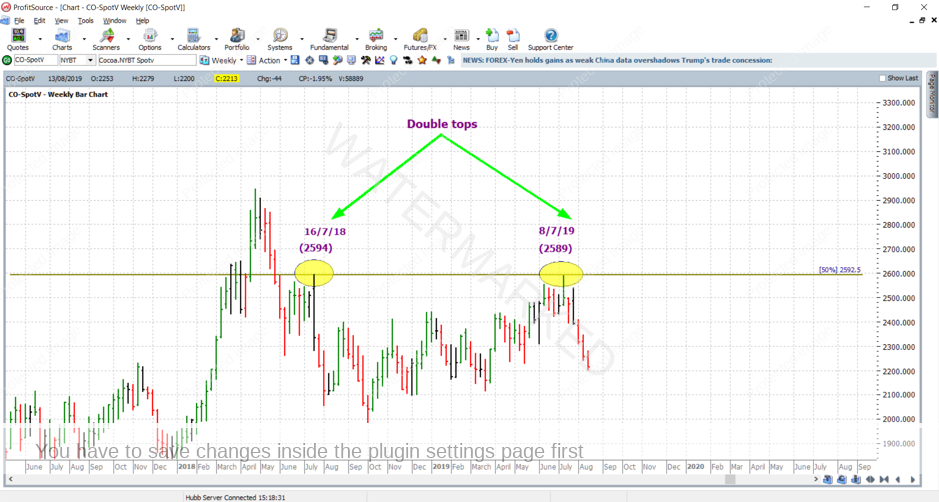
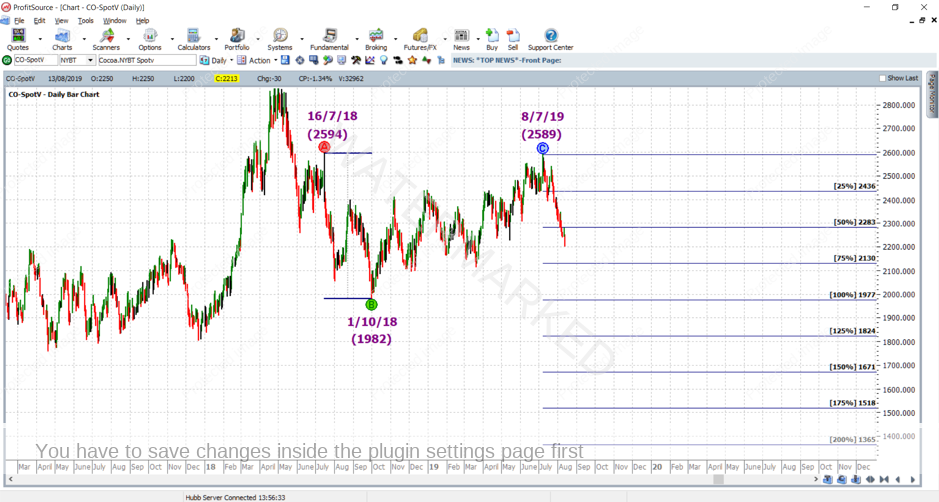
And now to an example from the Cocoa market (chart symbol CO-SpotV in ProfitSource). It’s a good example of a double top, because there are some recognisable things about it regardless of your level of Safety in the Market education. See the chart below. On 8 July 2019 (at 2589) this market made a double top with 16 July 2018 (at 2594), both tops meeting resistance at 50% of the range from the December 2015 top (3429) to the April 2017 low (1756). With a double top of this magnitude, the 5 points in error (2594 – 2589) is easily tolerable.
And below is a zoom in on the chart above, just for a closer look:
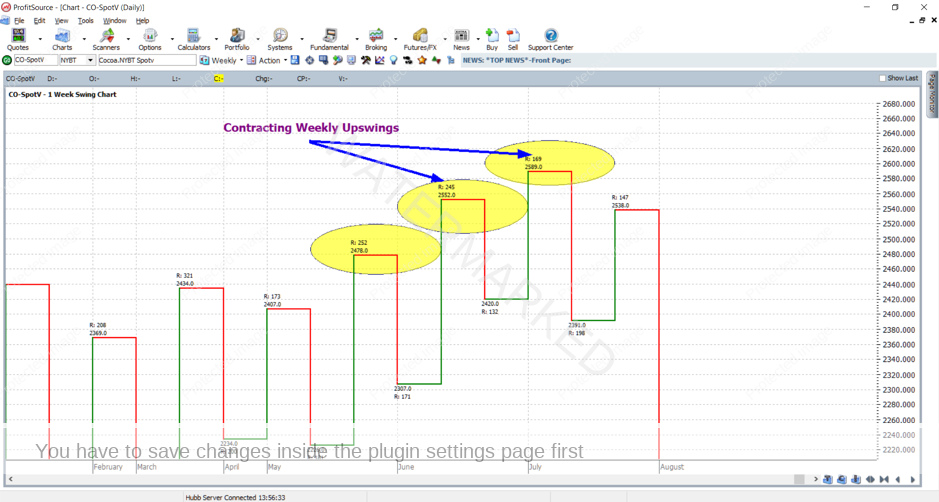
If you come across a double top via the above means, what about supporting your find with further technical evidence? For one, we can go to the swing chart. The weekly swing chart below shows contracting weekly upswings leading into the July 2019 top – a sign that the bears were nearby.
And for more advanced students, there was a good example of time analysis to support 8 July 2019 as a date to watch for a turn in this market, but that’s getting a little beyond the scope of this article.
So now that we’ve come across a double top, what about trading it? More advanced students will know how to get an early entry, and manage the trade for a potential exit at the 200% milestone if the double top pans out as a strong one. In the meantime though, there is still plenty for beginners using the Smarter Starter Pack. Have a look at the success of the first few ABC short trades out of the 8 July 2019 top in the chart below. Note I have used the December contract chart, and for clarity I have left off the ABC milestones – but you can clearly see – no “ambush” of the Point C days thus far.
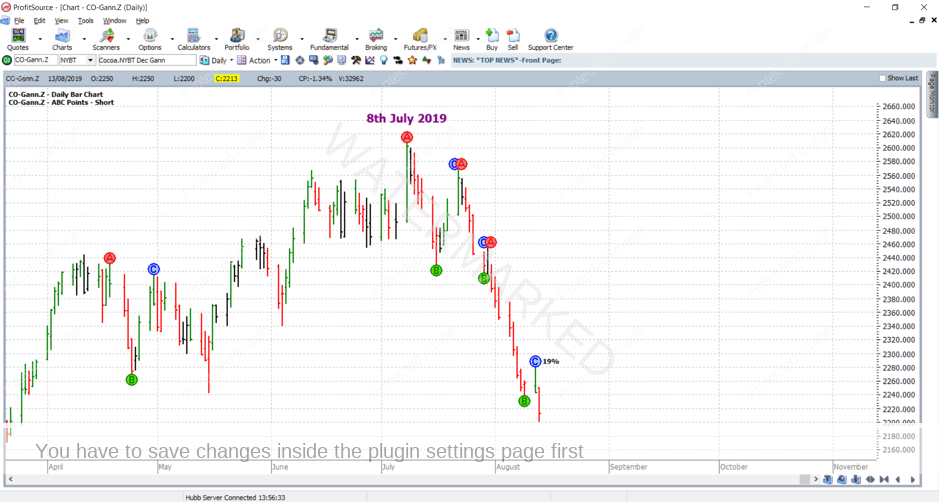
So where to from here? The 200% milestone? As shown below, that’s still a long way off, but so far things are unfolding nicely, with this market well and truly through the 50% milestone. With some good trade management it is already possible to have taken some profit, and at worst be at the break-even point.
Cocoa futures can be traded through the Intercontinental Exchange (the “ICE”), 4.45AM to 1.30PM New York Time. Each point of price movement changes the contract value by $10 USD. The current initial margin is $2090 USD, and as this article is being written, the December contract is just about to take over the September contract in terms of highest trading volume. Alternatively, for those still wishing to access this strongly trending market with much lower margin, it can be traded using CFDs.
Work hard, work smart!
Andrew Baraniak