Long and Strong on the Angles
The recent RBA announcement to cut interest rates did little to move the needle in terms of price movements on the SPI200. Interest rates just aren’t the ‘flavour of the month’ right now as the SPI200 has already moved over 1200 points out of the 7 April low of 7172 on the back of US Tariffs.
On Friday 4 April, the SPI pushed through what I thought to be a pretty strong support level of around 7440 and managed to drop about 566 points in the combined Friday night, Monday day trading session. Considering the monthly range from 23 December low to 14 February high was a range of 586 points in 53 days it was a significant daily move.
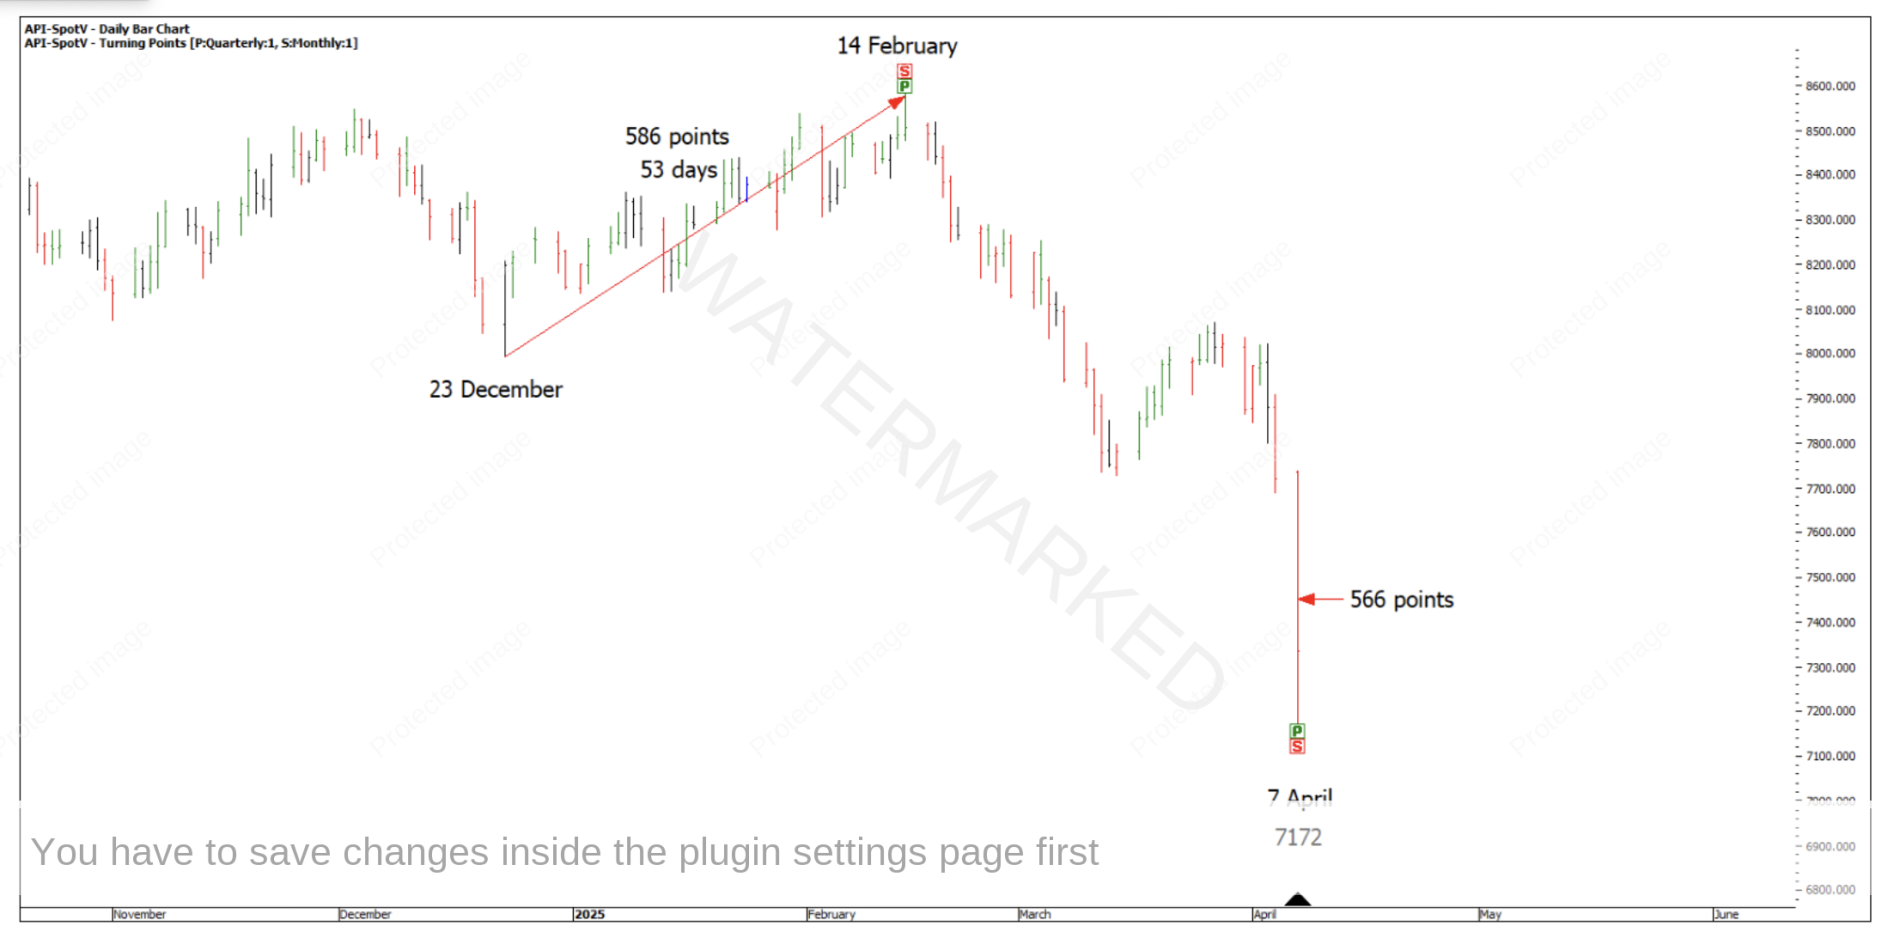
Chart 1
My trading emotions where fairly elevated around this time but isn’t it amazing the harmony that was there at the low by way of a strong cluster. In Chart 2 below you will see a couple of milestones that helped to call this low. You will notice 7193, that is 50% of the COVID range down.
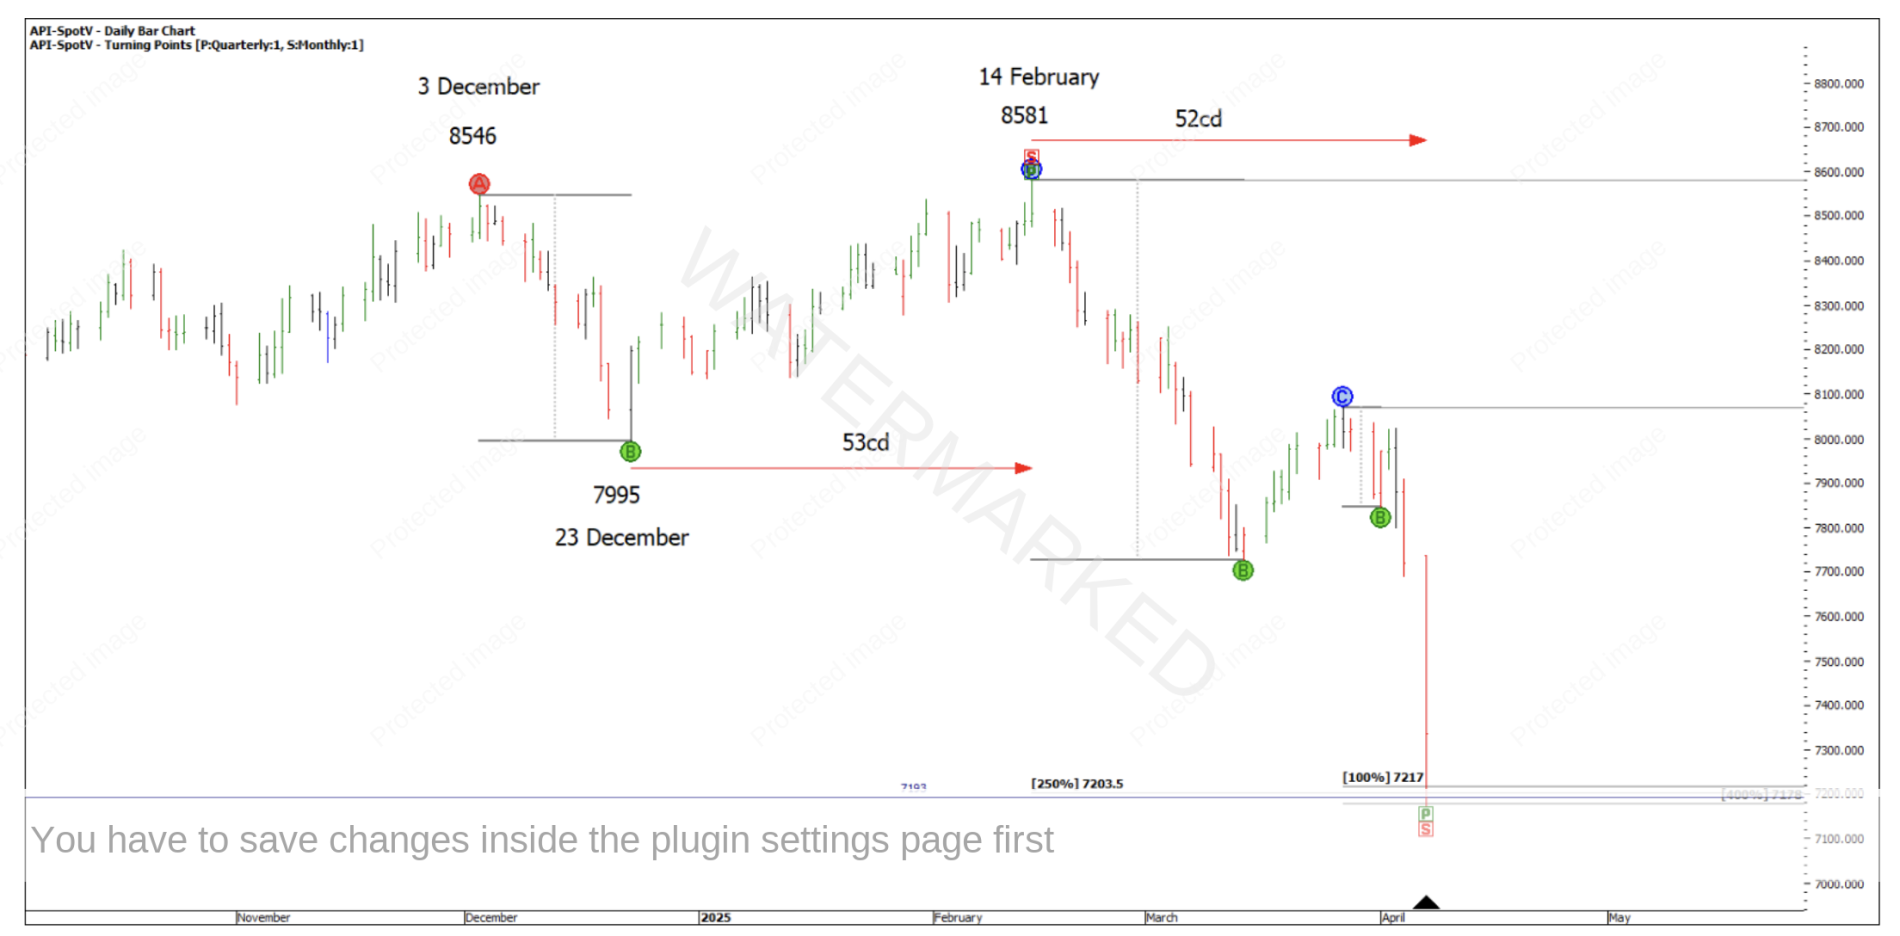
Chart 2
W.D. Gann talks about using market angles to forecast. The simplest way I’ve found to do this is by running 2×1 and 1×1 angles from every weekly swing low and high. I do this on my hand charts in light pencil and only draw them about 20cm long.
My daily bar charts are drawn up at 10 points per 1/8 inch, so a 1×1 angle at 10 points per day is a 45-degree line which is what W.D. Gann talks about.
This is something I encourage everyone to do. Angles don’t need to be on your chart to call exact prices, they can just be there to help rate the strength of a market. That way you can have many more angles on your charts without getting overly confused.
From the 14 February high you can see the market never got above the 2×1 (green) running down. For me trading below the 2×1 running down is a sign of strength to the downside and my general rule is I don’t want to trade long when the market is trading below the 2×1 (and vice versa)
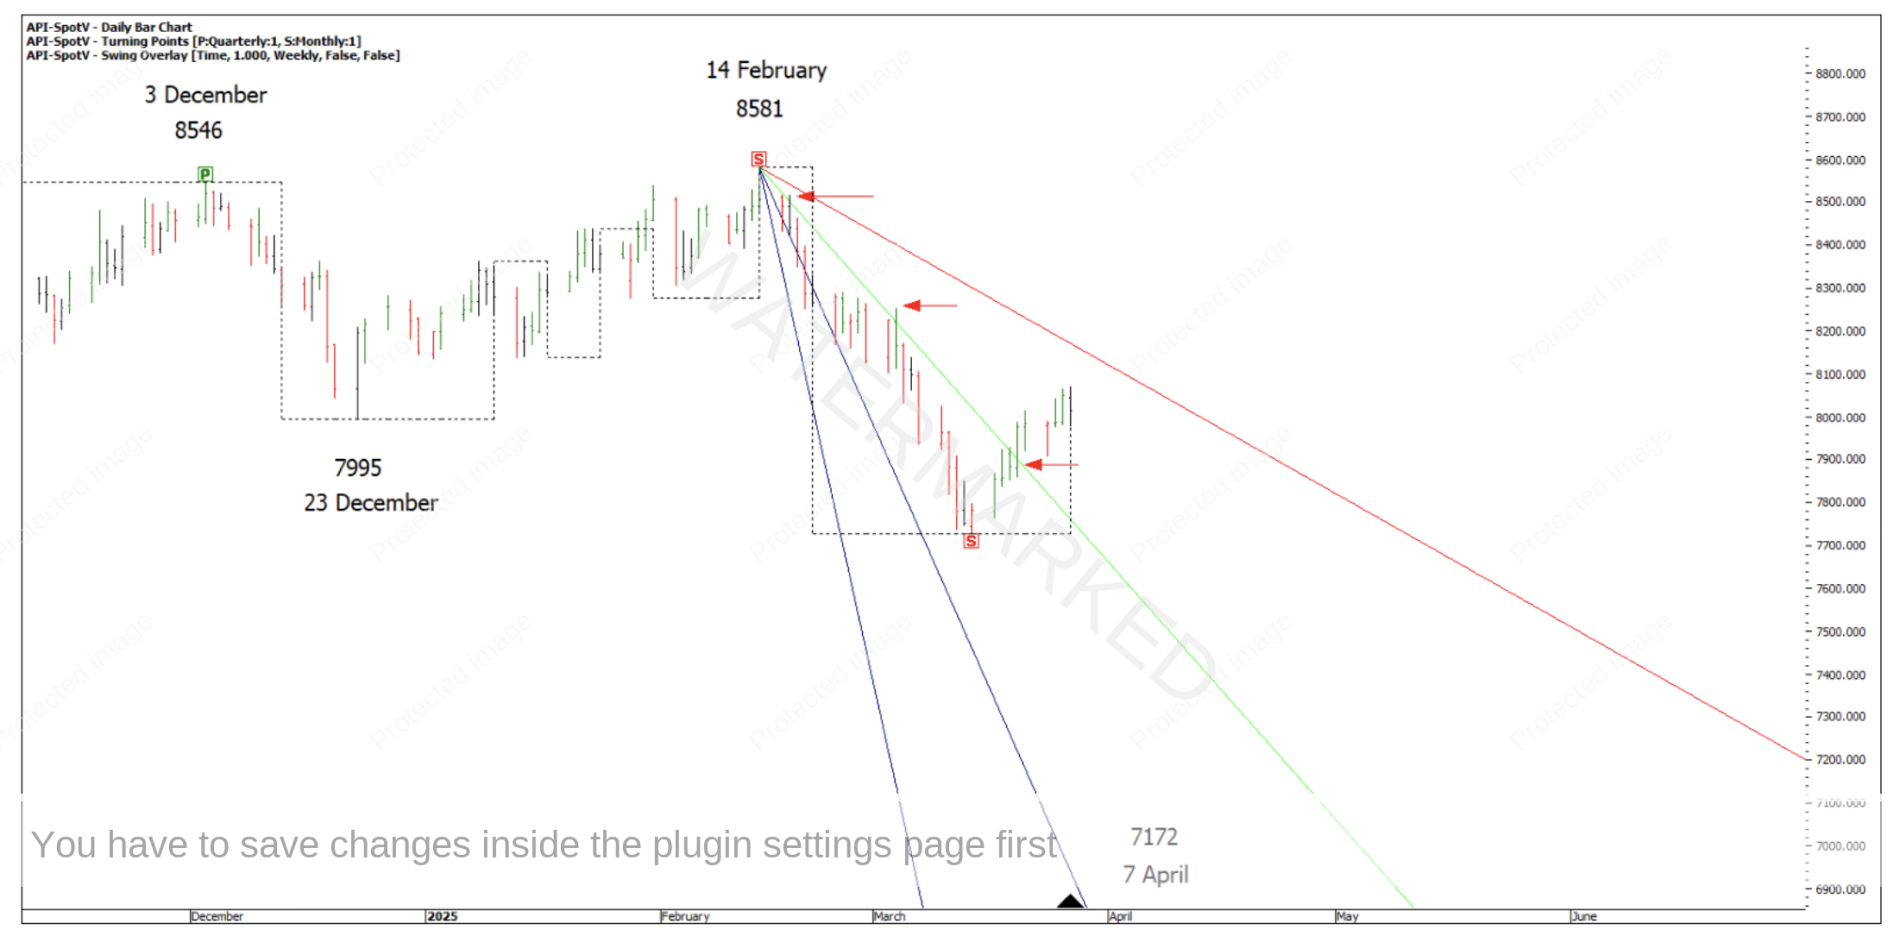
Chart 3
When the next weekly low forms, the next angle goes on. The SPI200 puts in a daily lower top below the 2×1 and now is in a better ‘shortable’ position in my opinion.
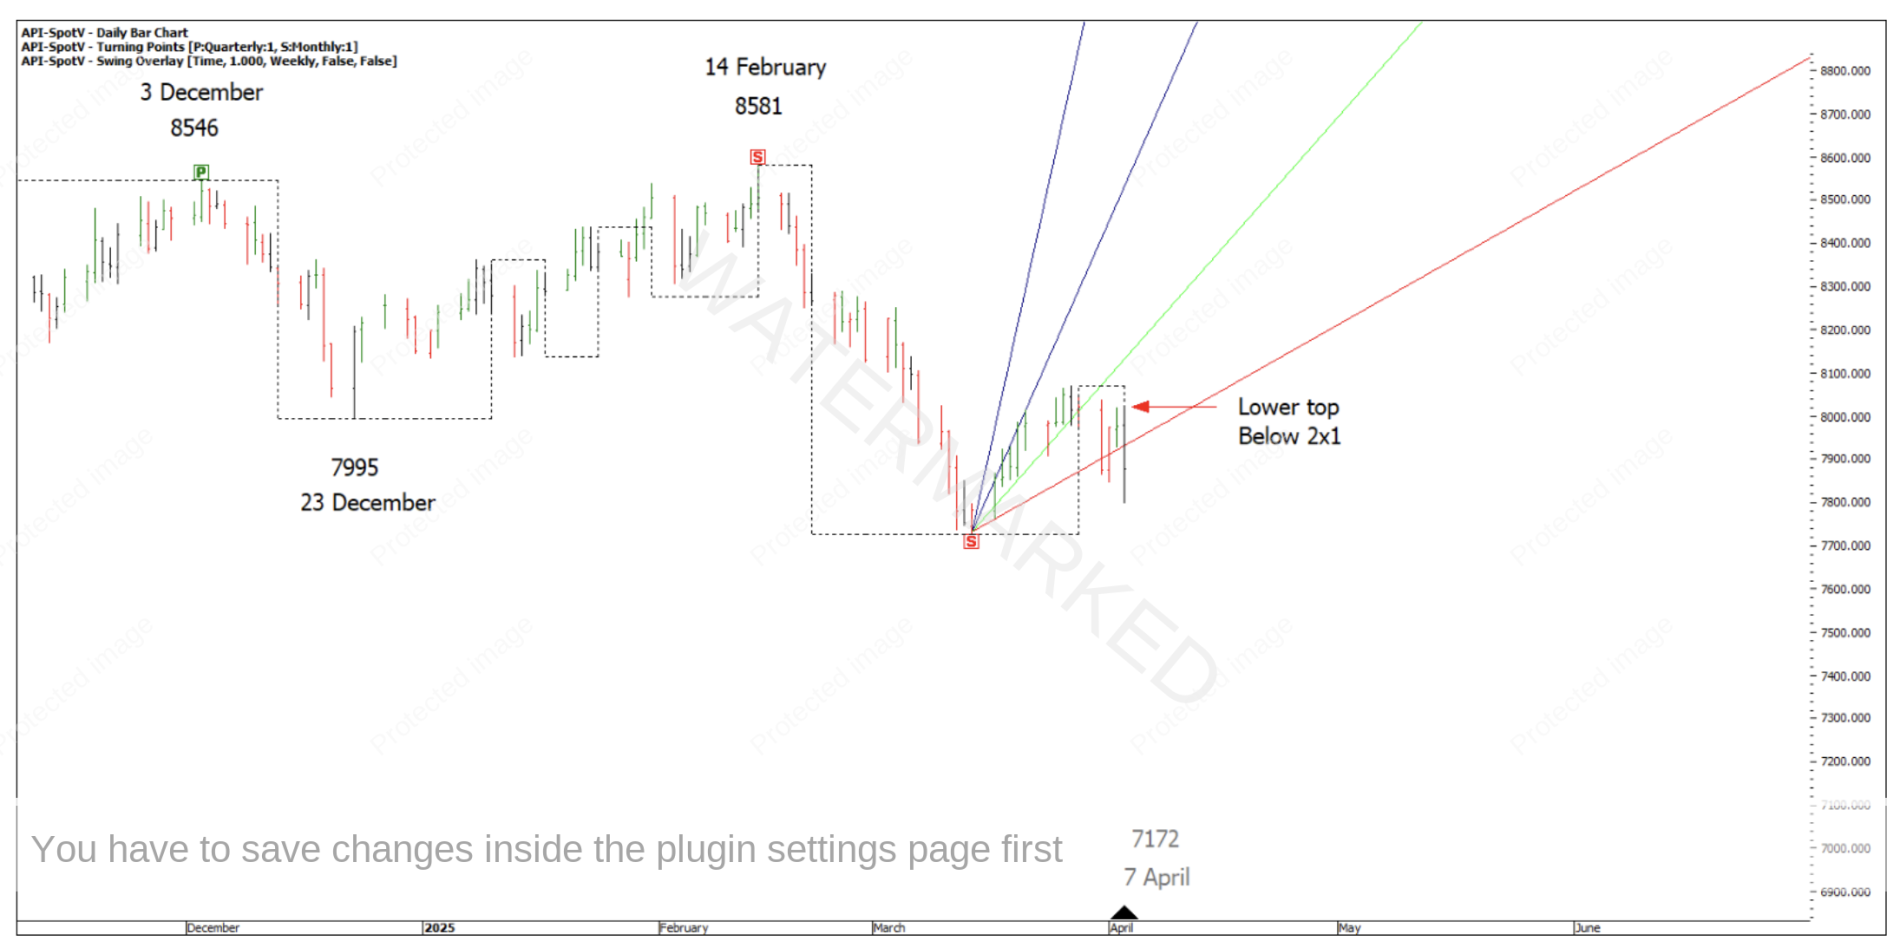
Chart 4
Now this is where rules can keep you out of a trade. The actual low at 7172 came out of a good cluster but it was well below the 4×1 and sitting on the 8×1! This provides a bit of a conundrum; do you take a trade based on a strong price cluster and ignore one of the market indicators or do you wait?
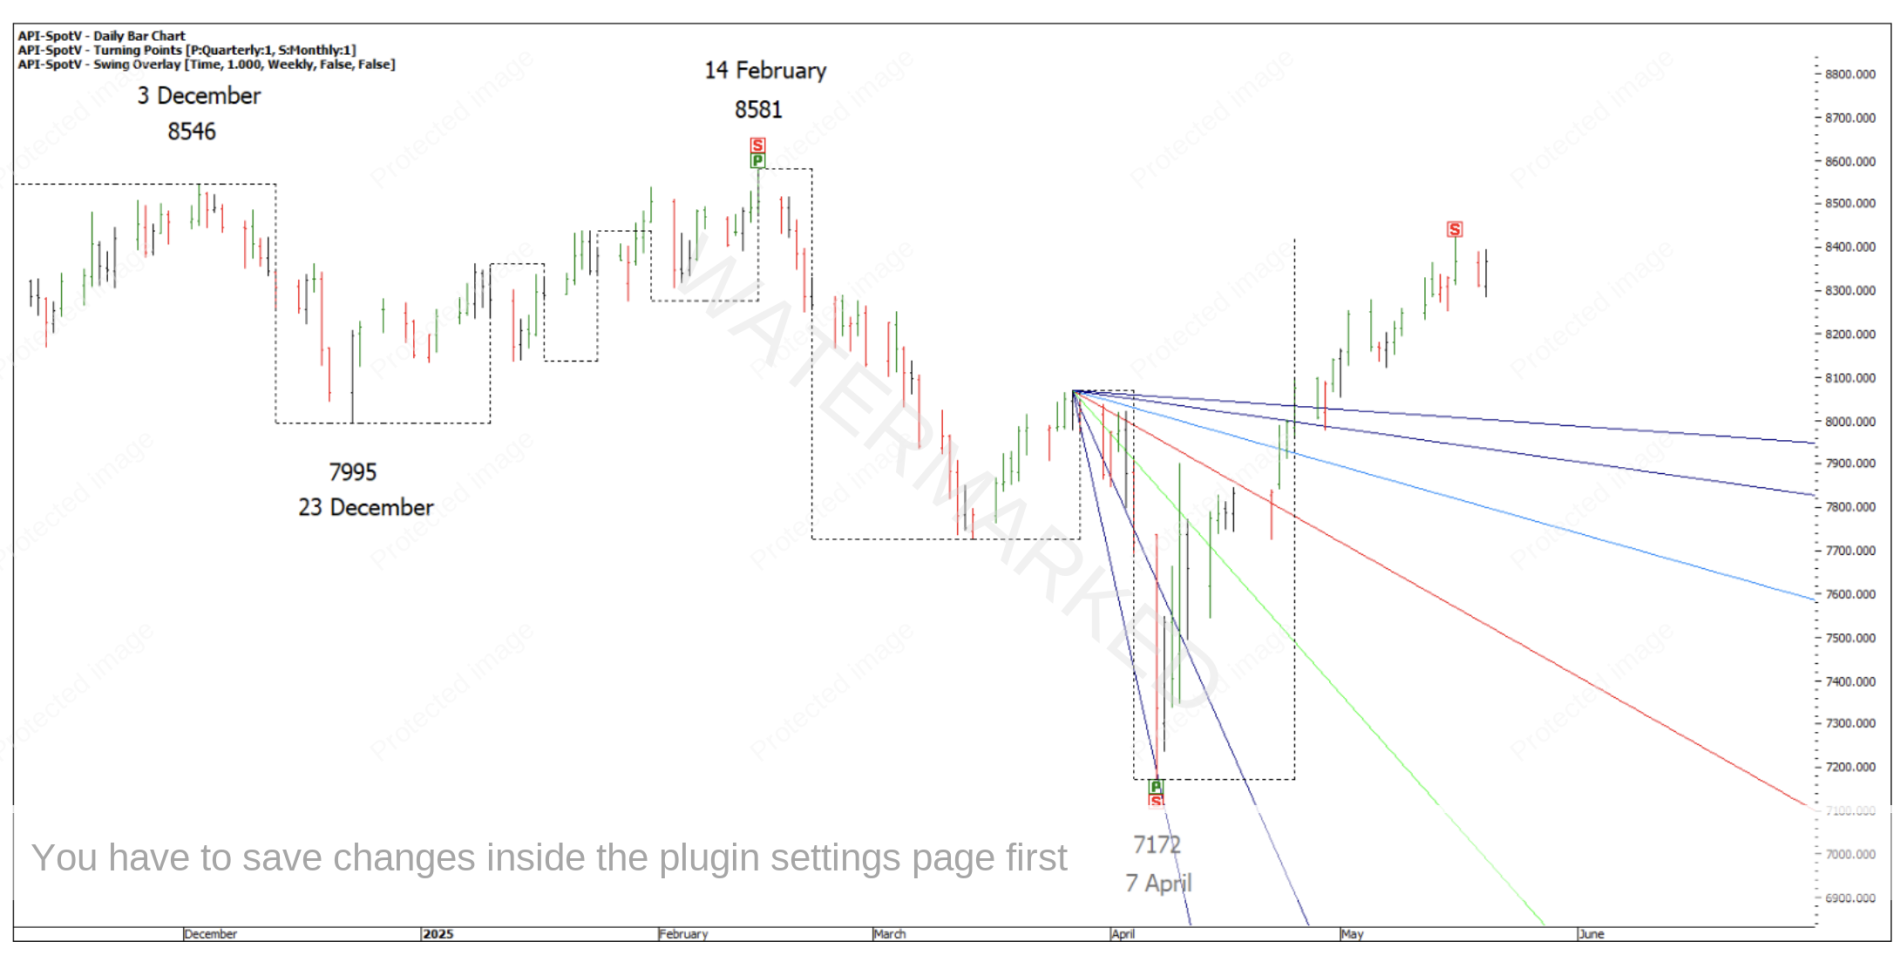
Chart 5
For me I waited and watched the market bounce strongly, initially trading above the 8×1, then finding a daily higher swing bottom support on a 4×1, to the present day where we are moving between the 4×1 and the 2×1.
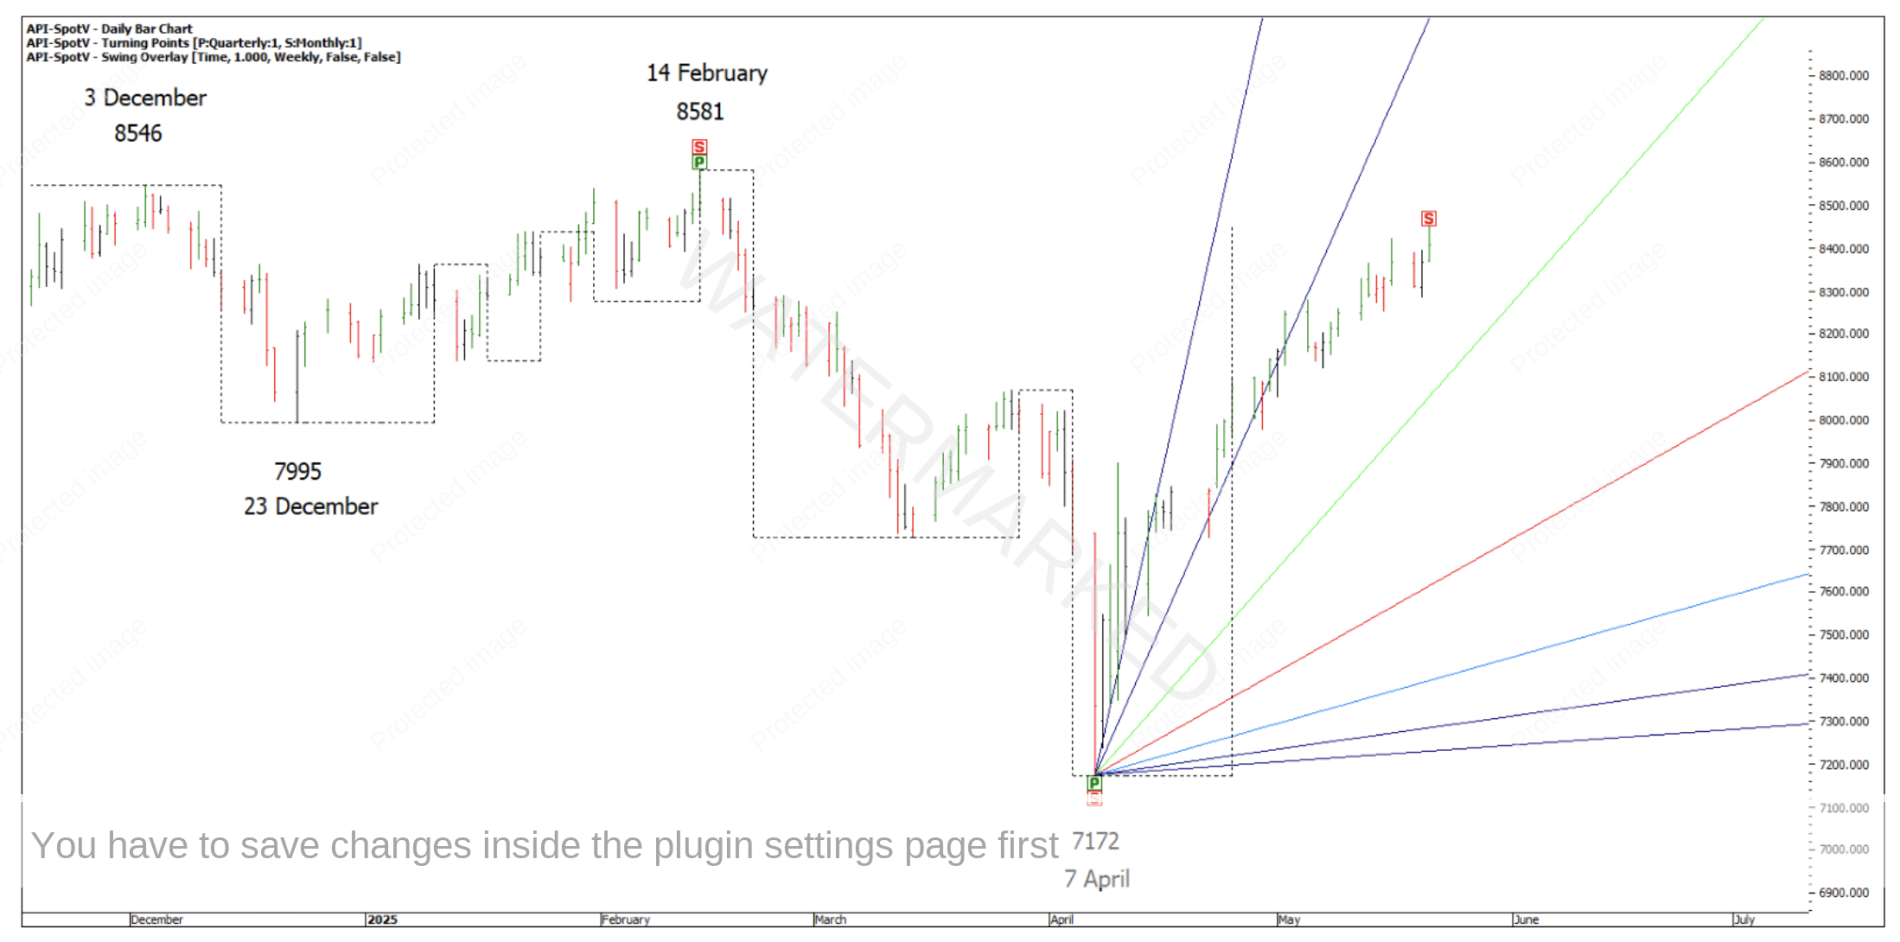
Chart 6
If you have been out of the market wishing you were in, then it might pay to remember one of David Bowden’s quotes,
“It’s better to be out wishing you were in, than to be in wishing you were out”
As long as you keep your capital safe there will be many more trading opportunities to come throughout the year.
If we engage our form reading skills, I see some interesting signals here to recognise. That being said, the market is trading around the 200% level of the last monthly swing up, which is all one weekly swing. However, the daily swing lows are getting closer and closer together, as the market moves from the 4×1 to towards the 2×1 angle. The daily ranges are also getting smaller and back to a normal market range again which all indicates to me that this market is running out of steam to the upside.
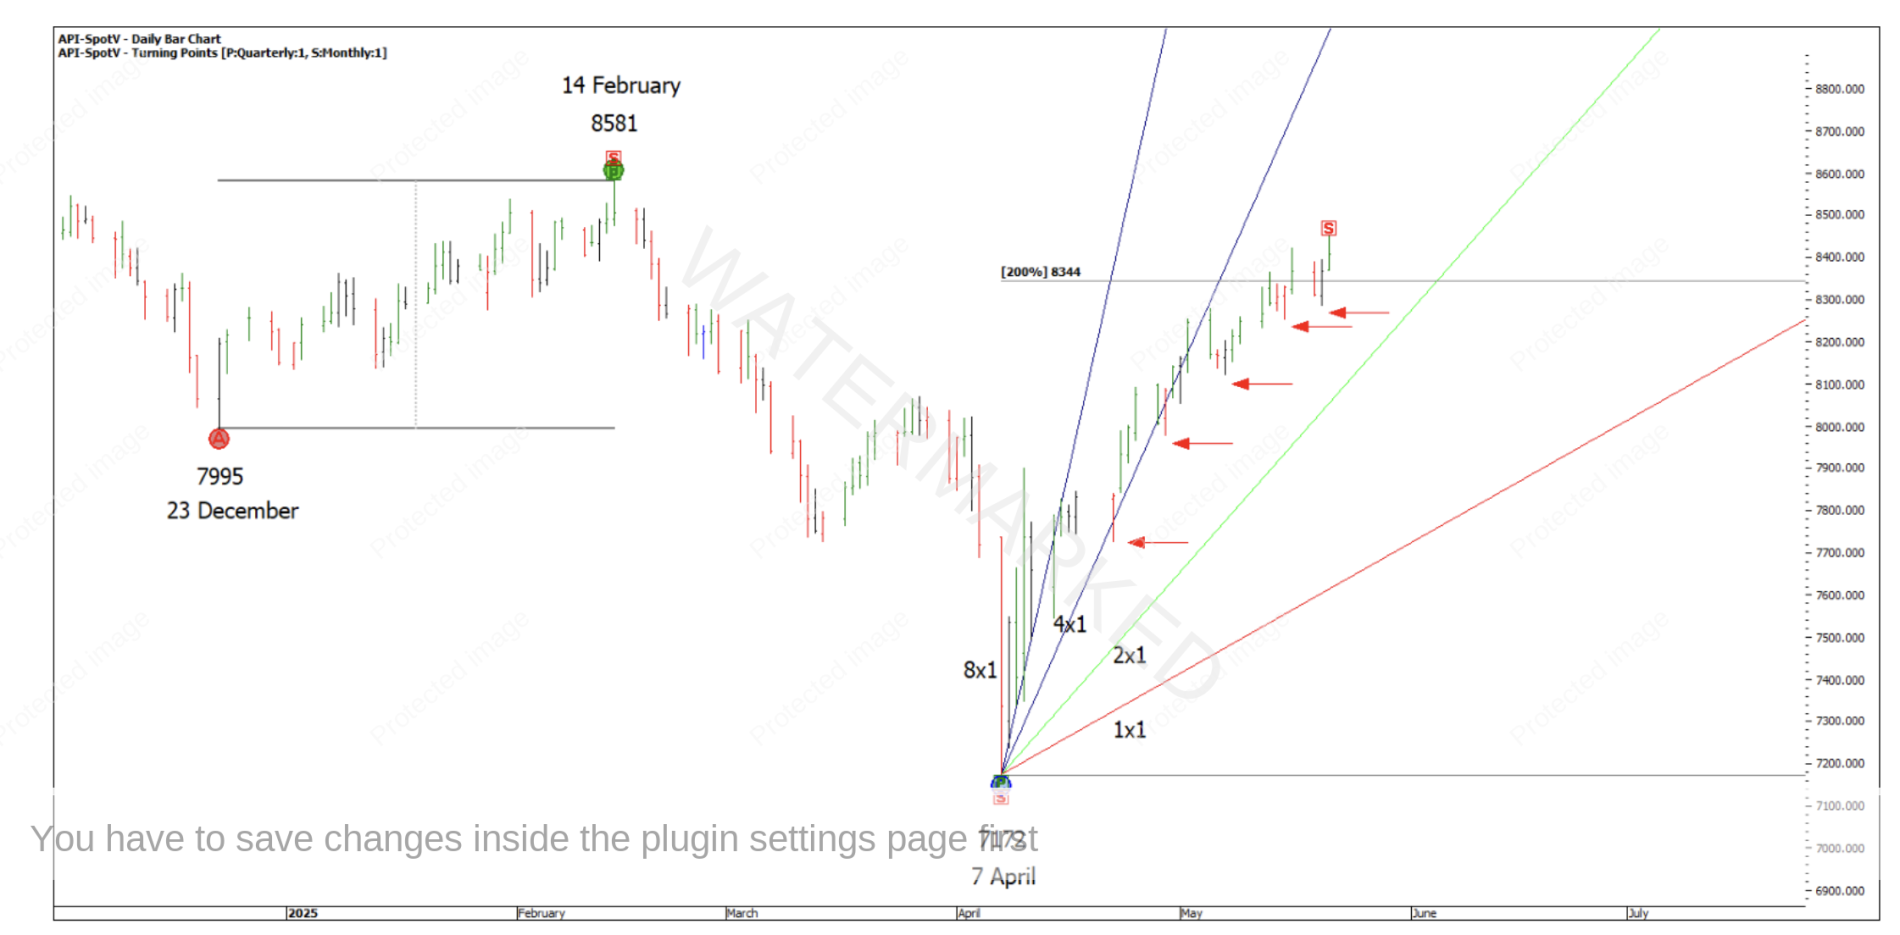
Chart 7
In these times of volatility and uncertainty I’m more than happy to let the market unfold and just prove to me what it’s doing, watching the angles, especially how it behaves around the 2×1 will be a key for me.
When the SPI puts in a weekly swing high, I imagine we’re then going to see a weekly B-C retracement to follow. To then target a possible Point C to look to get long out off would have you trading with the main weekly trend.
To leave you with something to ponder, it might be worth revisiting the market from 20 years ago to look for signs of similarity.
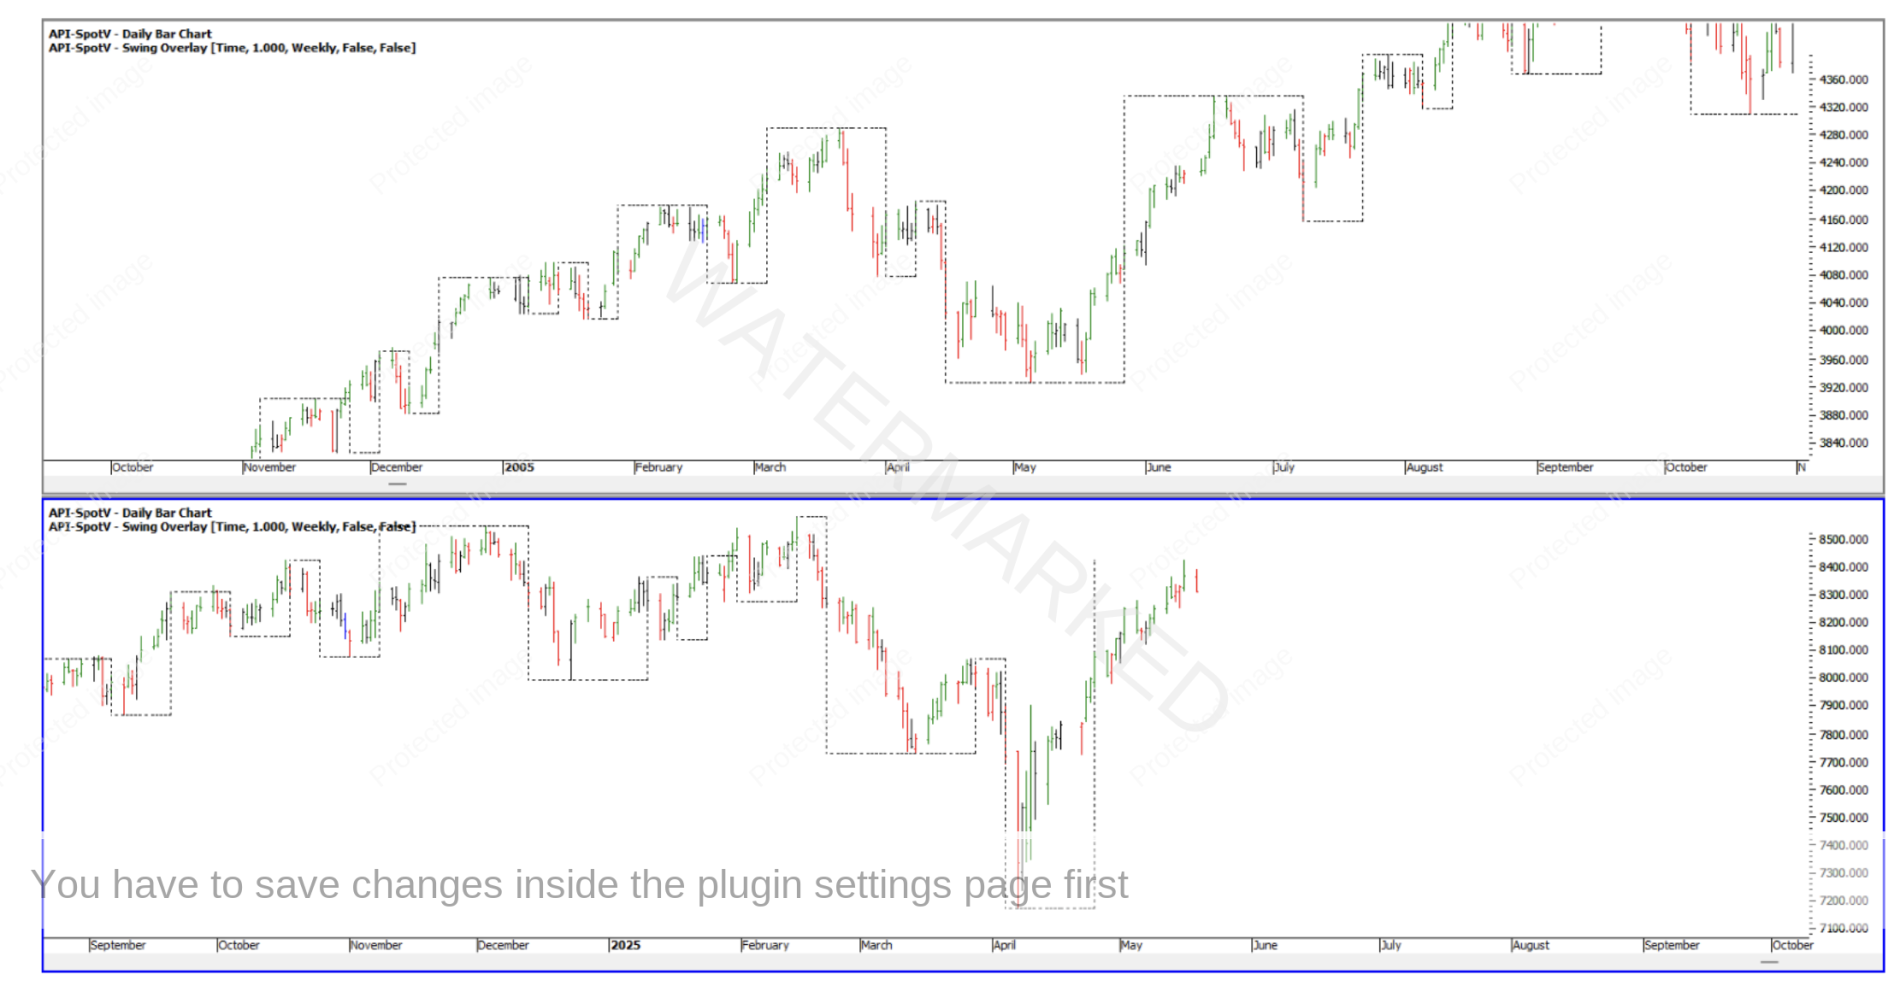
Chart 8
Happy Trading,
Gus