Major ABC’s – Price Forecasting
Today, let’s revisit a key Number One Trading Plan chapter…
Regardless of your experience as a trader, it is always a great idea to keep your foundations strong, and therefore reviewing the basics often is important. One area that should be of interest is the Price Forecasting section of the Number One Trading Plan. It seems that this chapter in particular often provides more insight every time it is read and applied to a new market.
By now you should have a very strong understanding of how an ABC Trade is completed by using the ABC Trading Plan. If we take this process of completing the ABC Trading Plan a step further and apply it to a bigger picture perspective (such as a weekly or monthly chart) we can start to analyse major ABC setups with smaller trading opportunities. This ultimately makes a price forecast or roadmap based on the position of the overall market. The benefit for this is to gather an understanding about where in the current market cycle we are placed, so we can then trade with the major trend.
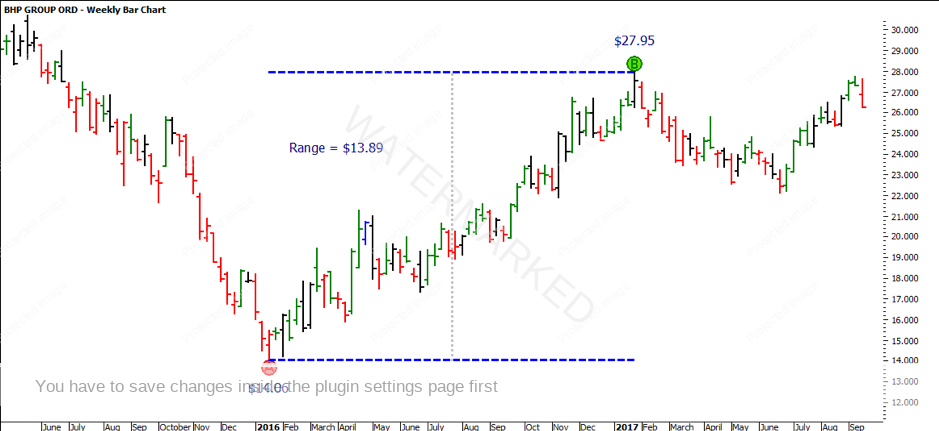
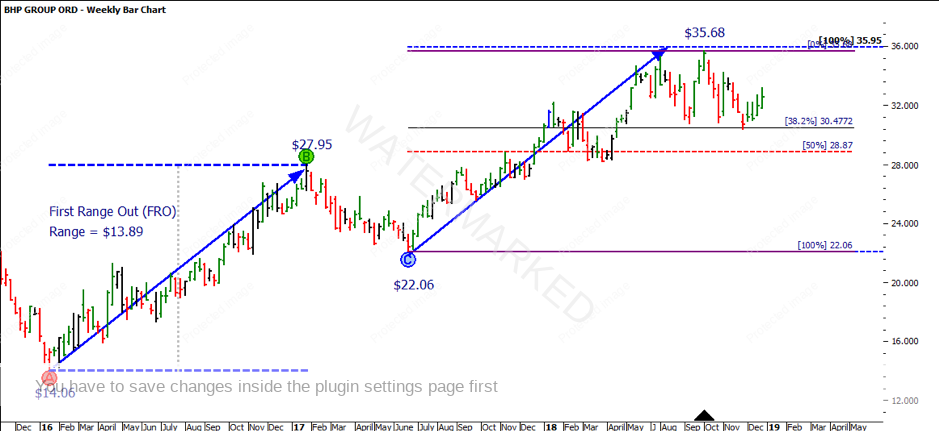
If we turn our attention to the weekly chart on BHP listed on the ASX (ProfitSource Code: BHP), we can start to apply a major ABC range in order to make a price forecast. Remember that Point A can be applied to any low. The major low in 2016 came in on 21 January at a price of $14.06, so let’s call this our Point A. If we apply Point B, to the next major top, on 25 January 2017 at $27.95 we can calculate our AB Range – just like we would in the ABC Trading Plan. We get a range of $13.89 ($27.95 – $14.06).
Please note that in this example we are not applying the ABC ranges to the swing chart. We are more so looking at the major structure of the market. Gann said to look for the three potential sections, which was similar to how David Bowden did it with the Share Price Index in Chapter Nine of the Number One Trading Plan.
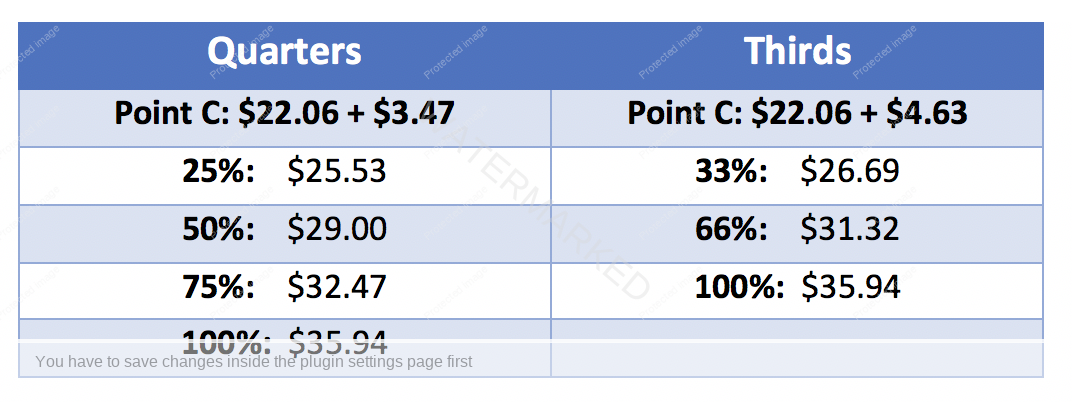
As we have the AB range, we can now break down our range into halves, thirds and quarters to generate our milestones. $13.89 divided by 4 gives us the quarters. Therefore, our quarter milestones of $3.47 ($13.89/4) can be added to the low of Point C, as well as our third milestones of $4.63 ($13.89/3).
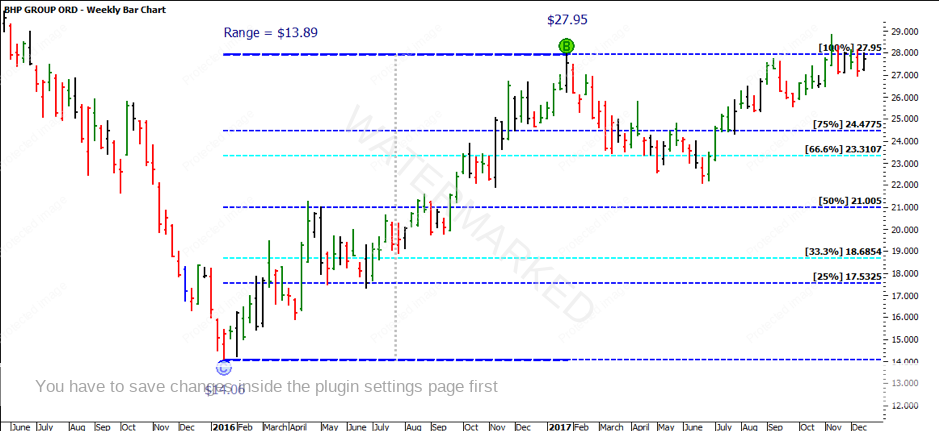
If we apply the Point C to the next low on 21 June 2017 at $22.06 we can add the quarters and thirds to the low to get our milestones, as you can see in the chart below:
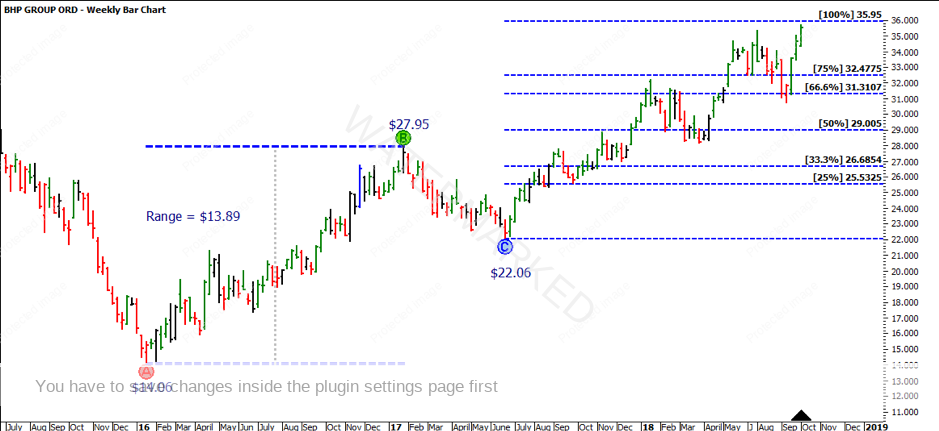
Based on the ABC trading checklist, we can call this market balanced as it has repeated 100%. It has also now produced another AB Range – this is Section Two of the bigger picture. When looking at our swing charts, we would now be anticipating Point C. We can put a ranges resistance card on the card to rate the strength of the market. As you can see from the ranges resistance card the market has pulled back approximately 38%. This makes it a strong market based
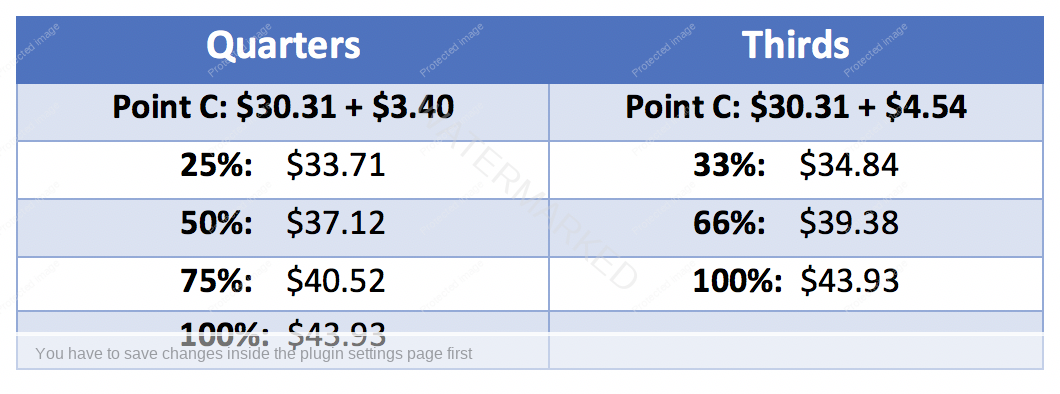
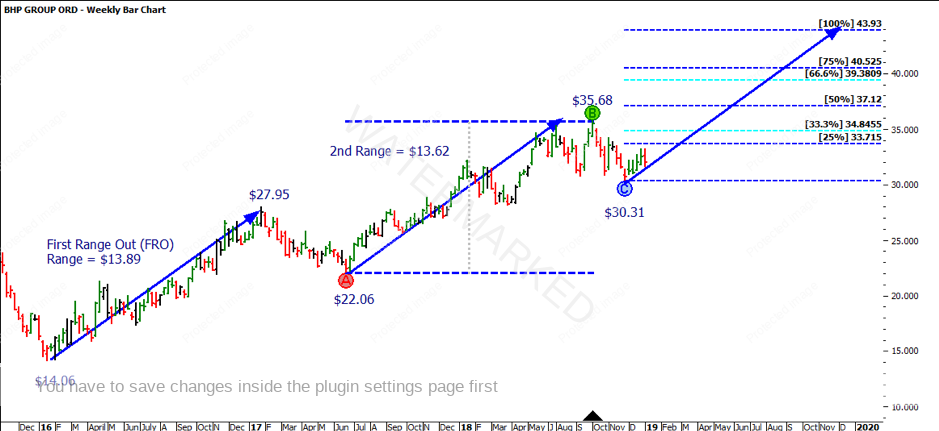
The AB Range for Section Two will start with Point A at $22.06 and Point B at $35.68, providing a range of $13.62. Again, we can now break down our range into halves, thirds and quarters to generate our milestones. $13.62 divided by 4 gives us the quarters. Our quarter milestones of $3.40 ($13.62/4) can be added to the low of Point C, as well as our third milestones of $4.54 ($13.62/3).
If we apply the Point C to the start of second three low on 28 November 2018 at $30.31 we can add the quarters and thirds to the low to get our milestones, as you can see in the chart below:
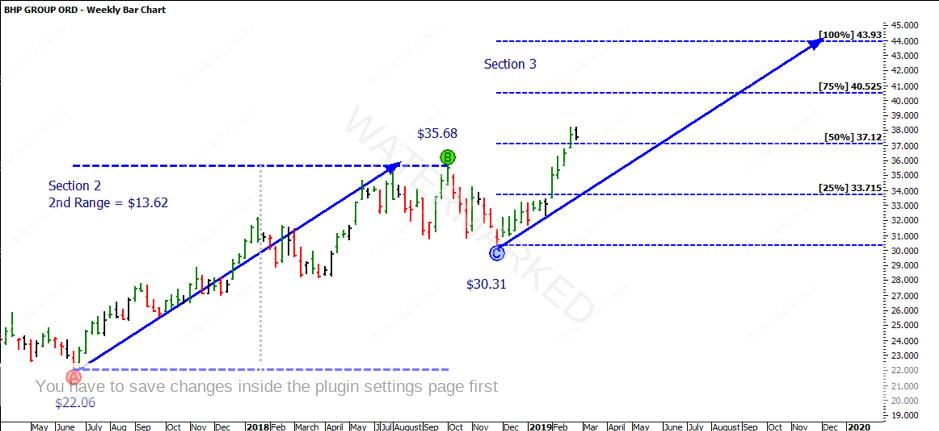
The current market action has recently seen the market break through the 50% level. Based on your roadmap chart, the market is more likely to fail at 50%. It will be well worth keeping an eye on the market to see if there is any further analysis going for this level. The market might find itself retesting the old tops before making this a new bottom.
As David likes to remind us, don’t be anticipatory stupid. Make sure you have a well-structured plan so that you can look to take advantage of the potential moves to come.
It’s Your Perception
Robert Steer