Make It Your Own
Welcome to July’s edition of the Platinum Newsletter. As I update my hand charts for the week, I’m always impressed by the extra details I pick up that I just don’t see when I rely solely on
Saved Chart Pages in ProfitSource.
That being said, I’ve learnt over time that I just can’t handle too much on my charts before it gets too messy and confusing. So the purpose of this month’s article is to demonstrate how I’ve gone about making some of ‘this stuff’ my own by adding in another way of dealing with time.
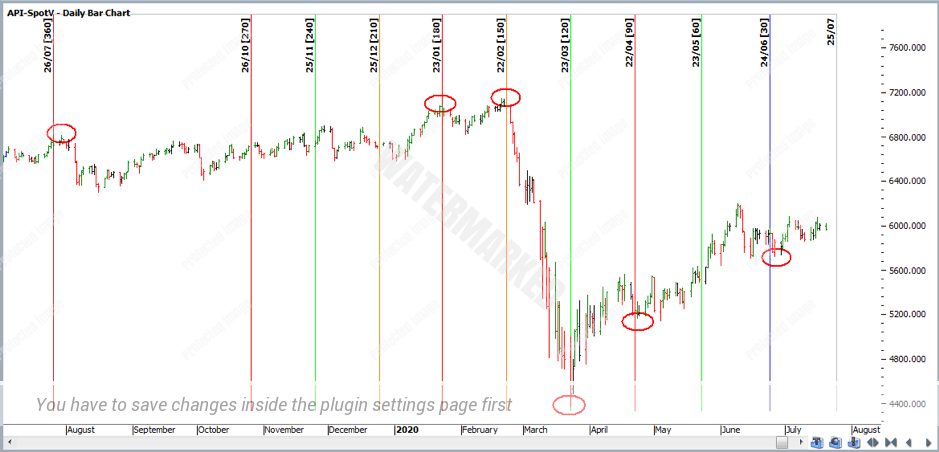
On page 19 of the Ultimate Gann Course, you’ll find the introduction to ‘Balancing Time’. This is the practice of running counts from a low to a high, low to a low, high to a low and a high to a high so you notice when times balance. Although there are only so many markets you can keep track of by hand charting, how do you keep track of other aspects of analysis such as balancing time, interim time frames and Time by Degrees for example? Saved Chart Pages is the obvious one, but I’ve also found having a few ‘trading calendars’ hanging above my computer has been very helpful to keep on top of things. No doubt as time goes by, the way we all do things may change or develop slightly, but for now, I like to see dates that are listed on a calendar that I can stare at during the day. I find this another great way to keep on top of the up and coming time clusters. Looking at my calendar, the next time cluster I see on the SPI looks to be approaching soon around the 25th to the 29th of July.
30 degrees from the 26 June low = 27 July
90 degrees from the weekly First Range Out failed Re-test = 25 July
120 degrees from the 23 March low = 25 July
150 degrees from the 20 Feb top = 23 July
180 degrees from the 23 Jan top = 25 July
1 year anniversary from 30 July 2019 top = 29 July
The 25th is a Saturday so Friday the 24th to Monday the 27th could be worth keeping a close eye on. Keep in mind that the 28th of the month was the date that David said was his ‘rouge day’ and a day to watch for turns.
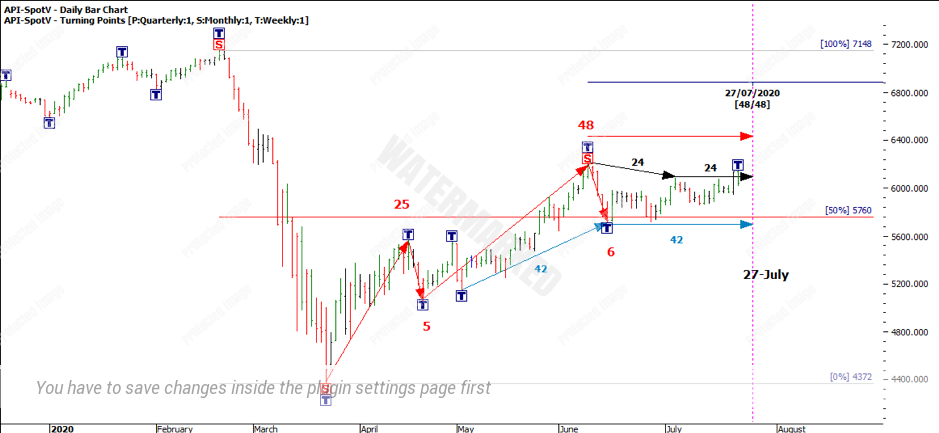
The next thing my calendar tells me is that on the 27 July, there is a minor balancing of time of 48 days. As I update my interim time frames, I see more minor time frames balancing out on the 27 of July. 48 days, 24 days and 42 days.
These are minor time frames and I feel it’s unlikely it’s going to produce the yearly top or bottom, especially considering the current narrow sideways trading range the SPI is currently trading within. However, having the right process in place to be on top of your time and price clusters will definitely work to your advantage! Personally I would like to see the market produce a low around this time then rally and break out of the sideways range and give some more upside. However, the market just doesn’t care what I ‘want’ it to do and can frustratingly do the opposite! Therefore having a few scenarios thought out will prevent me from ‘falling in love with my forecast’.
Now that I have identified a time cluster, I’ll be looking at Price Forecasting and form reading to decide what to do next. I’ll look to my analysis plan and if it ticks the boxes and I can expect a high reward to risk ratio, then I move to phase two and look to execute a trading plan.
Happy Trading
Gus

