Market Themes
Market ideas are constantly changing in the minds of the big money managers, as they look to areas of markets that are overvalued / undervalued, insulated from headwinds or can benefit from events like COVID and increase their market share or profits. Most years we could have half a dozen strong market themes we can watch unfold and deliver tradeable ideas for where we sit on the trader ladder. In most cases those reading this article are surfing the waves of market momentum that are created by governments, central banks, and major industry/funds.
2022 has delivered in the first 5 months enough themes to have us ready for a break from all the activity. 2022 has seen COVID move to a low-level theme as firstly inflation, then the war in Ukraine dominated the news which has produced a great deal of uncertainty and in many cases shorting opportunities. We could then throw in the shift in crypto as well as hard currency as another abundant area of ideas to profit from.
The reason I discuss this is that I see a lot of confusion in traders around what to focus on and how best to harness uncertainty in their own trading world. In my day-to-day commitments I get to engage with many professional money managers and traders alike, they are all a bit distracted as they try and find the next theme to be on or off so to speak. They are invested in the outcome of the theme not just riding the moves for a return and this can detract from the process of implementing a trading plan. I wonder how many of you have different asset classes in your stable of markets that you know like a cow knows its calf. The Smarter Starter Pack teaches us to look at a stock, stock index and a currency as three separate markets to follow. We could also add a crypto, commodity and maybe some bonds as well to the mix to ensure we are ready for a move somewhere, as 2022 has delivered significant opportunities to trade for a return not being correct on a theme.
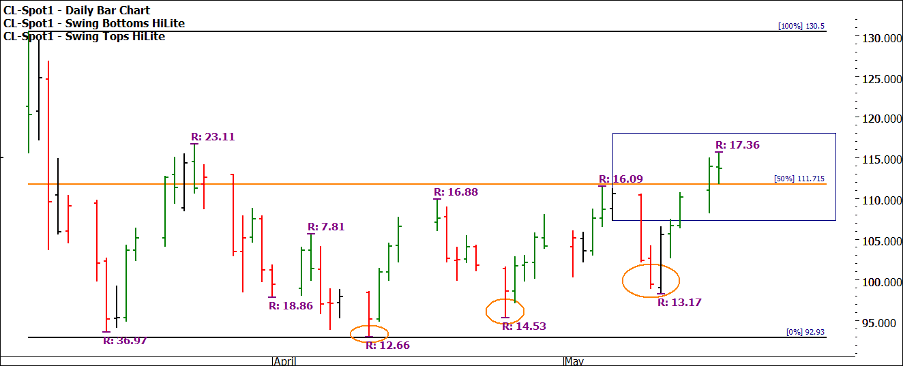
In the April edition of the newsletter for Platinum students I discussed a short trade on oil in what was a sideways market on the bigger picture. I am now watching to see what happens in the near term as we have seen higher bottoms and a recent break of the 50% of milestone.
Chart One shows the swing ranges on the 2-day chart and the price action for the last two sessions closing above $111.72.
Chart 1 – Daily Bar Chart CL-Spot1
The most recent low in crude on the 11th of May signalled with a large outside reversal day, this aligns with energy themes we are seeing, especially in Europe.
Setting your own expectation of what is ahead for your market rather than reacting to the news that we are constantly connected too is challenging. As students of David’s time-based courses, you are challenged to disconnect from the opinion of pundits and generate your own road map. For any serious traders of oil, you would have already created a road map of potential turning points for 2022. Once you have learnt and practised the techniques, the process of setting up for the year ahead is straight forward.
For a jump start on how to do this, I would remind you of the great work that Mat did in his webinar on road maps – History Repeats.
Using one technique of road maps that Gann and David used is Master Time Cycles. Using the big blocks of 5 year and 10-year cycles (then multiples of i.e., 15, 20, 25, 30, 35) we can see that June may be an area to watch for crude to break step from its current rhythm. If we saw June /July deliver a significant reaction, then this could fold into some areas I am watching for in 2023 but let’s not get too far into the future.
The interesting aspect of the increase in commodity prices in 2022 has been the fact that the US dollar broadly has been increasing in value. Typically, the increase in US dollar value would see commodity prices decline, however, as we experience energy shocks like we are seeing currently, that relationship can decouple. We are seeing a more traditional relationship in the dollar and precious/industrial metals. Gold, silver, and high-grade copper are all heading south in line with a strengthening US dollar.
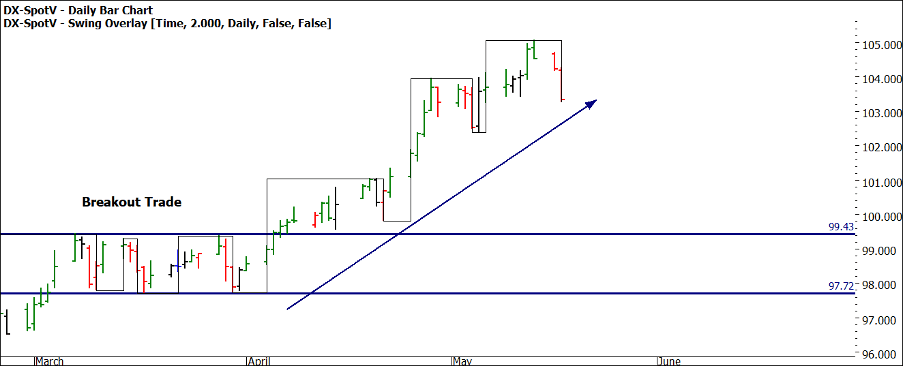
Chart 2 shows the US Dollar index in recent times, the long side of the trade has been profitable after the breakout (consolidation period in March /April).
Chart 2 – Daily Bar Chart DX-Spotv
If you believe this trend is strong and will continue, then the potential for setups in metals may continue.
Our other asset classes might include a single stock and a crypto currency. After such a heated run up in tech stocks from 2020-2021 any sort of theme that unbalanced that picture could have led to returns.
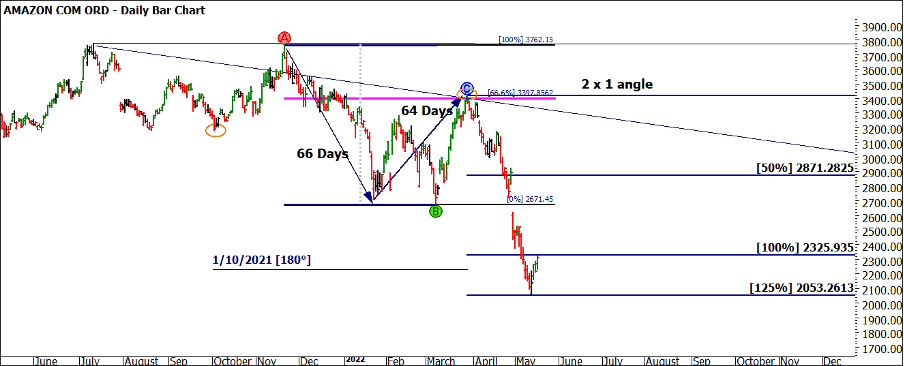
Chart 3 shows Amazon (AMZN), a company we are all familiar with. Some basic price and time work delivered a time and price setup for early April that has delivered an excellent Reward to Risk Ratio. The setup combined some price (retracement and extension work), some time (66 days down and 64 days up), and some Time by Degrees (180 degrees back from 29 March 2022 top was the October 2021 low).
Finally, some 3rd Dimension angles from the All-Time High in 2021 and you have a high probability setup. You should recreate this setup in ProfitSource and then apply your trading rules to calculate what Reward to Risk Ratio could have been achieved.
Chart 3 – Daily Bar Chart AMZN
There is a significant shift in economic attitudes and what businesses will thrive in the next 12 months. The election in Australia is just another of them that will capture the imagination of markets and generate trading opportunities, my aim is for you to feel comfortable to disengage from the traditional shackles of what the group is thinking, especially in uncertain times as we are experiencing.
Be brave in your thinking, set big goals and work hard to achieve them. There has never been a better time to trade for those who are clear headed and organised across their chosen markets. It could be time to branch out, especially if your prime market is uncertain.
Good Trading
Aaron Lynch


