Market Uncertainty
As we push closer to year end, with another calendar year nearly over, time seems to speed up and no doubt we will be talking about the new year and all that brings. New goals and adventures await and of course market opportunities. We are currently seeing all the major market movers appearing on the horizon: we have had the pandemic, inflation, and now human conflict. A stage that sets for all manner of market moves. As hard as it is to maintain focus, it becomes critical to have good habits and routines to allow the process to be as easy as possible.
I continue to focus on the finance sector in the US and have done so for several cycles now as financial stocks can swing wildly in volatile times which we are seeing, so being close to the majors will always produce signals. The DJUSN was poised for a make or break moment in last month’s article. September seasonal time was looming, and the overarching theme has been the orderly moves and how they have responded to 50% pullbacks in price. We must remember the simple rule that support becomes resistance and old tops can be come new bottoms and vice versa.
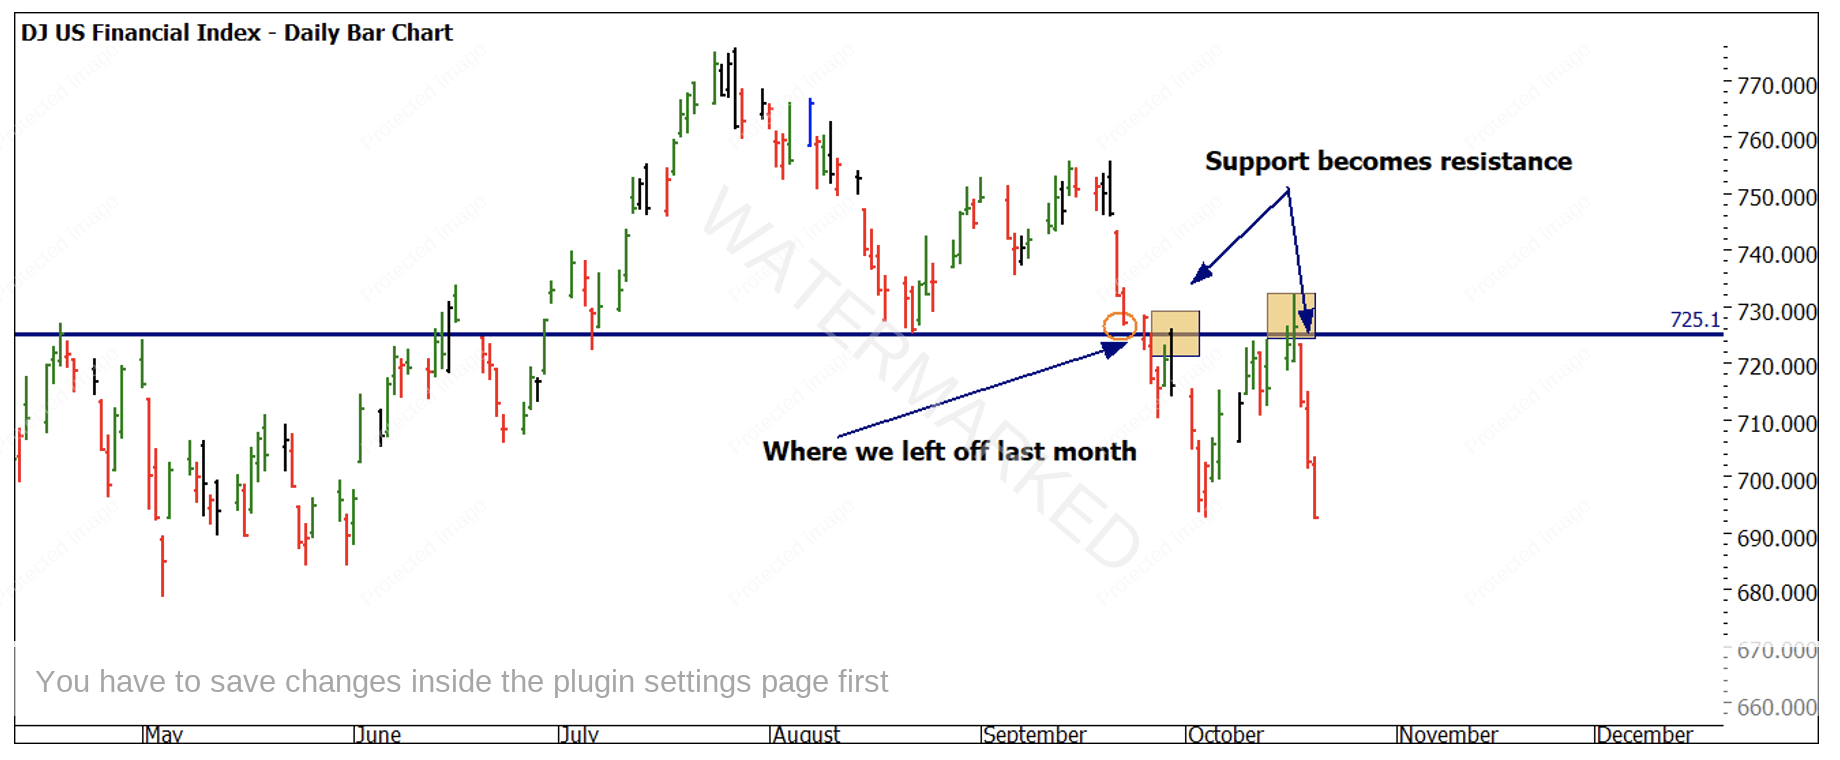
Chart 1 shows the DJUSFN and its failure to hold support, the beauty of having pressure points in price and time is if they hold or don’t, we have the options to look for signals. In this case the support around 725 became a small double top and resistance. There were also first lower swing top opportunities under that level with signal days i.e., outside day.
Chart 1 – Daily Bar Chart DJUSFN
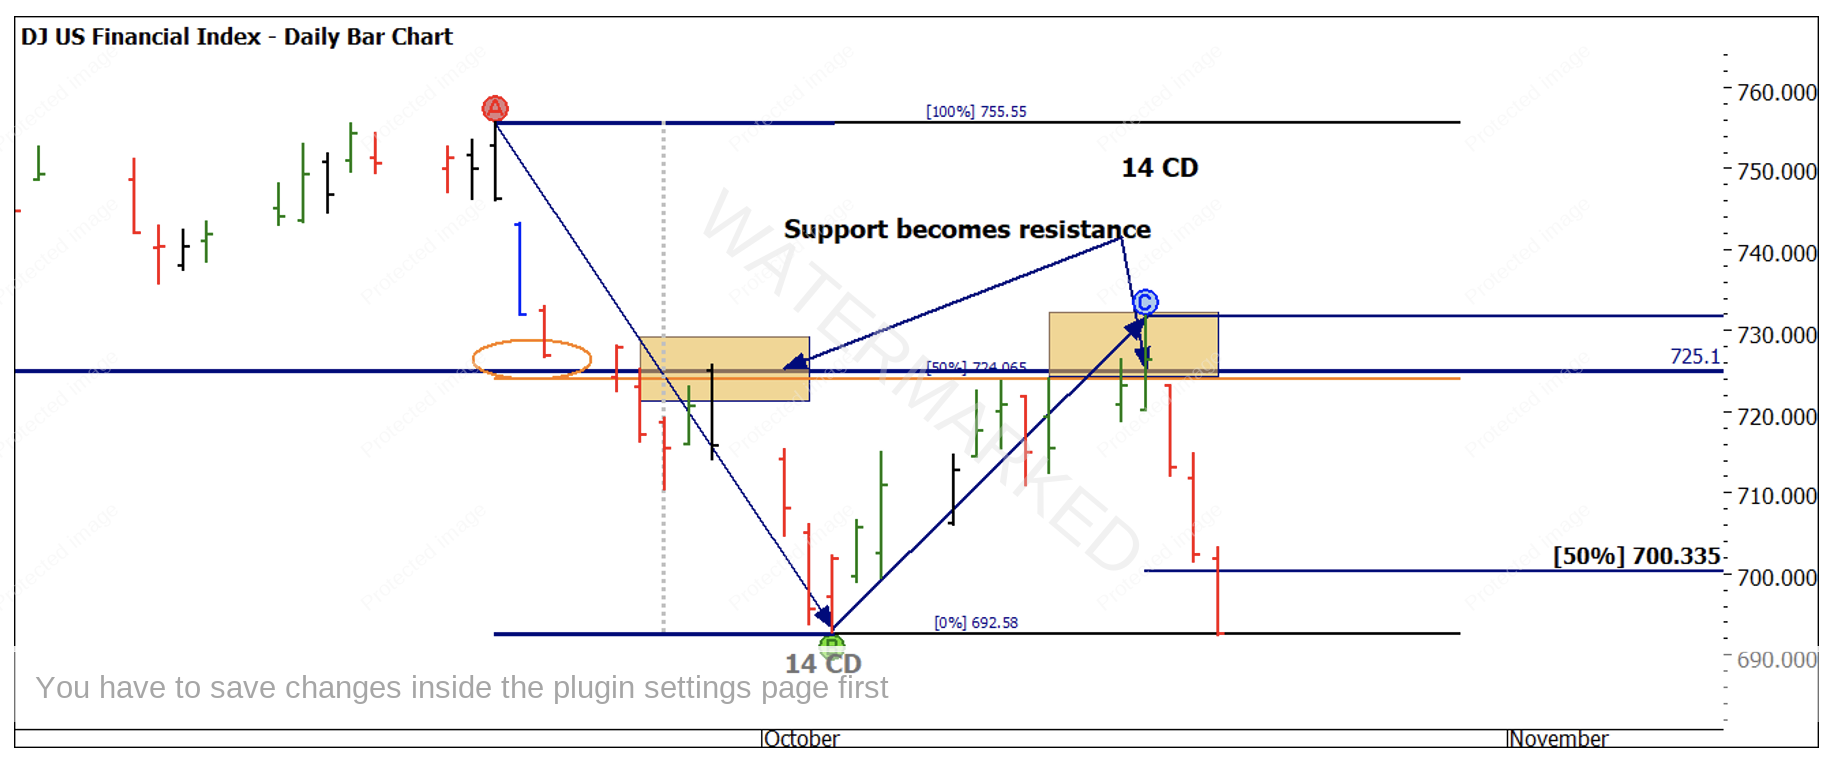
If we zoom in, we can see the Wheels Within Wheels. Chart 2 shows the symmetry of price and time with a balanced larger picture ABC point with 50% retracement. The nice element is also the calendar days repeating, 14 days down and then up to meet the 50%, resistance was found at the old bottoms.
Chart 2 – Daily Bar Chart DJUSFN
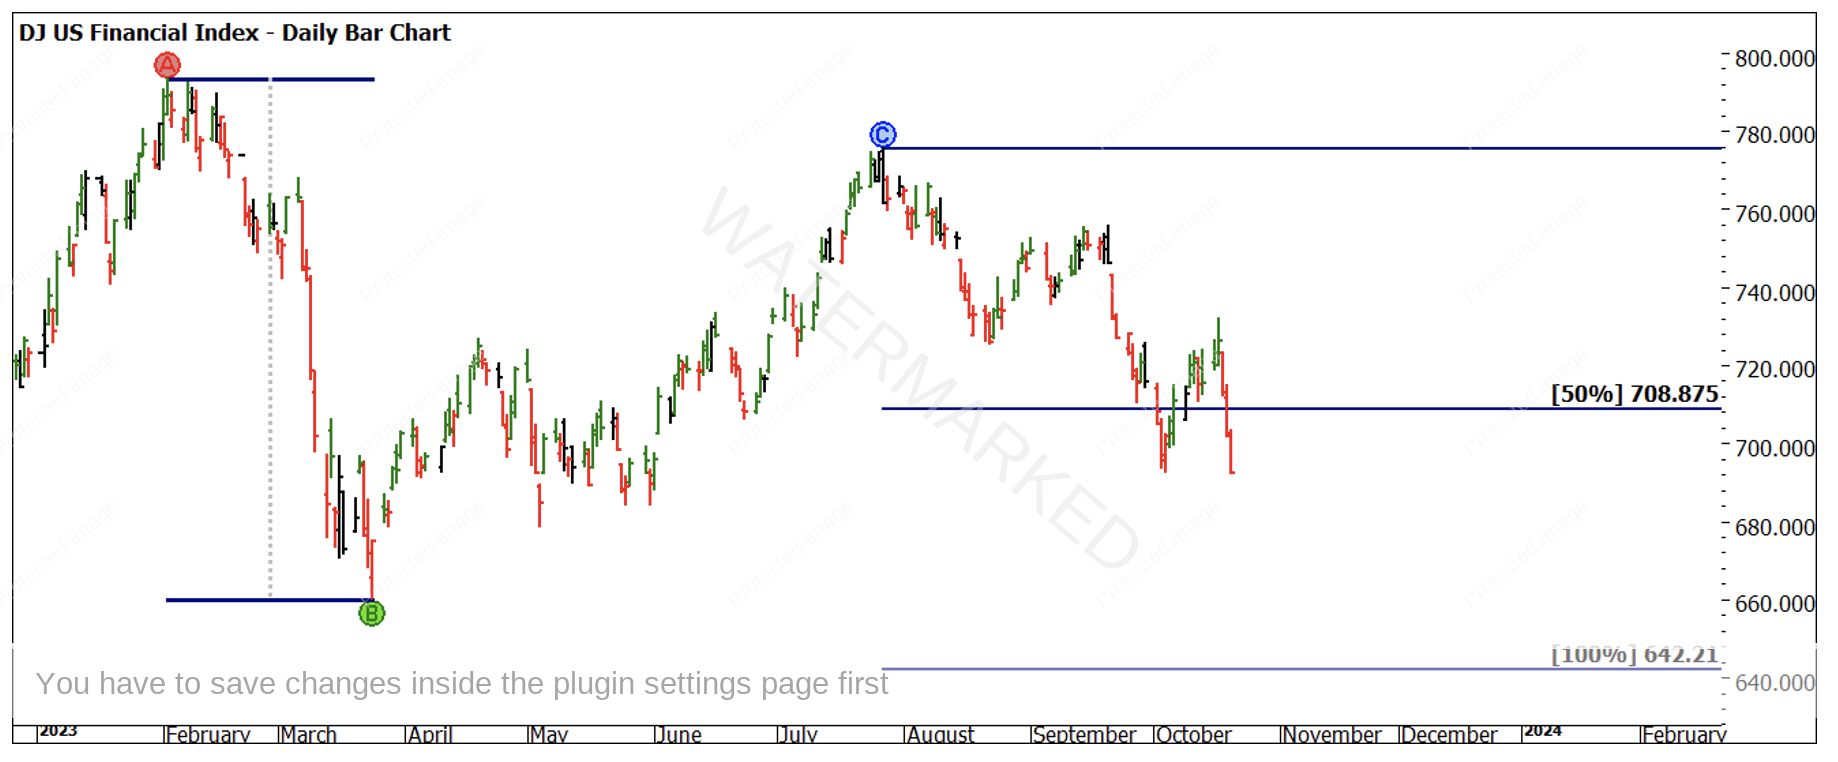
If we are of the view that there is further downside to come, we can step back to see the last major range down and track the current move for reference. The price action is comfortably below the 50% and if a 100% repeat was to occur, would provide a reasonable opportunity for reward. Risk can be managed in variety of ways. Mastering swing trading is a must, and I would encourage you to join Mat at his upcoming Swing Trading Mastery webinar on Saturday, 2 December.
Chart 3 – Daily Bar Chart DJUSFN
A reminder that many stocks make up this index and one of the top 10 constituents is Morgan Stanley (MS.NYSE).
Chart 4 shows the big picture price points I have been following. The main range is from the 2020 Covid low at $27.20 and the 2022 high at $108.80. Applying a Lows Resistance Card (multiple of $27.70) we can see that $81.60 is 3 multiples of that price.
$81.62 is also the 33% retracement of that Ranges Resistance Card, so with multiple bottoms on this cluster, a break of that level could be seen as weakness.
Chart 4 – Daily Bar Chart MS. NYSE
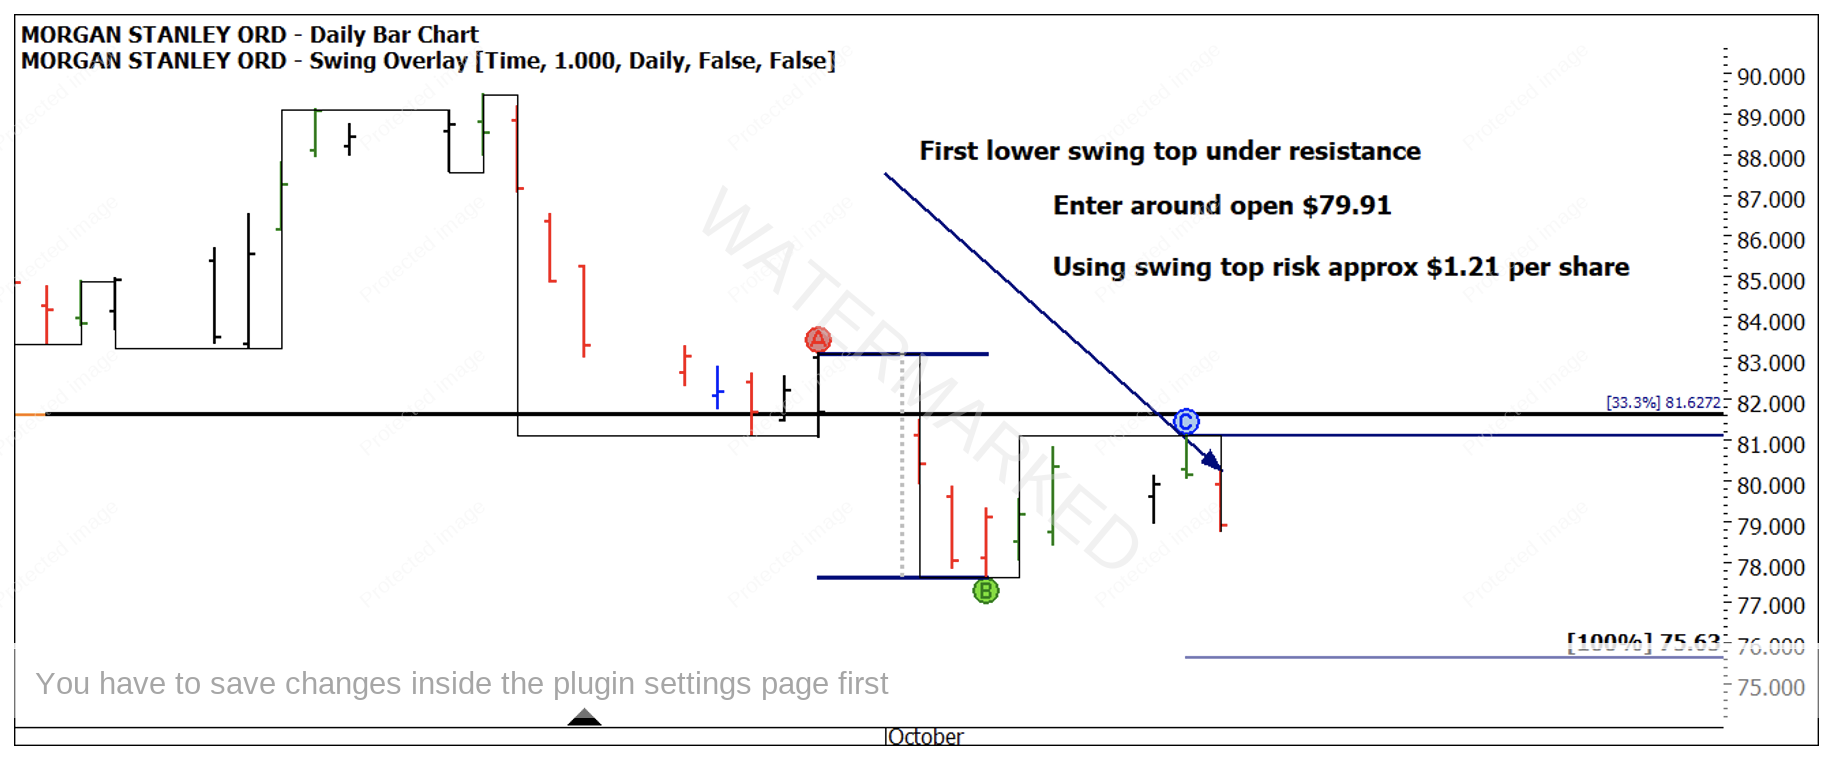
Let’s zoom into the smaller picture, a lower swing top was confirmed on the 11th of October. Aligning our view with a broader index does often mean we have to show patience for the underlying markets to provide signals. This speaks to the value of habits and routines to ensure that you are not missing the setups.
Chart 5 – Daily Bar Chart MS. NYSE
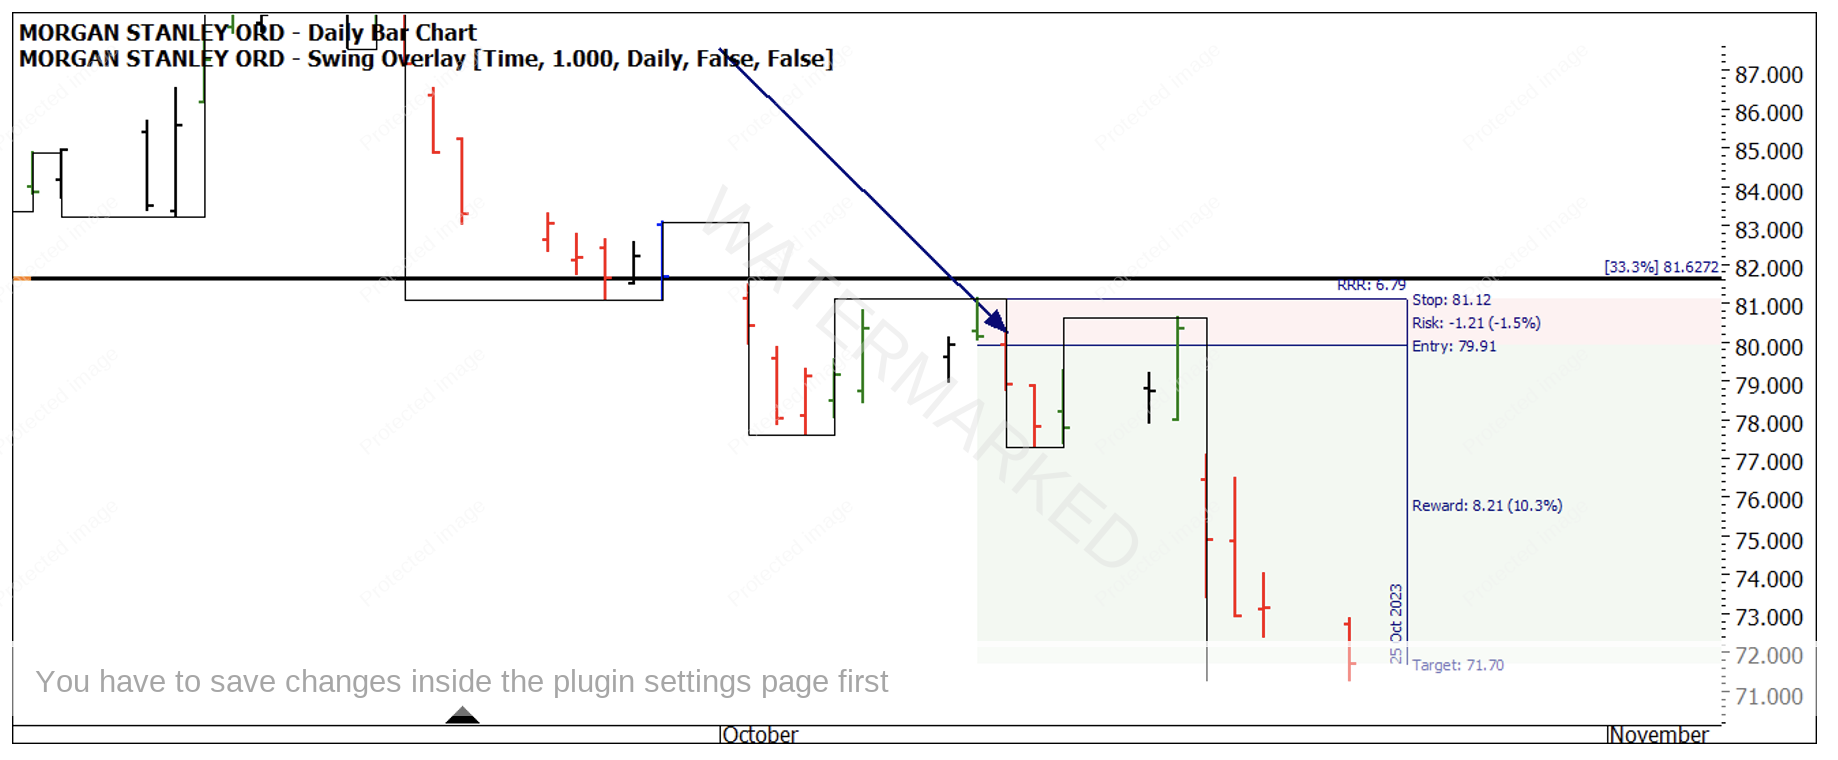
Chart 6 brings us up to date on the current price action. After entry, the market moved against the short position and again relied on having some patience to get moving. Last week saw a bearish week and a drop of approximately 10% of the stock’s price.
Chart 6 – Daily Bar Chart MS. NYSE
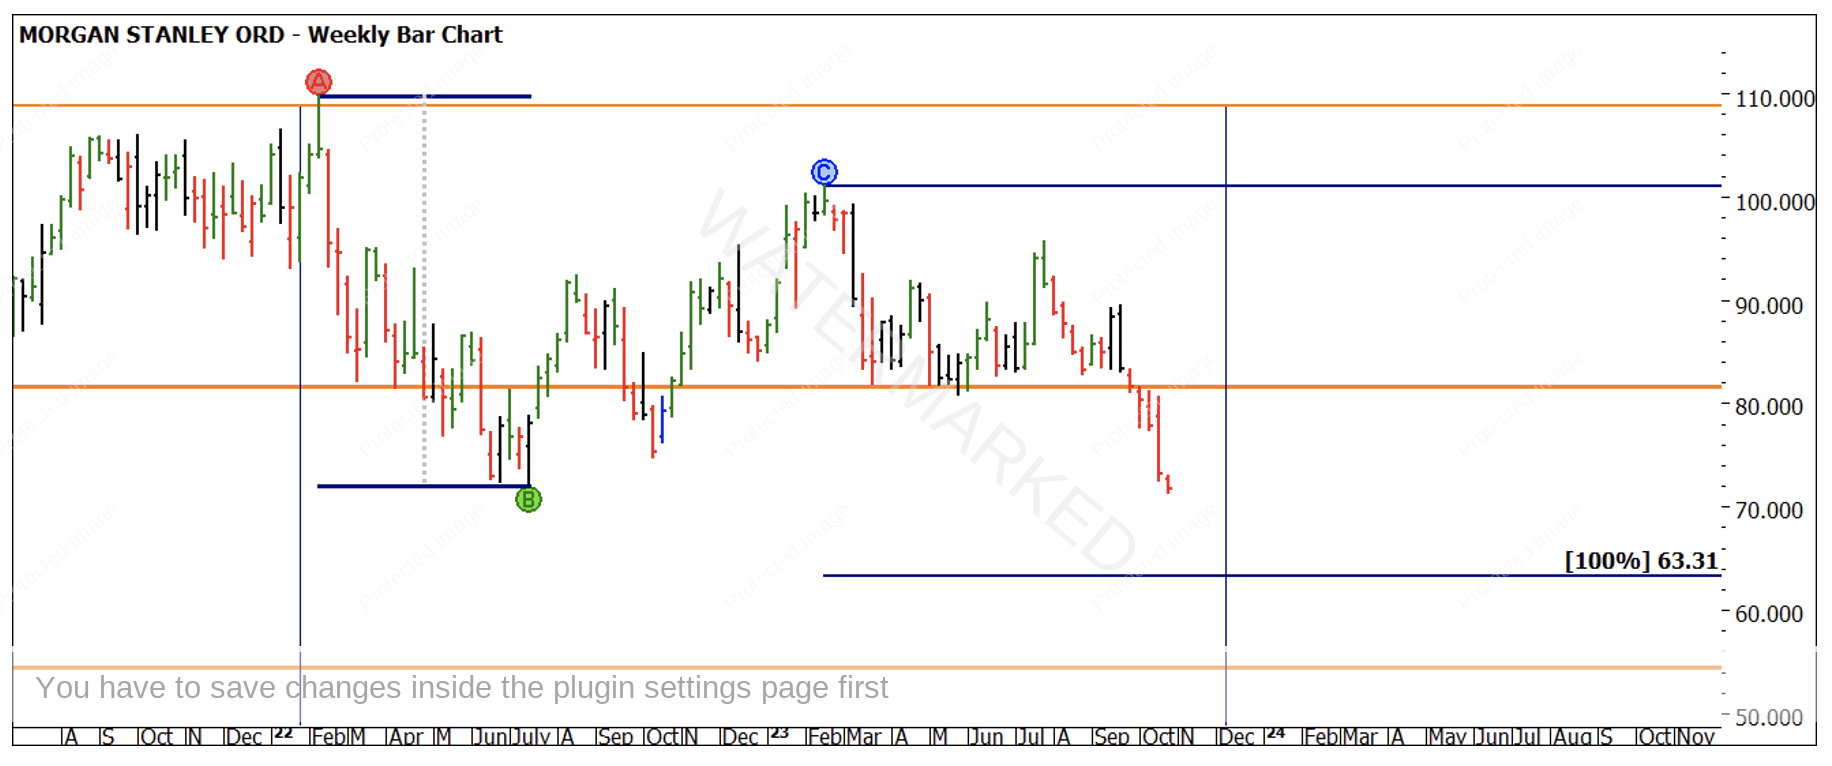
Trade management now becomes the key narrative, but to define a downside possible target I have included Chart 7. This is a simple range projection of the 2022 bearish range applied to the February 2023 top. If we were to see a 100% repeat, then a downside target of $63.31 would be an area to watch for.
Chart 7 – Daily Bar Chart MS. NYSE
It would be a good exercise to see what price clusters you can define around that area.
Good Trading
Aaron Lynch
