Market Are Not Rational!
Volatility has returned to the markets, with equities getting spooked about a possible second wave of COVID-19 and all that would entail. There is much conjecture and opinion combined with what can be argued as a disconnect from fundamentals. As the title suggests, markets are not rational, but they are correct. As much as we can disagree with the price and valuations that markets are trading at, we cannot argue that the price is what it is.
If we looked at countries based on their COVID-19 cases and closeness to returning to our pre-COVID lives, we could look to our cousins across the ditch in NZ. They have been the gold standard for how they have recovered with zero cases for some time and the return to normal conditions. It makes sense the borders remain closed; if I lived there, I would not want it to revert to panic and fear, so relying on their isolation and island geography they can keep the virus at bay.
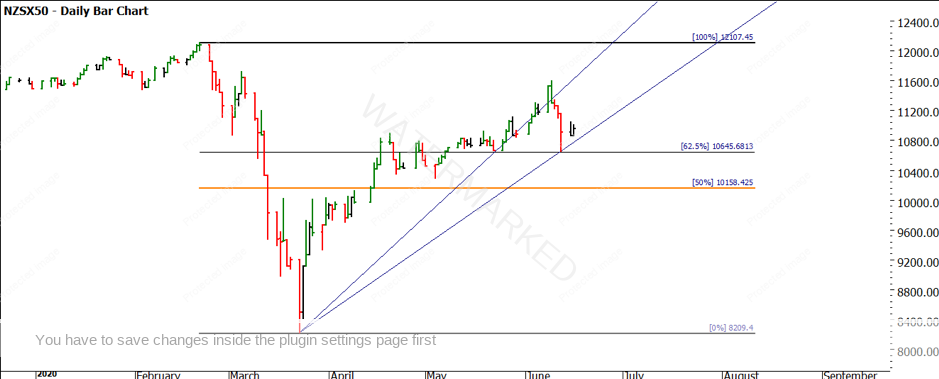
If we check the chart of the NZ market based on perception and virus recovery the index price should be strong and getting stronger. Chart 1 shows that the NZ50 index has rallied quite well after the dump we saw in March. The price action has landed back on the 37.5% retracement and the trend overall looks intact.
Chart 1 – Daily Bar Chart NZ50
We can compare this to all the major index markets around the world as I have shown previously. We will continue to focus on the SPI200 and the Nasdaq. If we looked at the fundamental backdrop of both these economies and countries, we are told that a severe recession is around the corner and the US deaths and cases of coronavirus keep climbing to the tune of 20,000 new cases and a death toll of 425 for yesterday. By any measure, these numbers show this crisis is still ongoing but if we look to the Nasdaq chart we see a different mood.
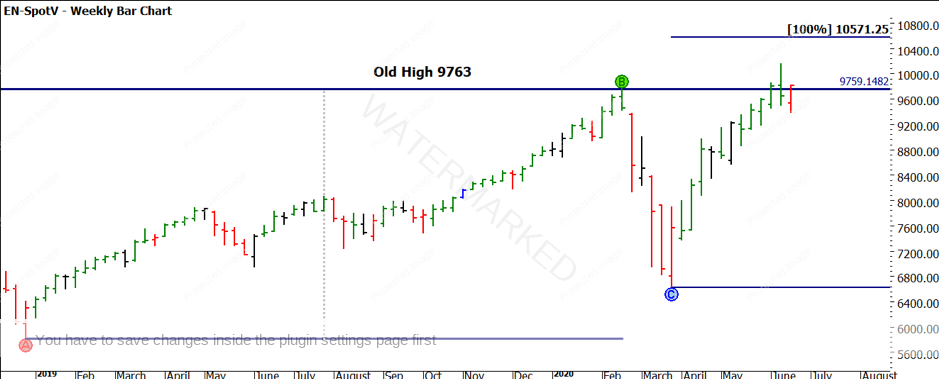
Chart 2 shows the run from the last cyclical low in 2018 up to the old top of 2020, followed by the new highs that have been recorded just last week. If we use that range in price (A to B) we can see that the market is nearly at 100% of that range.

Chart 2 – Daily Bar Chart Nasdaq
What is astonishing is that the previous run took 421 days to move 3942 points, while the current COVID-19 recovery has been 3,527 points in 79 days. The point is, markets can be completely irrational when compared to what they should and could do, again the only truth is the current price. Gann used to talk about leaders and laggards in his materials and we could view the Nasdaq as the leader. He had some lessons around what to watch for when the darling falters as it can be a sign that the rest are about to change direction.
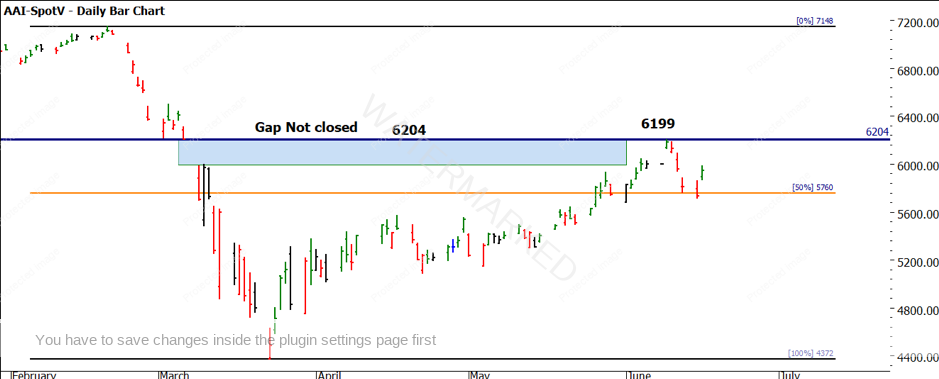
If we look back to the Australian market based on COVID-19 clues, we are probably somewhere between NZ and the US in terms of outcomes. Our price action is lagging around the 50% level and of interest to me is that the gap I wrote about earlier this year at 6,204 has not yet been closed, the recent high was 6,199. This is shown in Chart 3 below.
Chart 3 – Daily Bar Chart SPI200
I would be hard-pressed to offer better examples of why charts to me can cut through the uncertainty of all the other noise that exists around markets and their valuations. If we applied basic accounting metrics to many companies, we could argue that the future is not so rosy, but their stock price continues higher so what to do?
To remove the uncertainty of various opinions you must develop a method that will allow you to keep your head whilst others are losing theirs. The current price movements are generated by the mob, be that the retail investor, super fund, professional trader and all the rest. You can disagree that the markets should be trading at these prices but again they are, so the mob in a sense is always right, even if the account balance will not always reflect this.
What you can be doing now is ensuring you can stay with the trend. By selecting minor and major trends and trading within sympathy of those you will be a lot safer. This is a key focus of the new Active Trader Program Online Training, so be sure to sign up for your free demo account and check it out! Now is also a time where volatility and average daily ranges are increasing, a sure sign that something is on the boil in markets. I like to think of it as the disagreement between participants getting louder. Reducing position sizes and risk percentages may seem counter-intuitive during volatility, but it may help you hang into positions you may not otherwise feel comfortable with due to the point ranges.
If you can build skills and a robust trading plan that sees success in times like this, imagine how good it will be when the easier times return. Market history is being written every day and this will be a period traders in the future will attempt to study and pull apart and understand the lessons from. You are already one step ahead as long as you invest the time right now.
Good Trading
Aaron Lynch

