Market’s Wobble
Here we are already pushing into mid-February and 2022 is starting to escape the malaise of 2021 with global COVID impacts lifting in some areas and being tightened in others. From what I am seeing here in Australia, there is a vast difference in perspective depending on what circumstance the individual finds themselves in. This of course is only natural but given the fragmentation of media and in turn the delivery of information, there can be vast differences between different streets in the same suburb.
This leads to an old theory of how a person is an average of the five people they interact most with, indeed, I find when I interact with successful humans then my outlook on success is increased. The opposite is also true, and therefore we must be very careful on our take of markets if we are to listen to the “noise” of the media, people and what sells clicks on the internet. This all ties into the theme we are seeing of an overheating global economy, inflation tearing away, interest rates launching to the moon, the end of social media stocks, war in Eastern Europe. Throw in some sport which I would generally argue should be less polarising and we have the Australian Open Tennis saga and ice the cake with the Winter Olympics, and we could all be forgiven for feeling ready for a holiday in mid-February.
A quick check of January shows a negative sentiment to stocks, and we saw many of the tech darlings take a whack. Facebook, Google, Microsoft, Amazon and Tesla are all heavy hitters and in turn they are all lower when compared to the start of the year. In last month’s article I discussed a price cluster around 15000 that may come into play on the Nasdaq futures. Well, that price was easily pushed through and the sentiment driving the above stocks had much to do with that.
If we just looked at headlines and news feeds, there was a large bearish sentiment. This may still be the case further into 2022, but I have never been more committed to the concept of switching off the news on markets and focusing on the charts. Markets will do just enough to keep the majority off balance and hence the masses when trading on shorter time frames don’t all succeed.
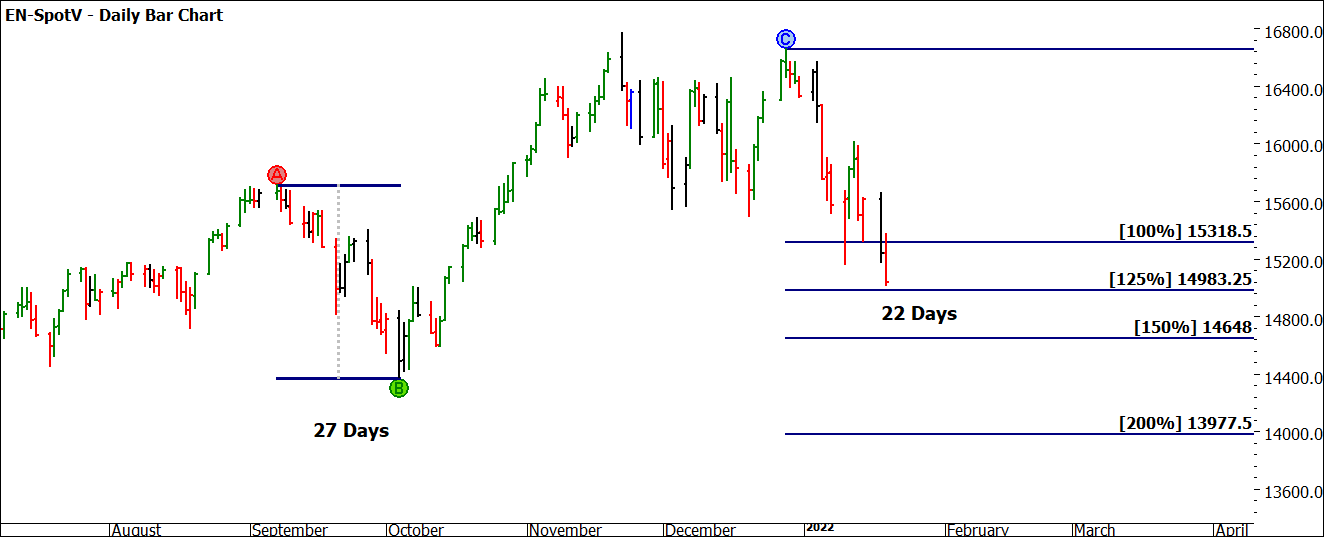
Chart 1 shows the chart I outlined in January. The range had run 125% of price but was about 75% in time.
Chart 1 – Daily Bar Chart EN-Spotv
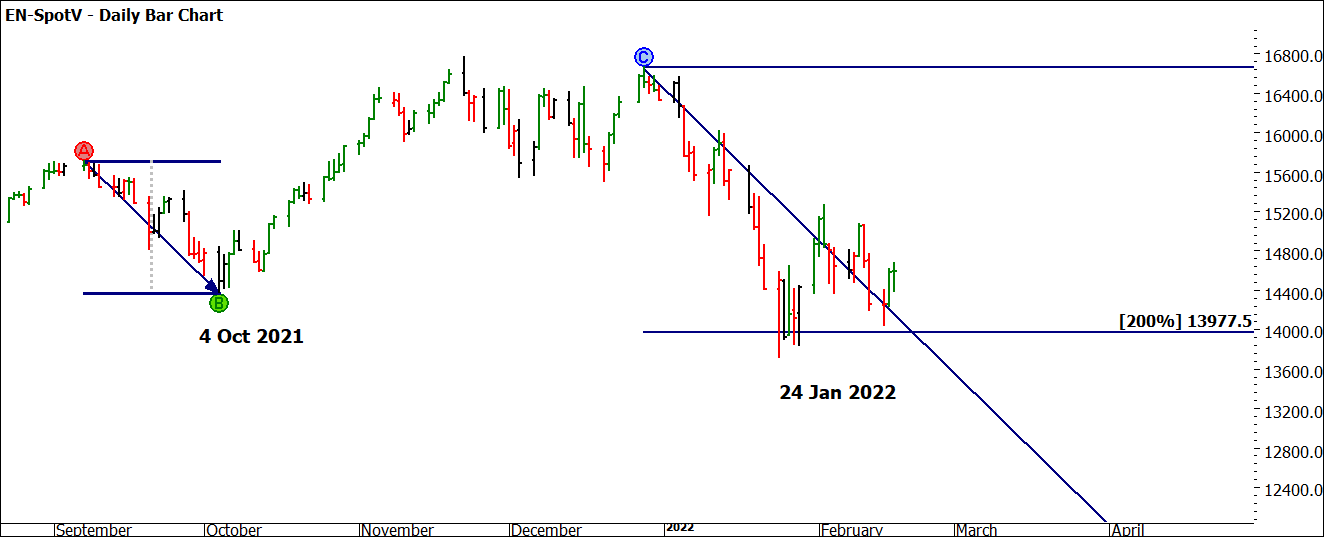
Fast forward to today and we can see the price ran 200% of the September to October range, a quick check of the time count shows 27 days down into the 24 January. Since then, the price action has settled into a sideways pattern.
Chart 2 – Daily Bar Chart EN-Spotv
No doubt this is a confirmed reaction to the downside and suggests weakness. The period from now will be defining for the equity markets in my view. Can we see a reaction to the upside and a resumption of business as usual, or have things materially changed as this is the start of something more bearish? Here is where my intro becomes important; depending on your frame of mind or current circumstance or even pet economic theory, a decision will be made by the masses. Bulls and Bears will have that battle, we can choose to measure those reactions in the charts without having to know the individuals reasoning.
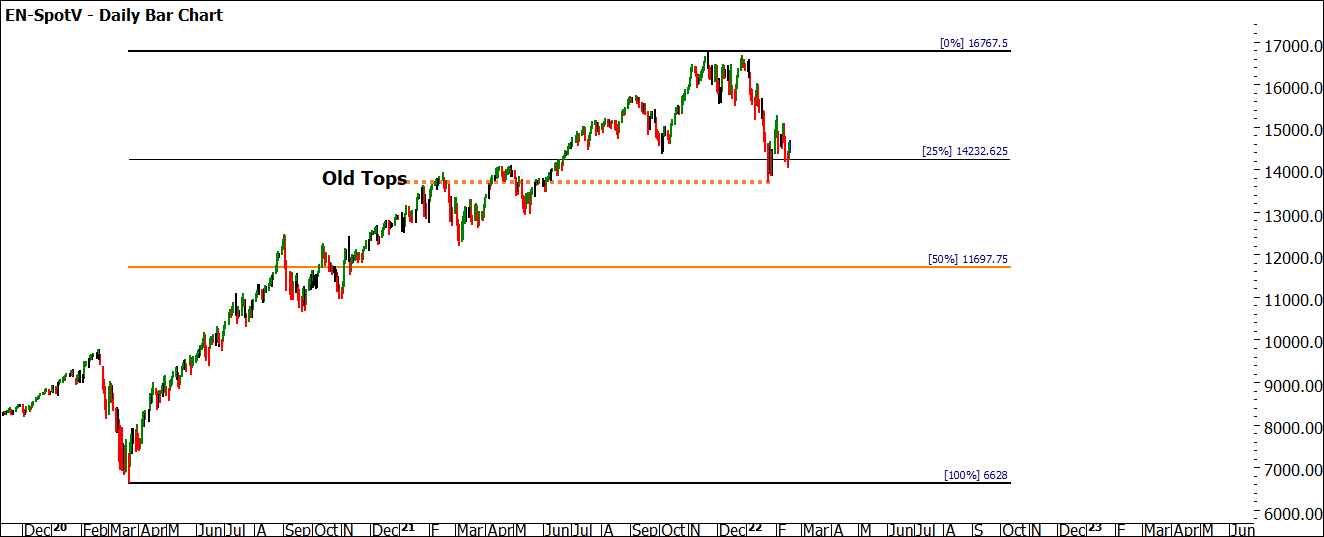
If we apply some Starter Pack logic to the current cycle, in Chart 3 we can see that the retracement is currently around 25% of the range so if this was to “kick on” we are in the springtime of the move.
Chart 3 – Daily Bar Chart EN-Spotv
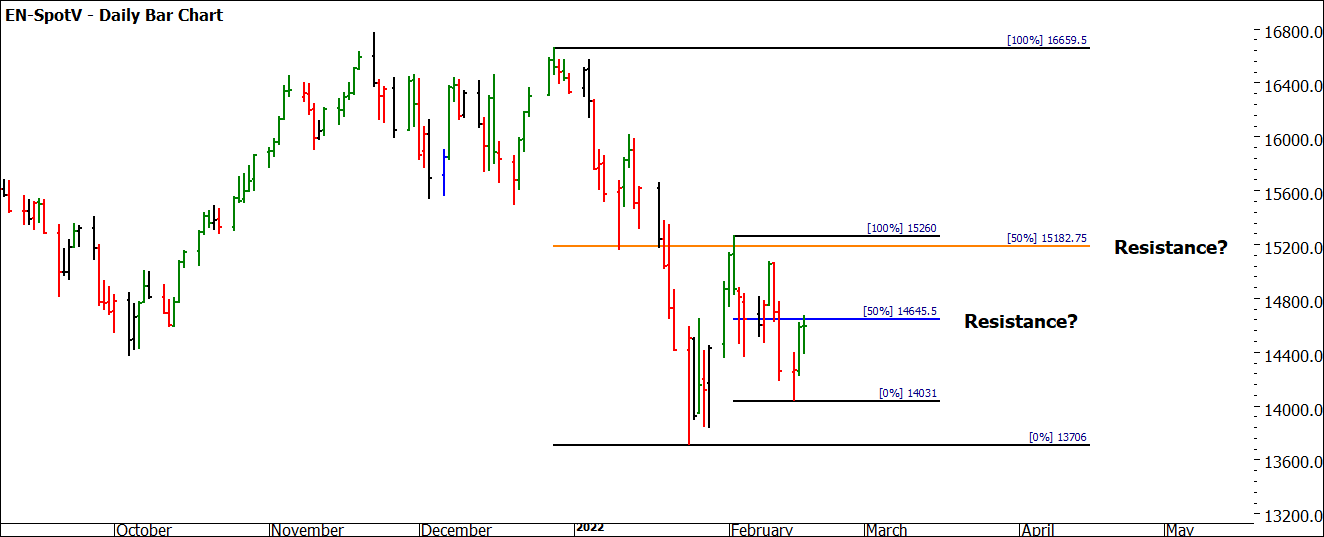
Equally and often where layers can add confusion rather than clarity, we must apply the same logic to the current downside range. Chart 4 shows us that the 50% level of the smaller picture is holding. So, for now that also must be layered into the picture. You could add to your trading plan filters which suggest until the market is back above the 50% you won’t consider long trades. All the while you are watching to see the bigger picture and decide what extra information it provides.
Chart 4 – Daily Bar Chart EN-Spotv
Learning to layer the different information from different time frames is challenging, especially when starting out. The best suggestion I can offer is to defer to the bigger picture when unsure.
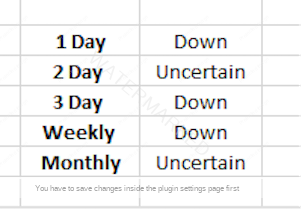
For further insights we can look to our swing charts. Currently we see the following trends. These are another “indicator” we can layer into our process, but don’t forget we want to use them in a sensitive way so we can add the relationship of ranges in terms of expansion or contraction to address the oversimplification of trend.
We are certainly at an interesting point and I for one feel we will have a need for both long and short trades in the equity space. Now is more important than ever to have good routines, measure and understand the information we are presented with and make clear decisions on our charts and trading plans. You will never be able to encompass all the available information that will go into making trading decisions by the whole market. What we can do is read the “tape” and then we opt out of all the inputs we receive around markets from the world around us. Potentially even this one.
Good Trading
Aaron Lynch
