Mechanical Trading Diary
I’m often asked, what is the perfect trading plan? As far as I’m concerned, there is no one perfect trading plan. Everyone is different. Everyone has access to the ABC Trading Plan and Number One Trading Plan, yet we all trade these differently. The Safety in the Market mechanical system provides tools for you to learn and implement, and while it is easy to understand these tools, it is the psychology, wisdom and experience that gives us our perception.
This month’s article will be focused on my Mechanical Trading Diary. It will be here that you will see insights into my psychology as a trader during a bull campaign on Commonwealth Bank. These were notes from my trading journal, so you start to understand how thinking evolves while a trading plan is followed.
My trading journal also explores the reasoning behind taking the trades, along with entry prices and exit prices which will provide you with the simplistic view to following a plan. You will learn how small amounts of money can be compounded into large amounts of money over a period of time, just by following systematic rules.
Gann suggested that his students start with an account size of $3,000 and indicated that buying and selling should take place using some sort of leverage. There are several ways that this can be done in the modern age.
Trade 1: 5th February 2014
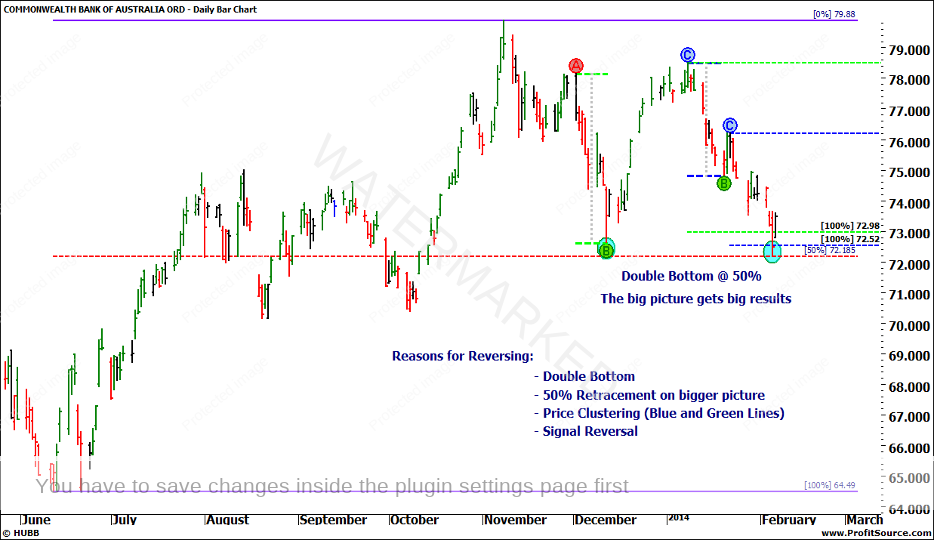
You will see that the trading campaign started from a double bottom. The reasons for this strong set up have been included below. There were compelling reasons against the current trend, which are indicated in Chart 1 below.
There is a double bottom on 12 December 2013 and 5 February 2014. Although the 5 February low broke the previous bottom and closed under it, note that the low of this bar came on a major 50% retracement level between the current All-Time High at 79.88 and the 12 June 2013 low at 64.49. The 50% level is 72.18.
In addition, with the use of form reading, the bar on the 5th of February closed below the 12th of December low. The 6th of February gapped on the open and closed higher, creating a higher bar bottom and closed above the 12th of December and 5th of February lows, which indicates signs of strength.
The current All-Time High at 79.88 came in on the 8th of November 2013. By using what Gann called Seasonal Timing, the next circular fraction to watch would be 90 days, which comes in on the 6th of February.
By anticipating a change in the trend, entries would be looked to get set above the high of the 6th of February at 73.65. The stop loss would be placed behind the lowest of the double bottoms at 72.13.
Chart 1 – CBA Daily Bar Chart
The market pulled strongly away from the 5 February low. The market is showing signs of buying activity as entry on the 7th of February gapped on open. Entry was obtained at 73.99 on the open.
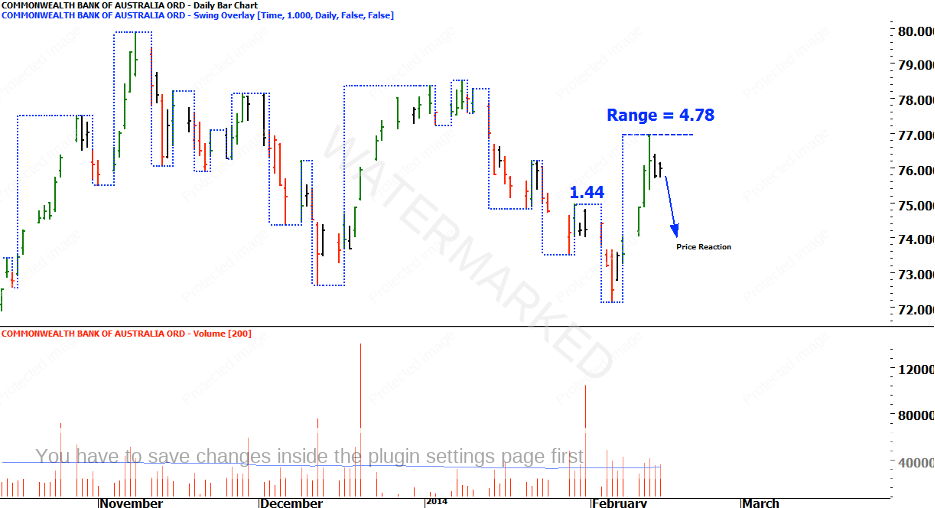
February 10th, 11th and 12th proved strong upward days with volume being above the average of 3.3 million shares. The range has proven an Overbalance of Time and Price and has also broken previous swing tops. If you refer to Gann’s Pyramiding Rule, you will know that it states to take additional trades when the market has moved three to five points in your favour. In this case, the market has moved from the 5th of February into the 12th of February which a range of 4.78. By following the plan, we wait for the next entry signal, which will come on the price reaction.
The 13th and 14th of February both being inside days, show smaller signs of volume, indicating there is some consolidation taking place in the market. The momentum to the upside has slowed down and looks to be about to retrace.
Chart 2 – CBA Daily Bar Chart
Trade 2: 17th February 2014
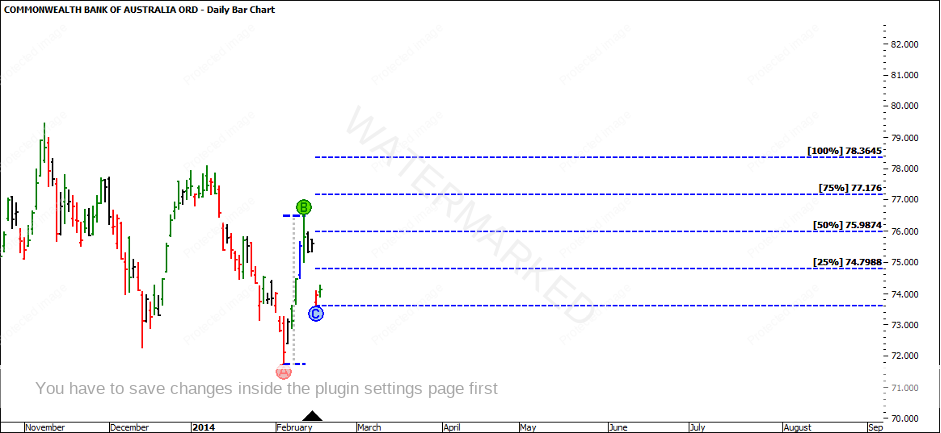
Commonwealth Bank of Australia announced an interim dividend of $1.83 per share on Wednesday, 12 February 2014. This is an increase of 12 per cent on the 2013 interim dividend. Due to the dividend, a gap of $1.89 was made on the open of the 17th of February 2014. By following the Mechanical Trading System, you would still have been in the market with stops under the low of the 5th of February.
There is also an additional long entry into the market based off the trend line indicator or ABC Long Trade. A higher swing bottom will be confirmed on the break of the 17th of February high, indicating that the trend is up. Given that markets like to close gaps, a strength indicator will be to see how fast CBA moves in closing the $1.23 gap.
Buy orders would have been filled with entry at 74.50 on the 18th of February. This was the confirmation of the higher swing bottom.
Chart 3 – CBA Daily Bar Chart
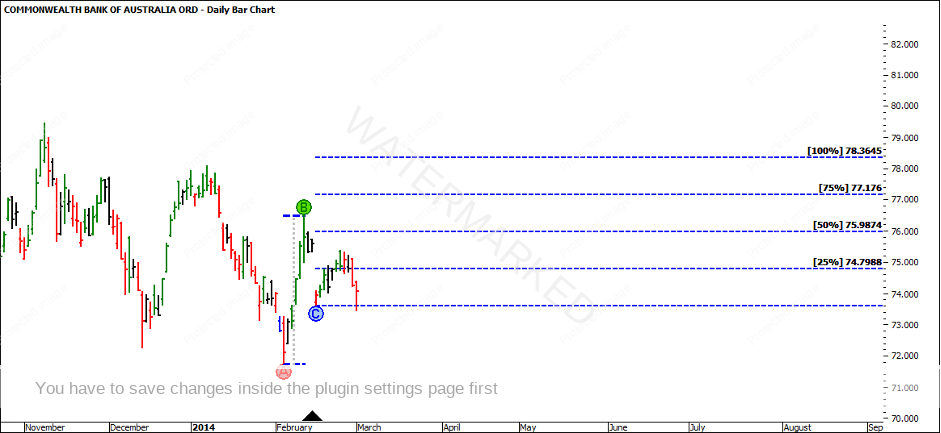
What was to follow, was an ambush of the ABC Trade. The market came back and just broke the low, which is a perfect example as to why testing needs to be done. If you had your stops 1/3 of the Average True Range or moved stops to Entry Plus commission once you got to 2:1 Reward to Risk, you would have stayed in the trade.
Chart 4 – CBA Daily Bar Chart
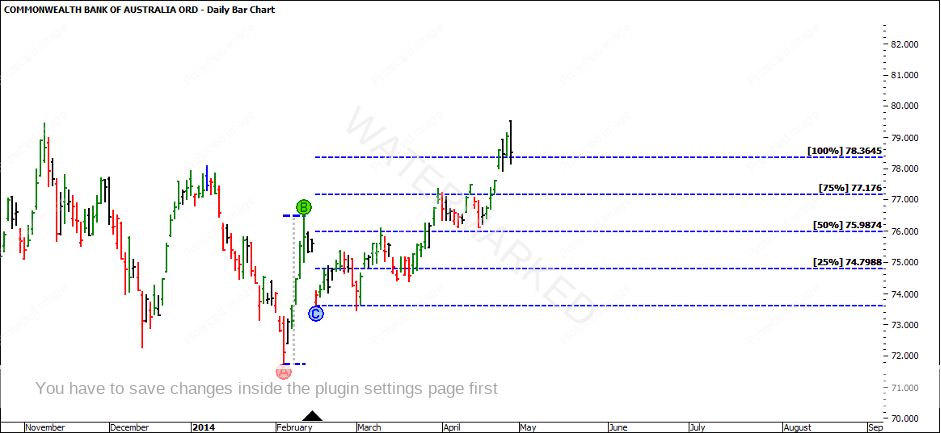
What was to come was much more upside, so by understanding your market and not suffocating the trade, you give it time to find its strength before it moves away.
Chart 5 – CBA Daily Bar Chart
I encourage you to spend some time reviewing these two trades and understand how you would have traded them yourself, using your own Mechanical Trading Plan.
It’s Your Perception
Robert Steer
