Milestones
At David’s final seminar in the year 2000, he spoke about the “Bull and Bear” chart, which teaches you about the trend of the market and the “Road Map” or “Milestone” chart, which teaches you about the key pressure points within a Range. Both of these charts are included with the Smarter Starter Pack. During the lesson, David mentions that one of his Super Traders, who traded currencies for a large bank, had his copy of the Milestone chart stuck up on the wall of his office. This gives you an idea of how important the chart was, even to an experienced trader dealing with hundreds of millions of dollars daily. David said that the “Bull and Bear” chart becomes redundant after about three months because by then, you know how to tell the trend, but that you would always need and always use the Milestone chart. Let’s look at an example!
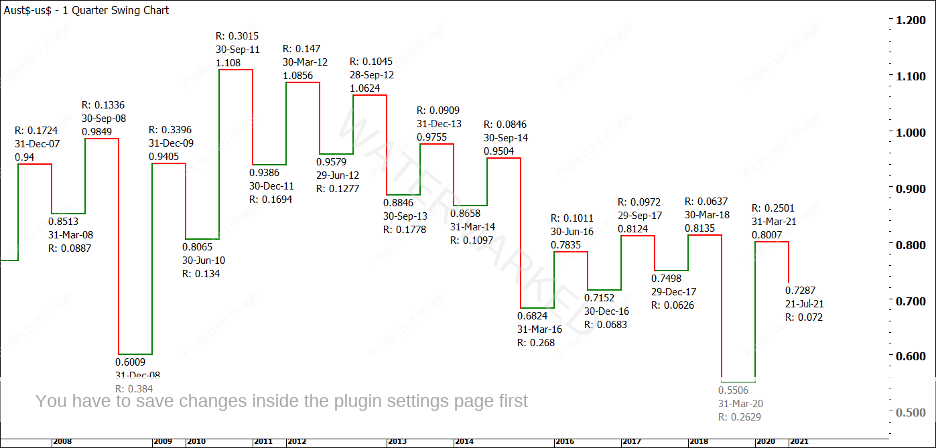
Currently, the Australian Dollar (FXADUS in ProfitSource) is making a BC retracement on the Quarterly Swing Chart. This is shown in Chart 1 below.
Chart 1 – Australian Dollar Quarterly Swing Chart
If you look closely at the swing chart ranges in Chart 1, you’ll see that the most recent upswing was 2501 points, compared with the previous upswing of 637 points. This is a clear Overbalance in Price and suggests that the big picture trend has now turned to the upside. Currently, the Australian Dollar is moving down in a BC retracement on this chart as it re-tests the March 2020 low.
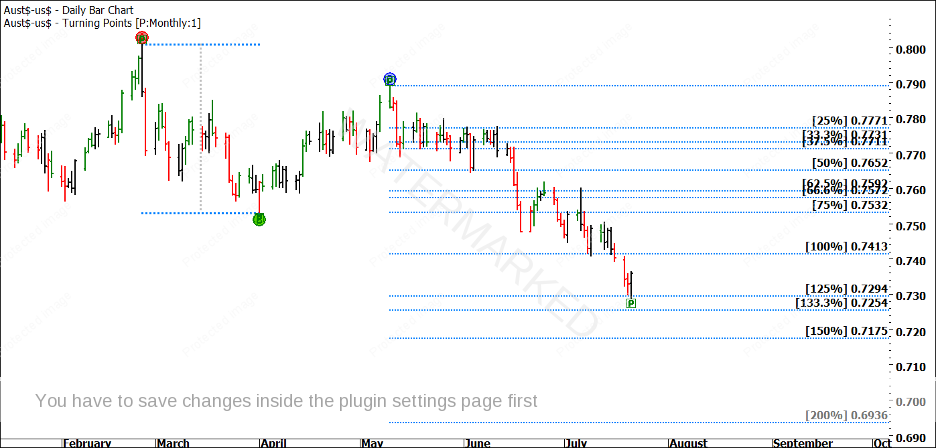
Considering this move from a “Wheels Within Wheels” approach (see Active Trader Program Online Training in the Member’s Section of the Safety in the Market website), we are currently in the second monthly swing range down from the 25 February 2021 top. We should always compare the current swing range to the previous swing range, and I have done this using the ABC Pressure Point tool in ProfitSource in Chart 2 below.
Chart 2 – ABC Pressure Point Tool
There are two key things I want to draw your attention to in Chart 2. Firstly, this monthly range has broken through the 100% milestone, which makes it an expanding range. Generally, if we get an expanding second section in the market, we can expect a third section, unless the market pulls up and makes a cluster on either the 150% milestone or the 200% milestone. These two points are noted on the Milestone chart that comes with your Smarter Starter Pack, so I would encourage you to get the chart out and have a look at it to confirm this.
The second key thing I want to point out is that the Australian Dollar pulled up on the 50% milestone on 3 June, and the 100% milestone on 9 July. It’s really important to study your milestones and see if the market is reacting at them. If the market is reacting at these milestones, it gives us targets to watch, and I will certainly be watching the 150% and 200% milestones now.
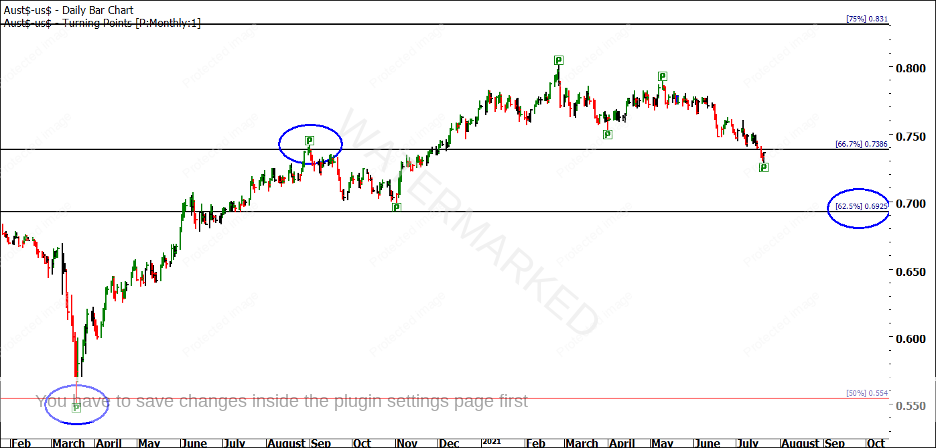
Let’s focus on the 200% milestone for a moment, which is 6936. If the market got to 6936, what would that mean? Firstly, if that was the end of the swing down on the quarterly chart, it would mean that the BC retracement is less than 50%, which means we are still in a strong bull market. Secondly, it would also be very close to the 62.5% milestone on the All-Time Highs Resistance Card, as shown in Chart 3 below.
Chart 3 – All-Time Highs Resistance Card (1.1080)
This would give us a potential cluster to work with (6936 and 6925), although I like to see a minimum of three milestones nice and close together before I call it a cluster. So where might a third or fourth milestone come from? I would be looking at the weekly swing chart if and when we get closer to this level, along with the daily chart. They would be the two key areas to look for clusters.
For those of you who would like some more practice in locking down potential cluster points in the market, I would encourage you to check out the ‘Find the Turning Points’ module within our new Active Trader Program Online Training.
Be Prepared!
Mathew Barnes


