Miss the Top? No Probs…
With a routine scan of the charts we can keep an eye out for trading opportunities which come from double tops and double bottoms. And as this article will show, even if you missed the extreme high or low of the setup, all is not lost. This article also proposes a fresh perspective on trade management.
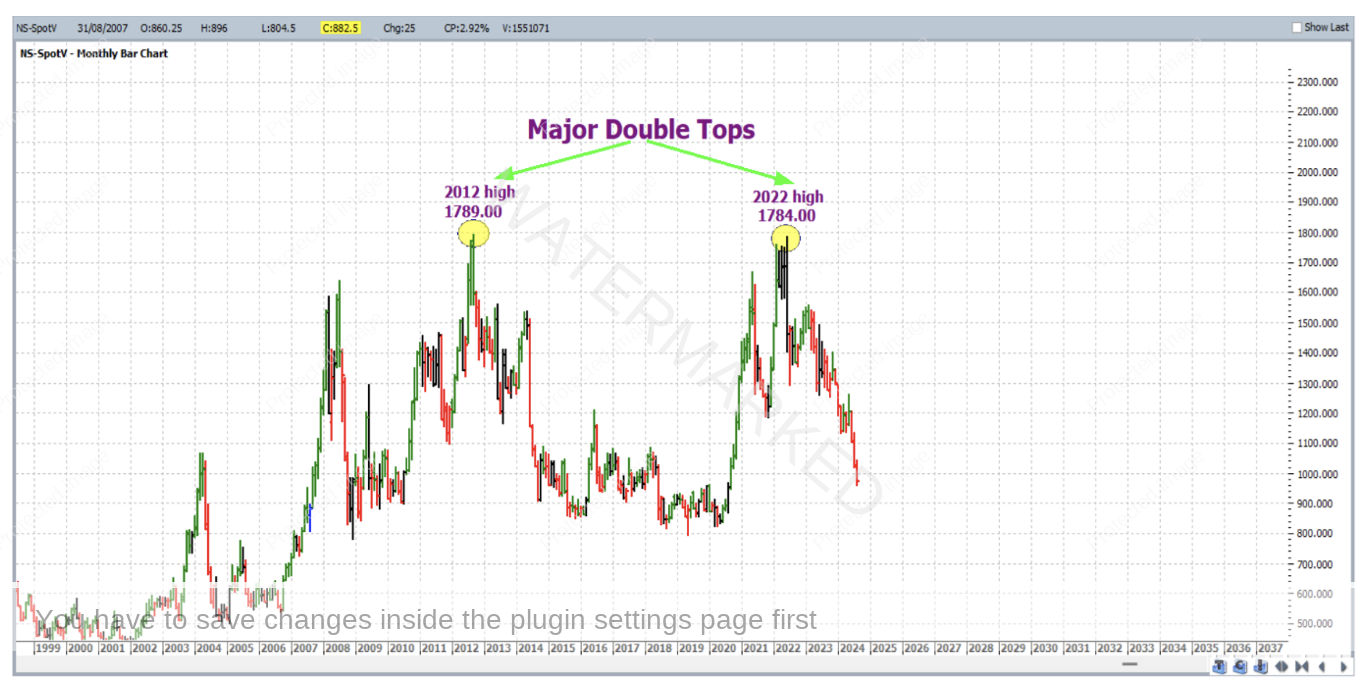
Honing in on the Soybeans market, the monthly bar chart below (symbol NS-SpotV in ProfitSource) shows a major double top formation that came to be in 2022 – the two major tops at 1789 and 1784 (US cents per pound) were within 0.3% of one another.
Now let’s say you had only come across this very bearish formation in late 2023 – obviously having well and truly missed the yearly top of 2022. Was it too late to find a short trade from one of the Beans charts? Let’s find out.
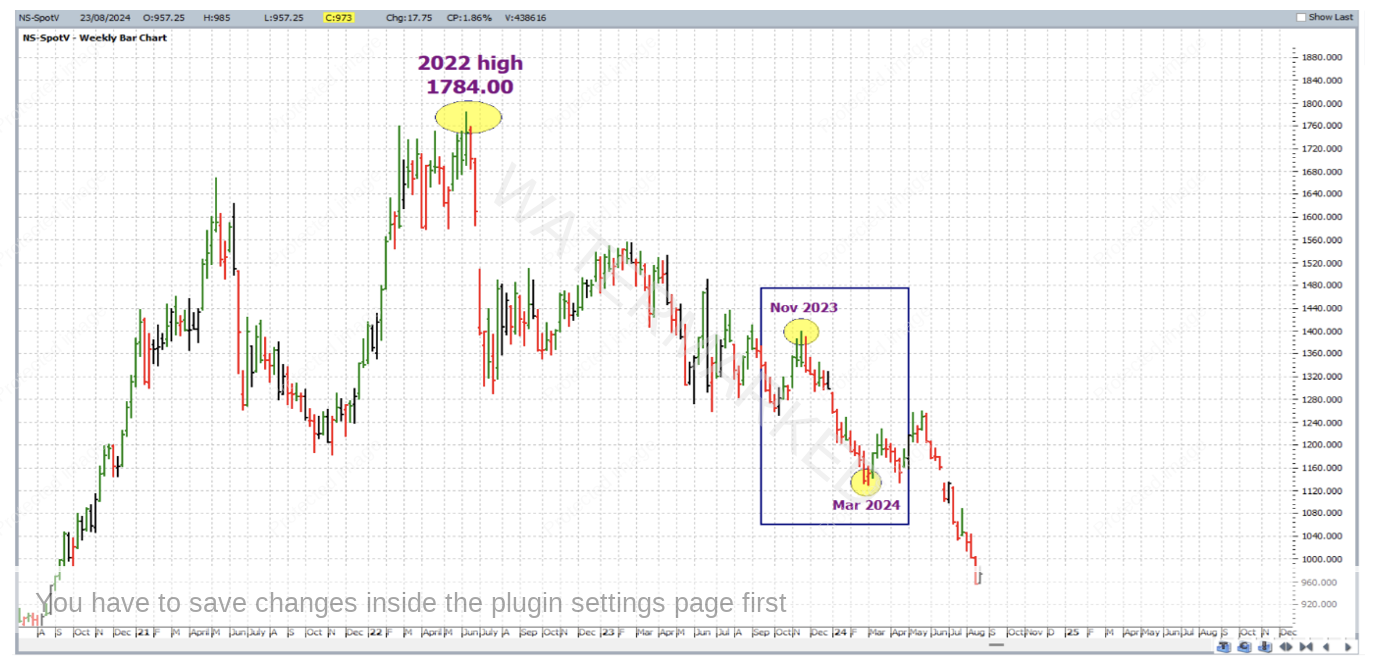
Zooming in to the weekly chart and showing the bear market action which followed the 2022 high, we observe the monthly swing down from the November 2023 high to the March 2024 low.
Now while missing such a big yearly top can be quite the tease, there are still points to be gained by trading one of the intermediate tops on the way down – don’t forget that getting in early on a monthly swing can still also get you a very high Reward to Risk Ratio.
While the SpotV chart has established general bearish sentiment, we can also look to the other Beans market charts for a trade. Note that while not all beans charts show the exact same price and pattern at the same time – they generally move together – in this case down!
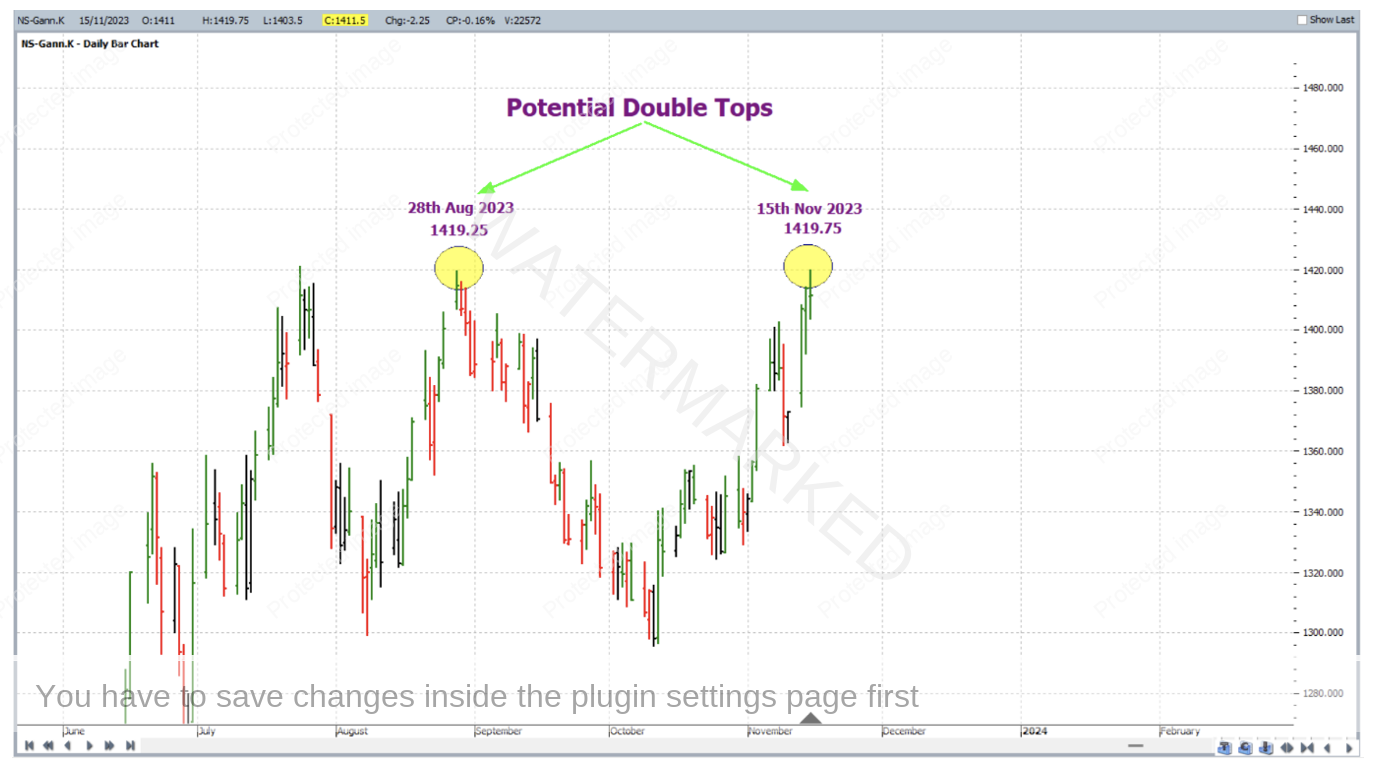
In the case of the November 2023 monthly top, the continuous Gann chart for May beans offered a good setup for a trade. First of all (on the NS-Gann.K chart), the tops of 28 August 2023 and 15 November 2023 were potential (this time much smaller picture) double top partners.
For that matter – the July 2023 top, if included in the discussion, would have us calling this a triple top formation – with one perhaps looking to trade the August top as the second of two double tops at the time – and you may have had a go. But as will be seen there was some much better price harmony to eventually prove the November top as the one to get on board (or back on board) with.
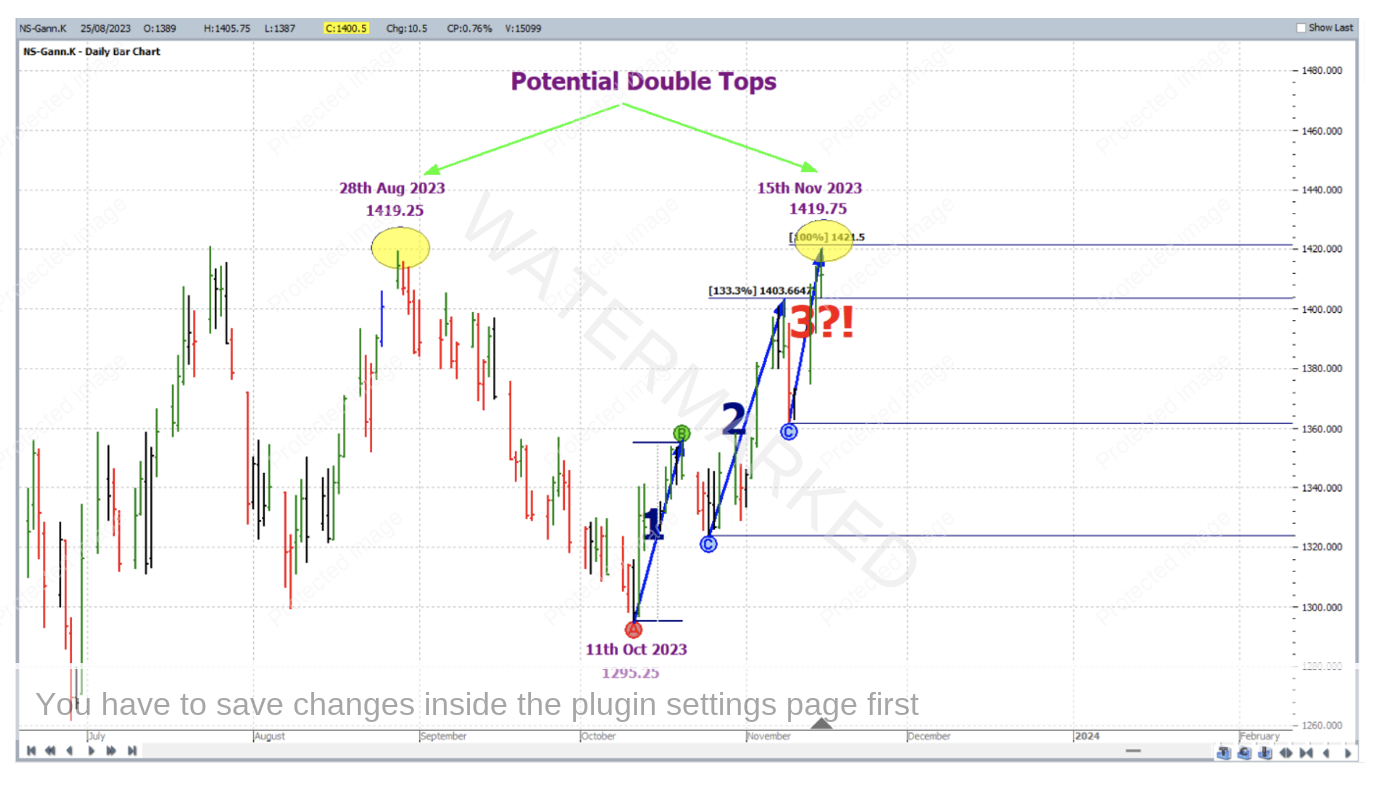
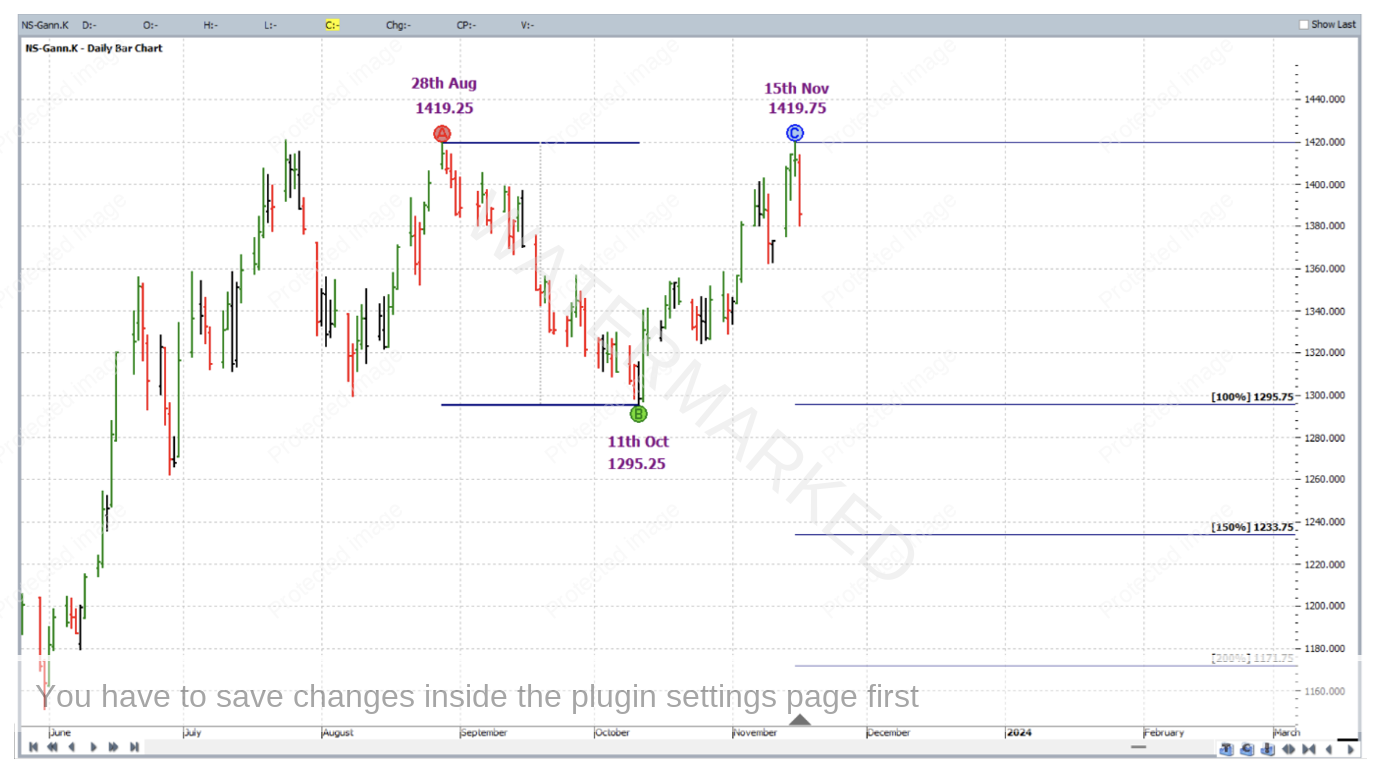
Zooming in a little more to the run up from the October low into the potential November top, there was some quality price analysis in terms of sections of the market. As shown in the chart below, the swing on the daily chart (potential 3rd section up) into the 15 November 2023 high of 1,419.75 was with a few cents off 100% of the FRO (1st section up) on the daily swing chart from the October low, not to mention the second section expanding at 133% of the first.
This was an almost textbook example of sections of the market – with the 3 sections terminating at a potential double top formation in what was already a strong bear market! Now what about the actual trade?
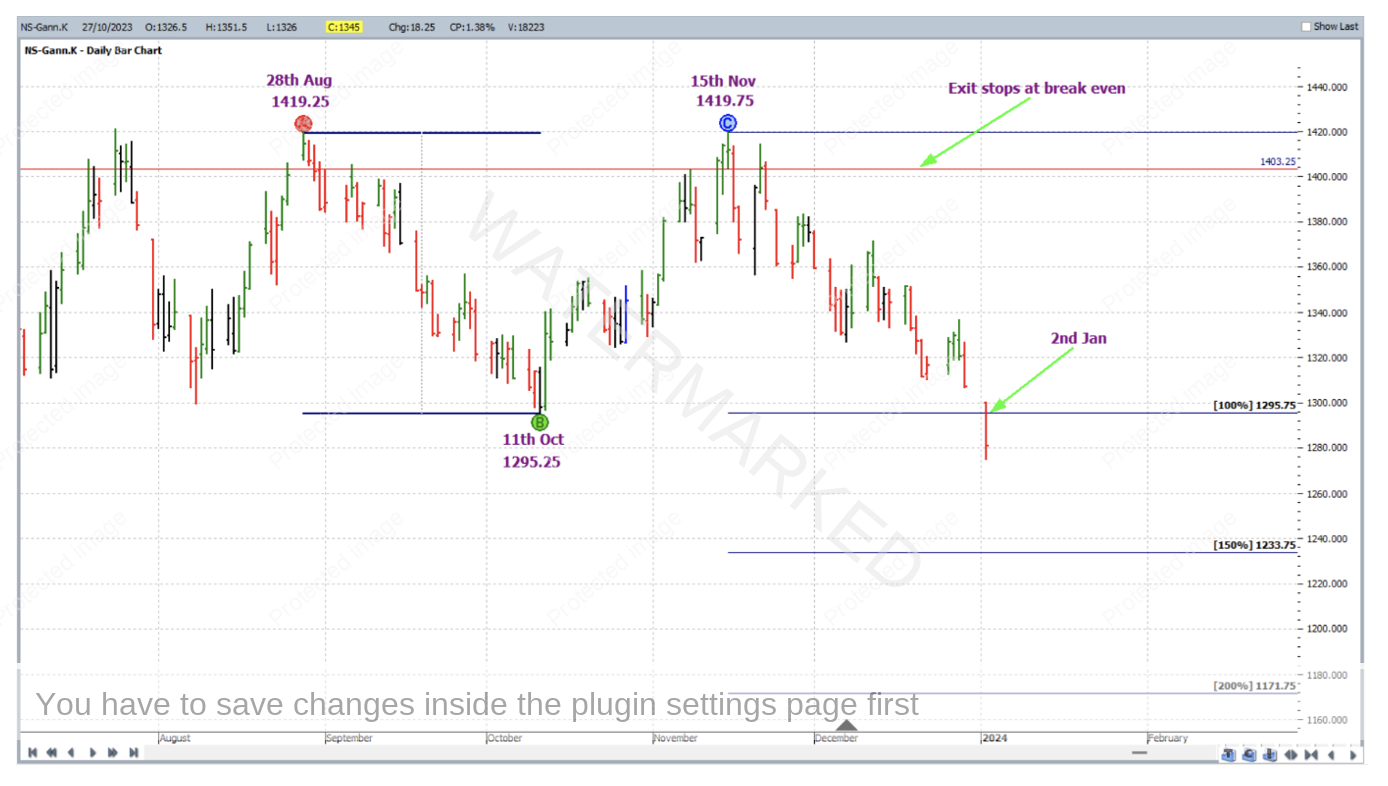
Given the quality of the setup and strength of overall bearish sentiment, on 16 November 2023 at the turning down of the daily swing chart, you’d be short the May 2024 beans contract at 1,403.25 with initial exit stop at 1,420.
With Points A, B and C applied to this potential double top formation as shown below, the exit target was the 200% milestone of the double tops.
Now for some deeper thought on trade management. With this being a smaller picture double top, milestones are not spaced that far apart. This means that trailing stops, like in a normal ABC trade, could have you stopped out prematurely. This time let’s test an alternative approach – move stops when the 100% and 150% milestones are reached. If you think about it, 100% is 50% of the intended run length (200%) and 150% is 75% of the intended run length (200%) – therefore geometrically and proportionately the management of stops in this way would after all be like managing a standard ABC trade currency style.
Moving on, 2 January 2024 saw the market reach the 100% milestone and stops were moved to break even.
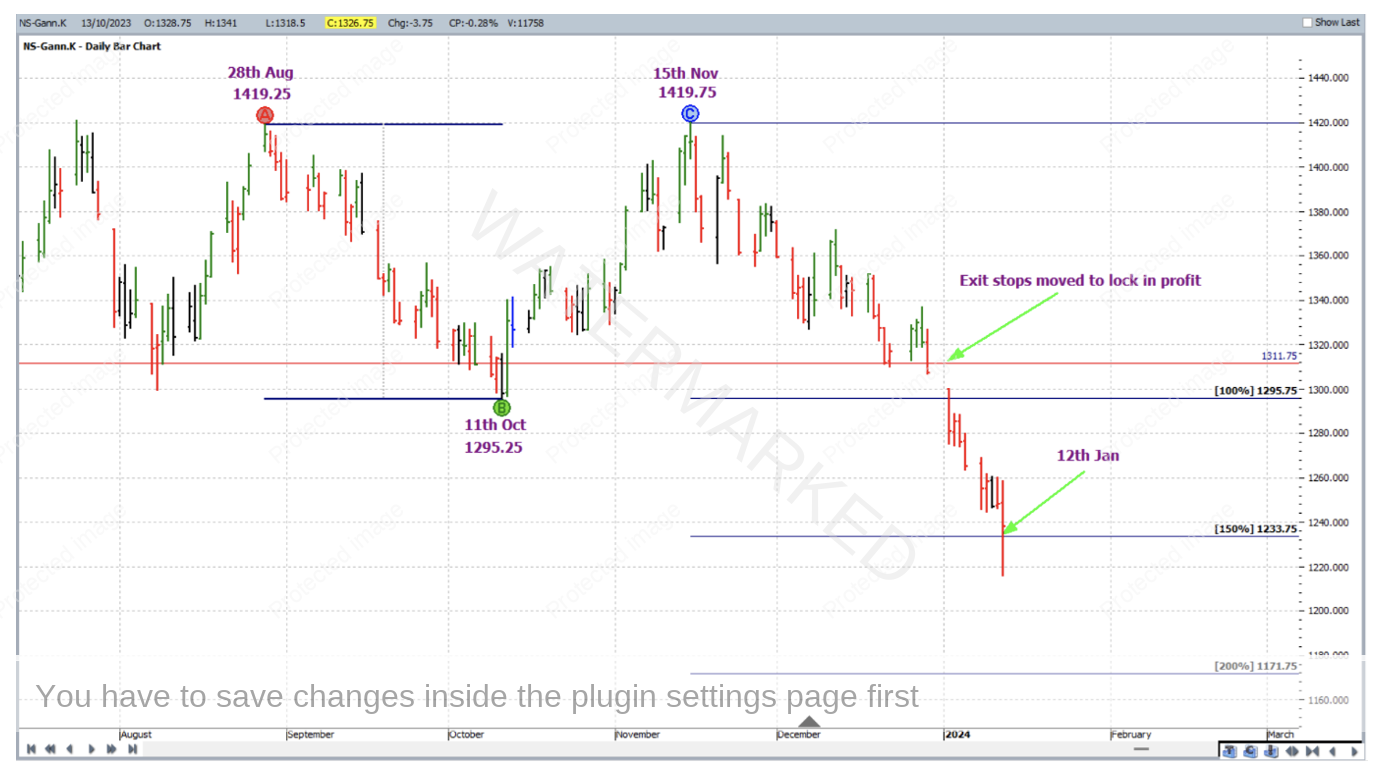
On 12 January 2024, the 150% milestone was reached and exit stops were moved to 1,311.75 i.e. one third of the average weekly range (approximately 16 cents) above the 100% milestone to lock in some profit.
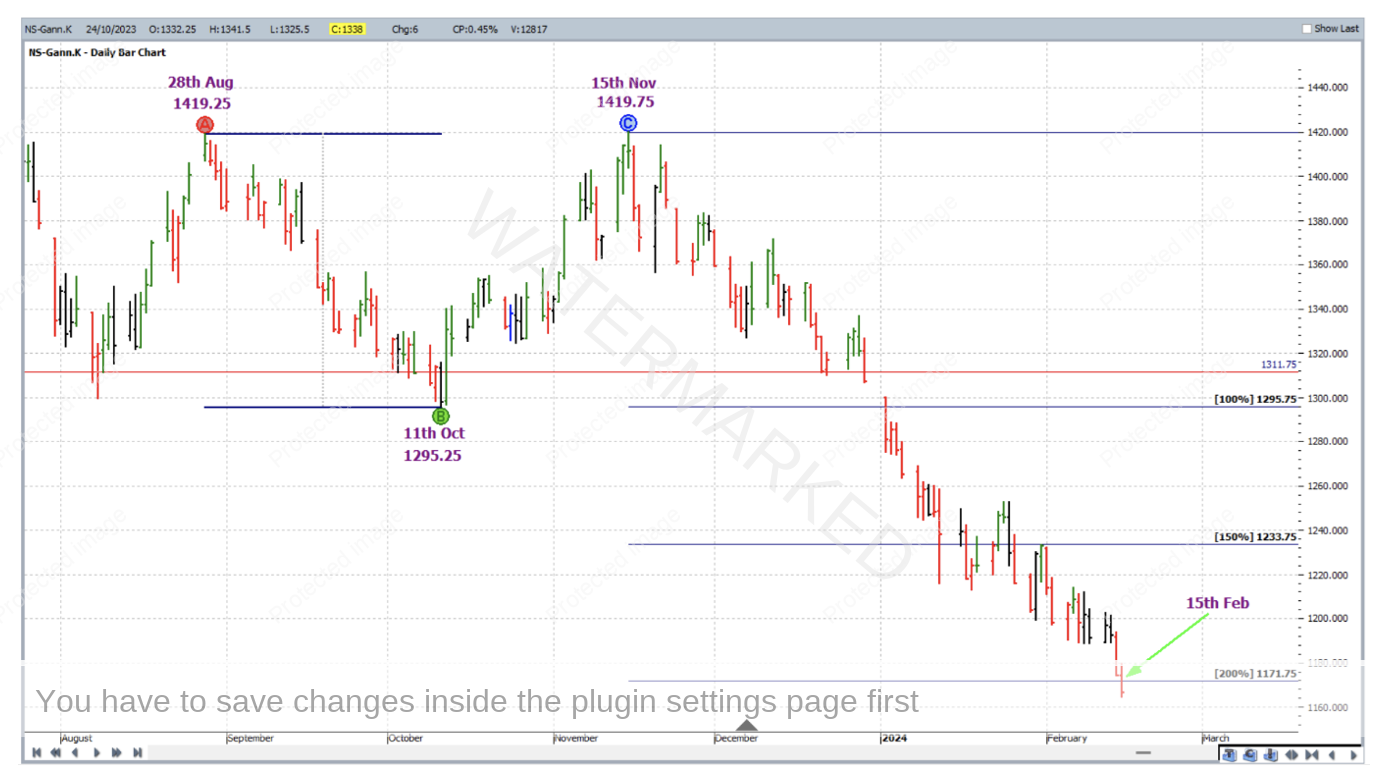
And finally on 15 February 2024 the 200% milestone was reached and the trade closed at 1,171.75.
To break down the rewards, first of all let’s determine the Reward to Risk Ratio:
Initial Risk: 1,420.00 – 1,403.25 = 16.75 = 67 points (point size is 0.25)
Reward: 1,403.25 – 1,171.75 = 231.50 = 926 points
Reward to Risk Ratio = 926/67 = approximately 14 to 1
According to the CME group website, the contract specs for Soybean futures say that each point of price movement changes the value of one futures contract by $12.50 USD, so in absolute USD terms the risk and reward were:
Risk = $12.50 x 67 = $837.50
Reward = $12.50 x 926 = $11,575
At the time of taking profits, the reward in Australian dollars was approximately equal to $17,800.
If 5% of the account size was risked at entry the percentage change to the account would be as follows:
14 x 5% = 70%
Work hard, work smart.
Andrew Baraniak
