More BS
(Bank Stuff)
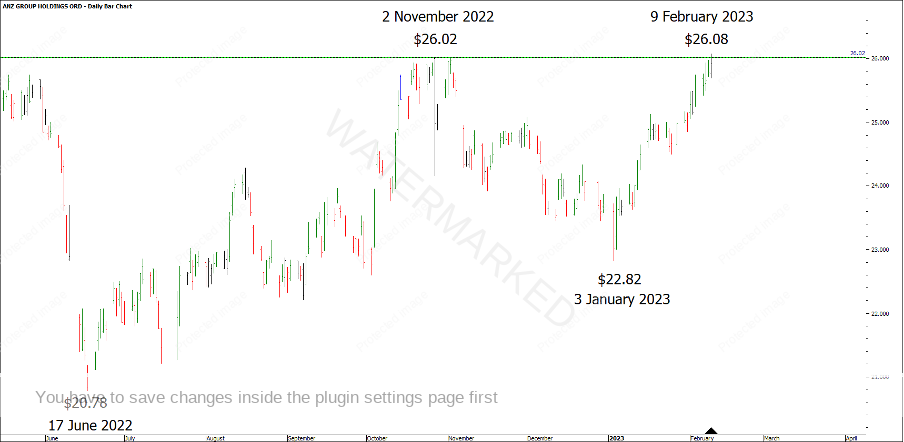
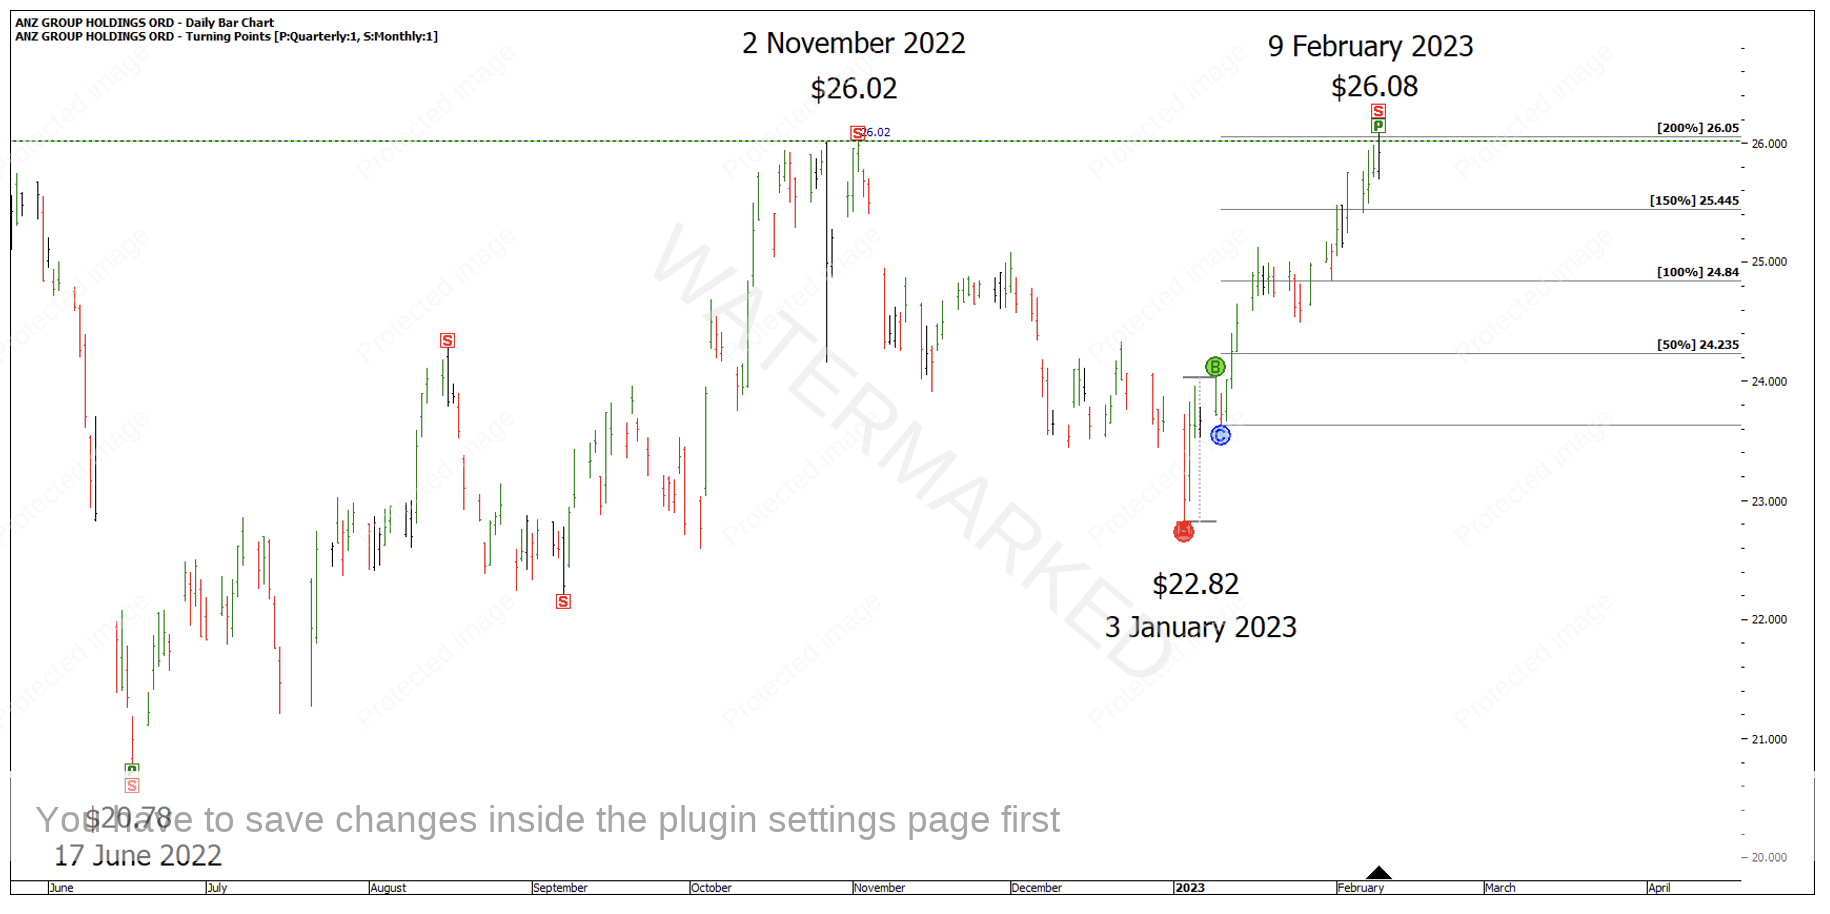
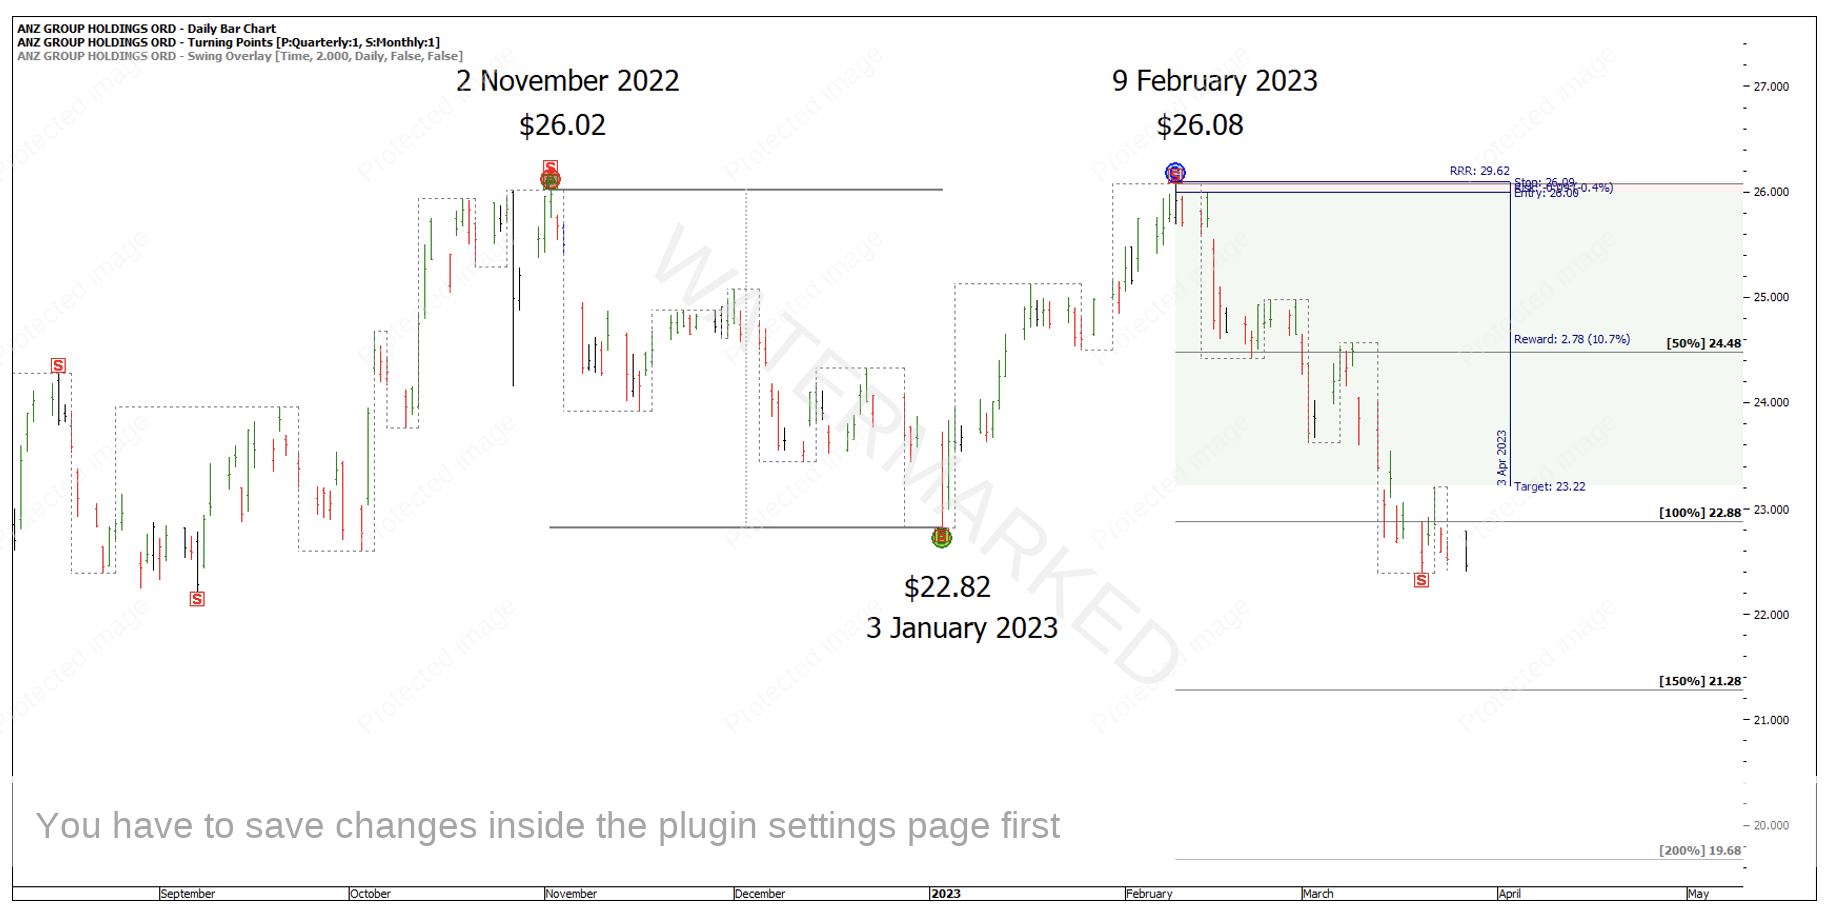
There is no shortage of news surrounding the recent Bank dramas from around the globe. What’s not just pure BS (Bank Stuff) is the quality of a recent double top price cluster on a local Australian Bank stock, ANZ.
Chart 1 – ANZ Double Top
Before you read any further, open your charting software and have a go at finding as many reasons as possible for calling these double tops.
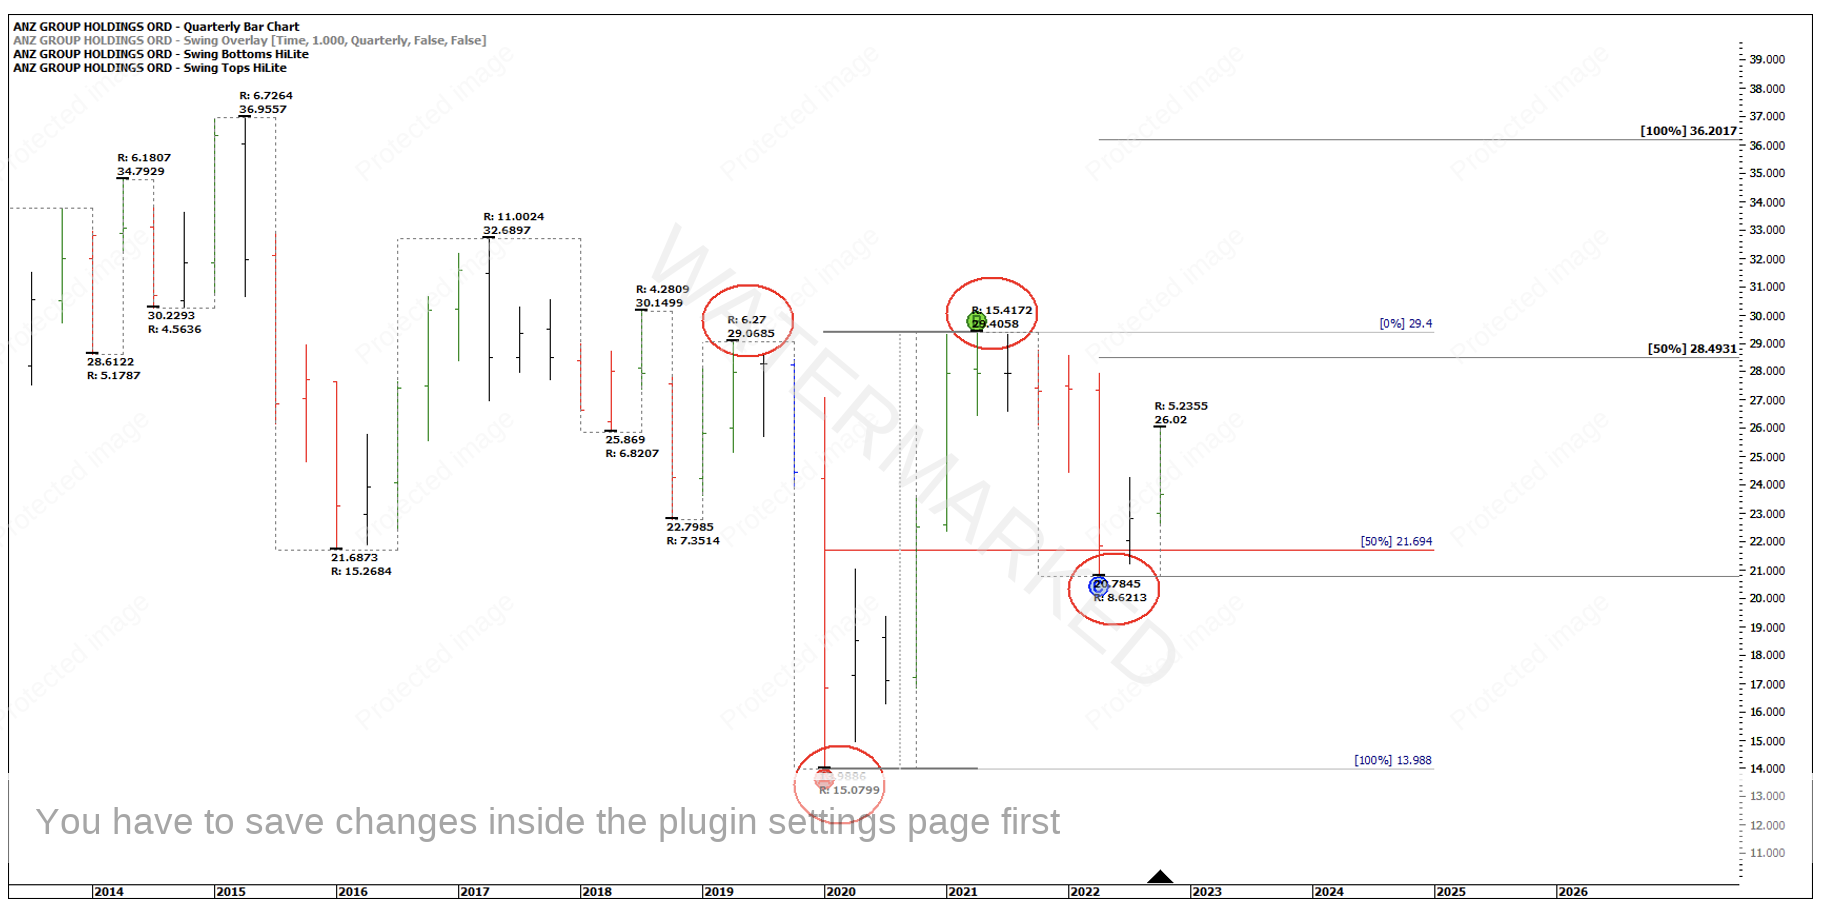
Chart 2 below shows the quarterly swing chart and a big overbalance in price to the upside followed by a higher quarterly swing bottom roughly on a 50% retracement. This big picture analysis paints quite a bullish picture.
Chart 2 – Quarterly Swing Chart
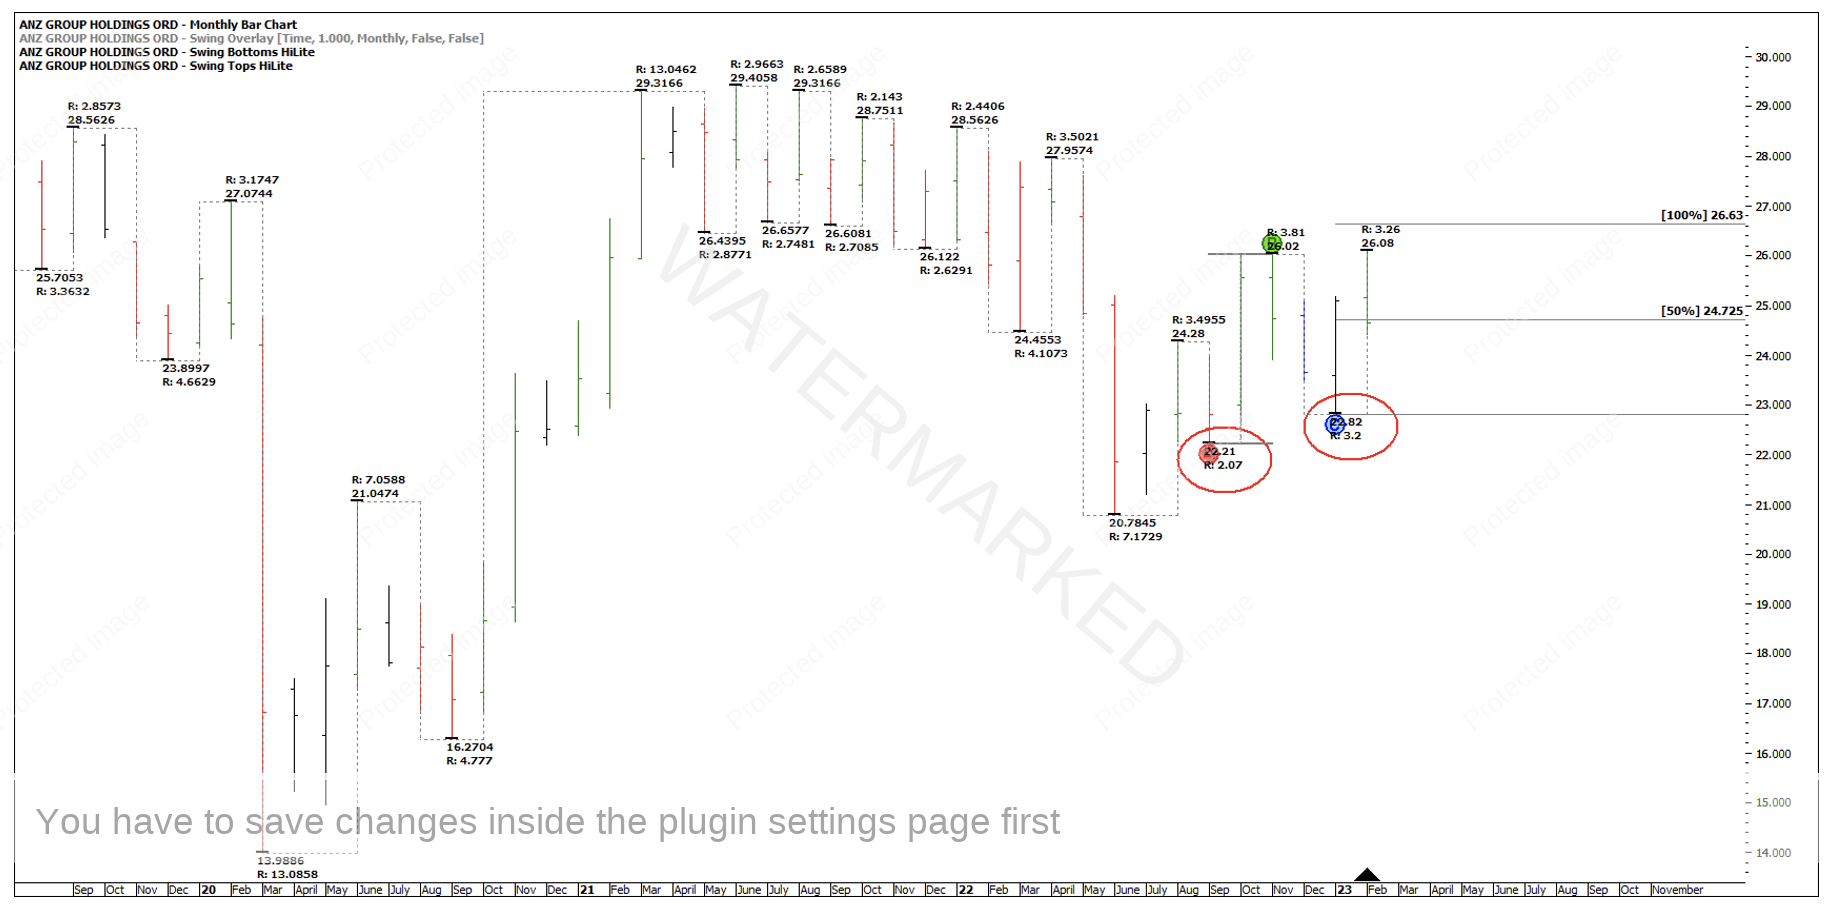
Breaking down the current quarterly swing up on a monthly swing chart time frame, its position shows the monthly swing was in a third swing up after an expanding down swing range leading into the double tops. The size of the second monthly pull back of $3.20 wasn’t looking quite as strong. Why? Because it’s retraced a long way through estimated Point C.
Chart 3 – Monthly Swing Chart
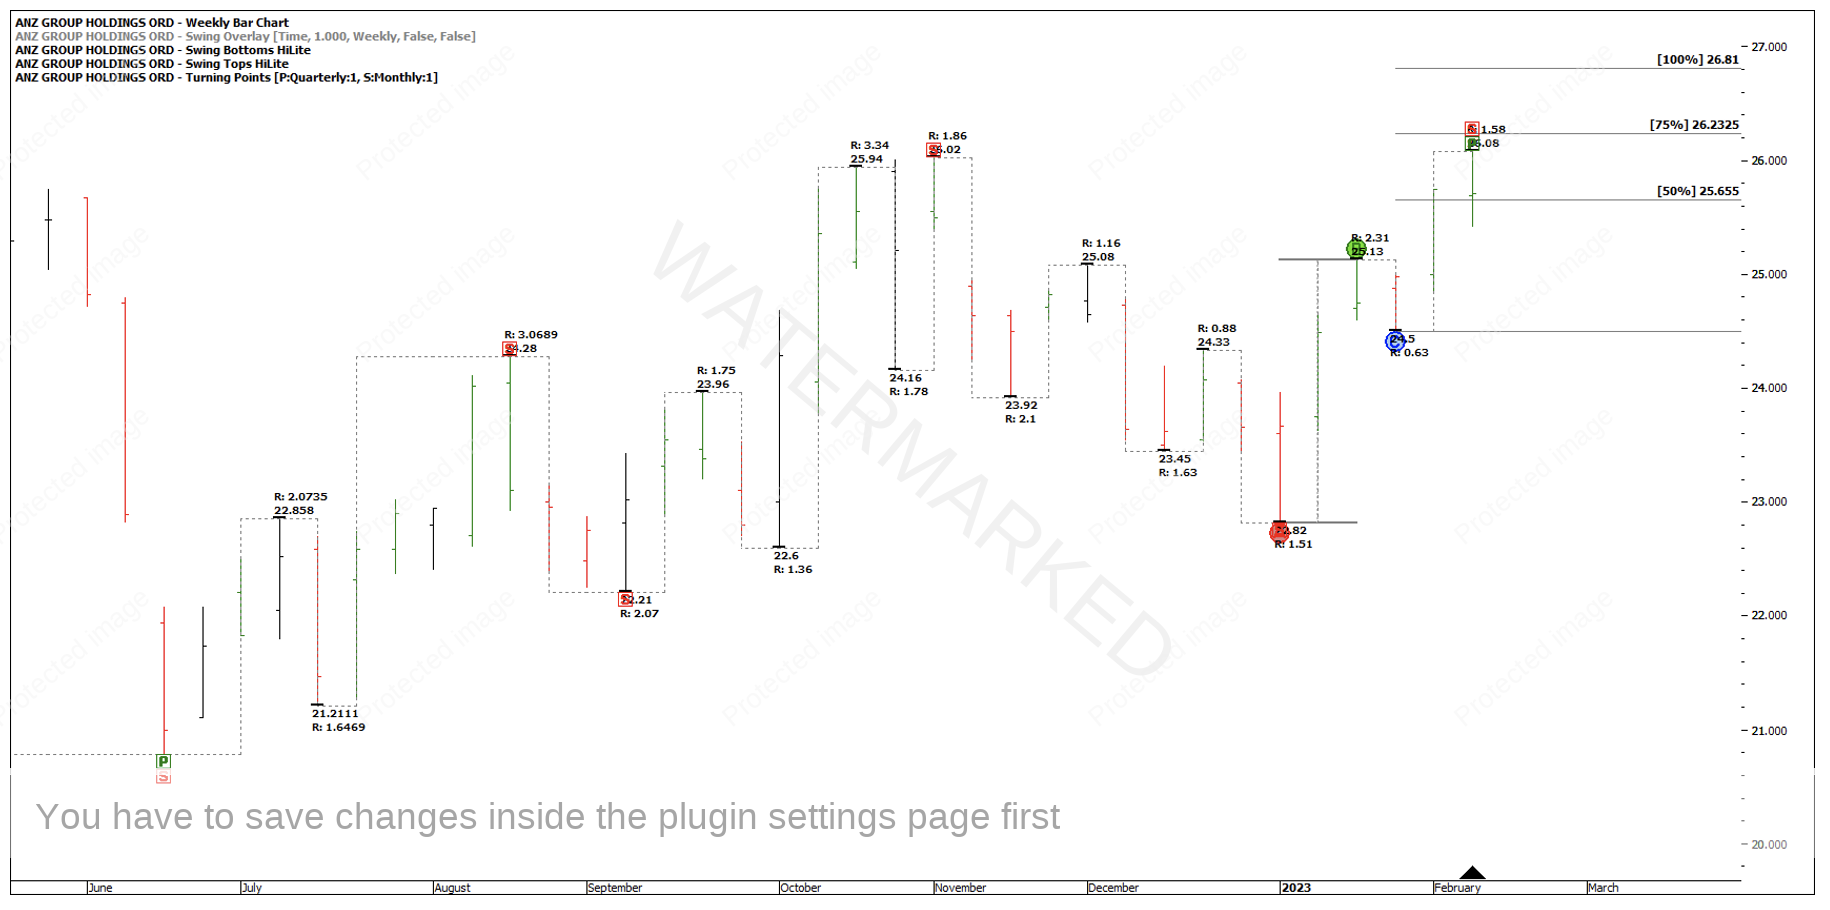
Isolating the last monthly swing up, this swing was made of two weekly swings.
Chart 4 – Weekly Swing Chart
At this stage of the analysis, there is no clear price cluster. However, if you drop down to a daily bar chart this cluster starts to come to life.
My most favourite swing milestone, the 200% level, when applied to the daily First Range Out (FRO) gave a price target of $26.05, which is 3 cents higher than the previous top.
Chart 5 – Double Top
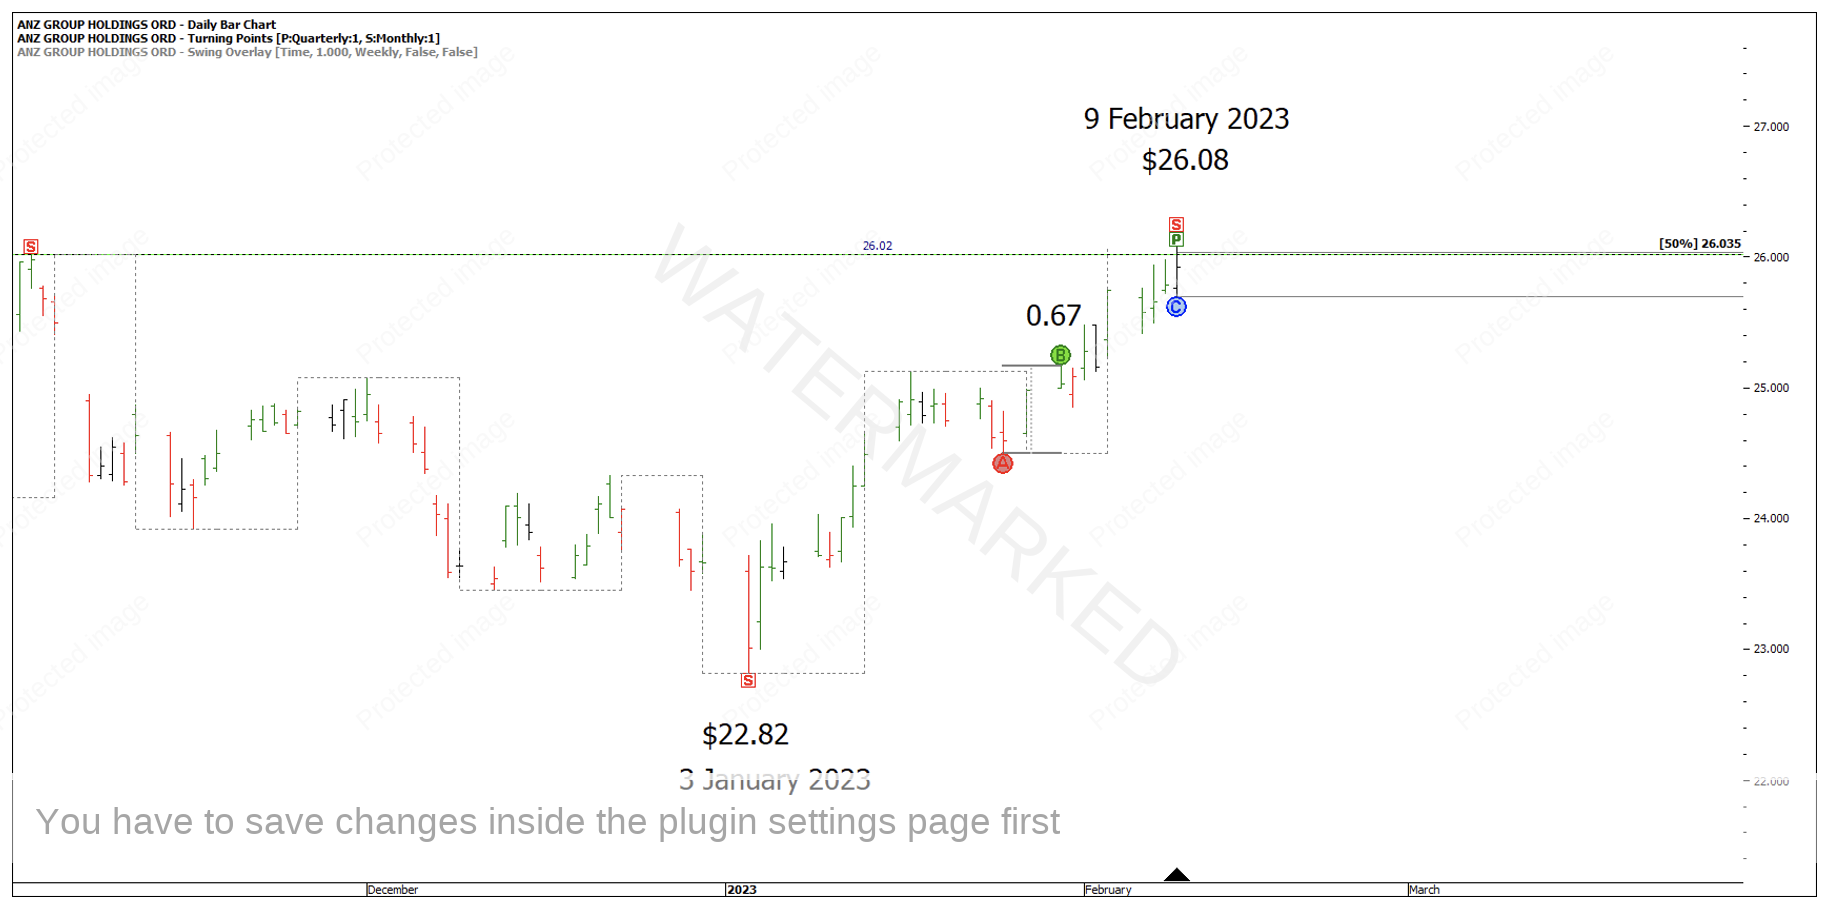
Looking at the last weekly swing up, there was a daily FRO out of 67 cents. The third and final daily swing into the double top came in at 50% of this daily FRO at $26.03.
Chart 6 – 50% Daily Swing Milestone
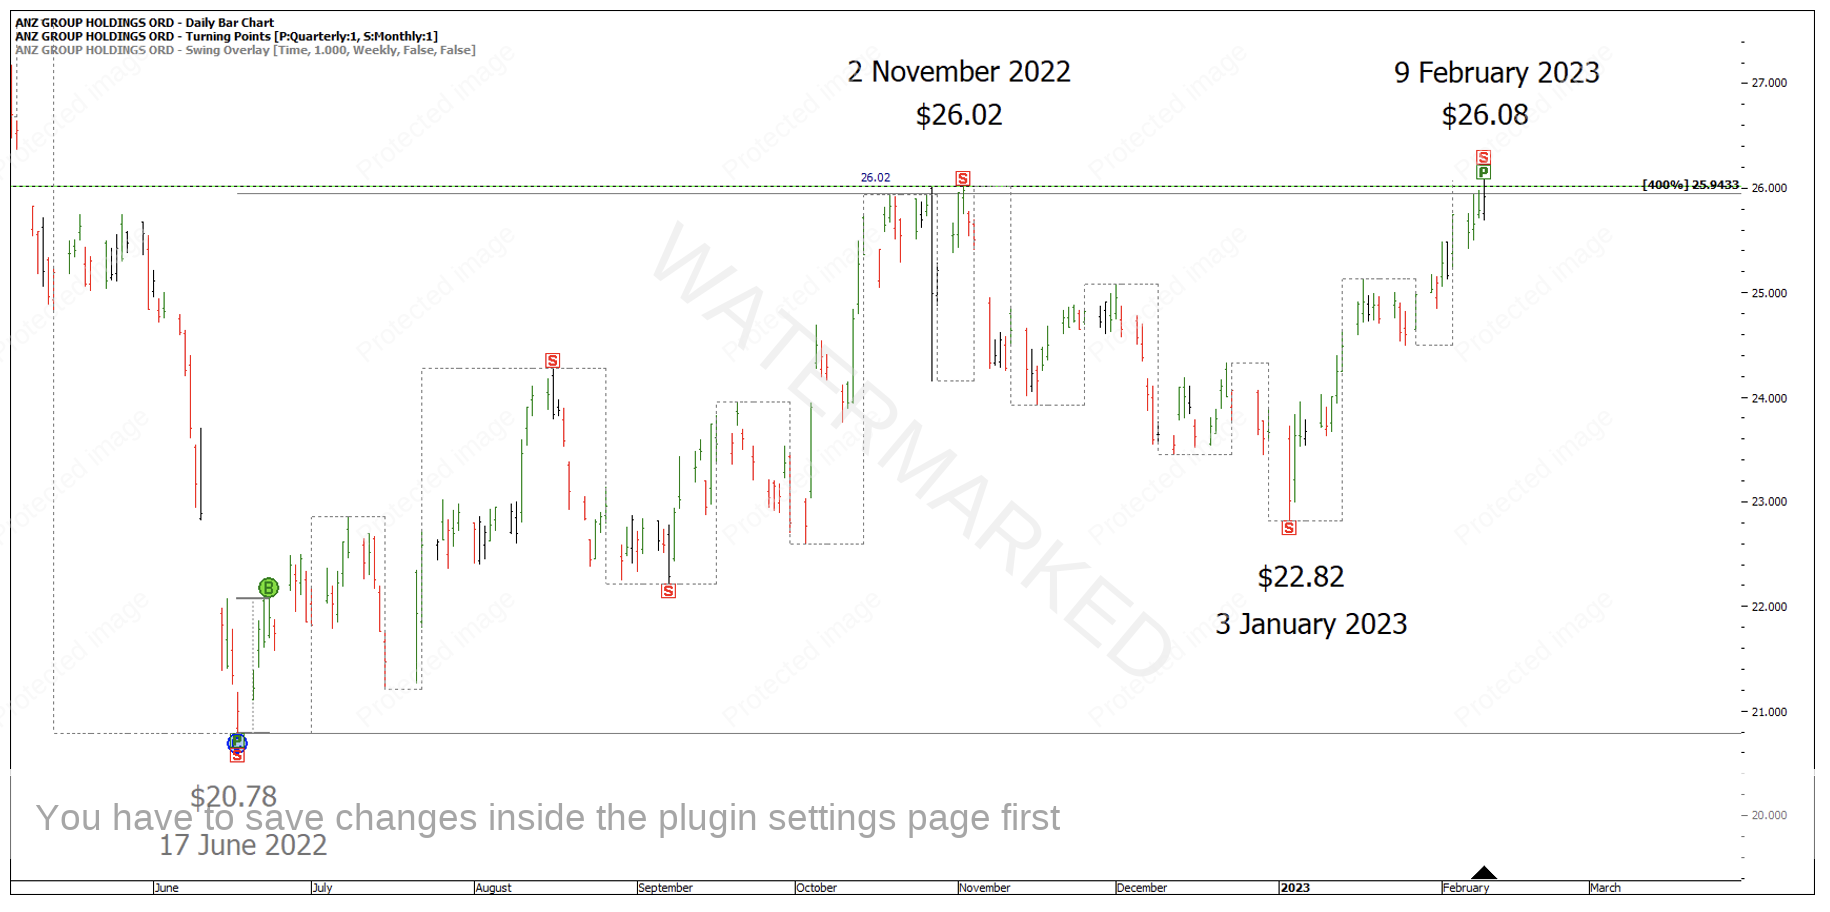
All the while this was coming in at roughly 4 multiples of the daily FRO from the 17 June 2022 low.
Chart 7 – Multiples of the First Range Out
Leading into this top, we’ve seen a contracting quarterly swing up, contracting monthly swing up, a contracting weekly swing up and now a contracting daily swing up. If you were tracking this a few days prior leading into the top, you could drop down to a 4-hour swing chart and start to look for another piece of the price cluster to tie in with what we have already.
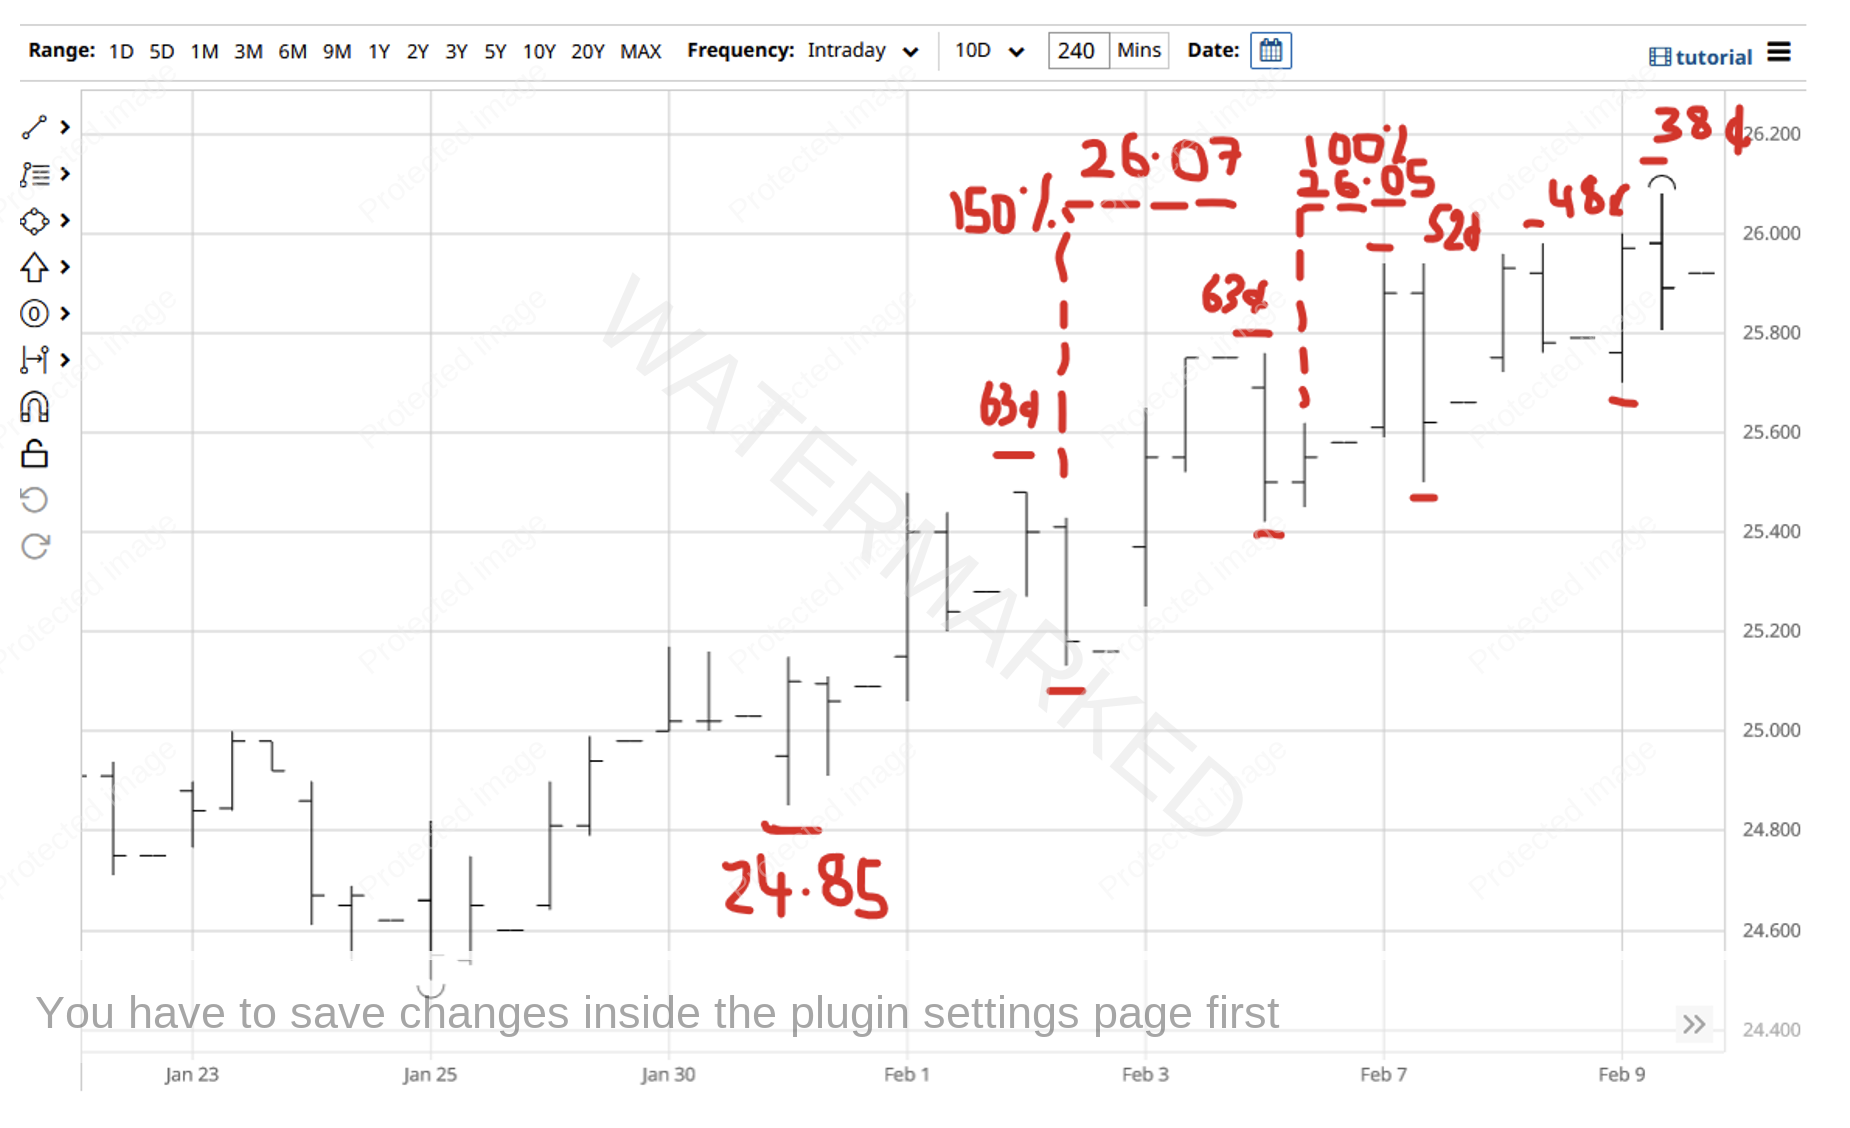
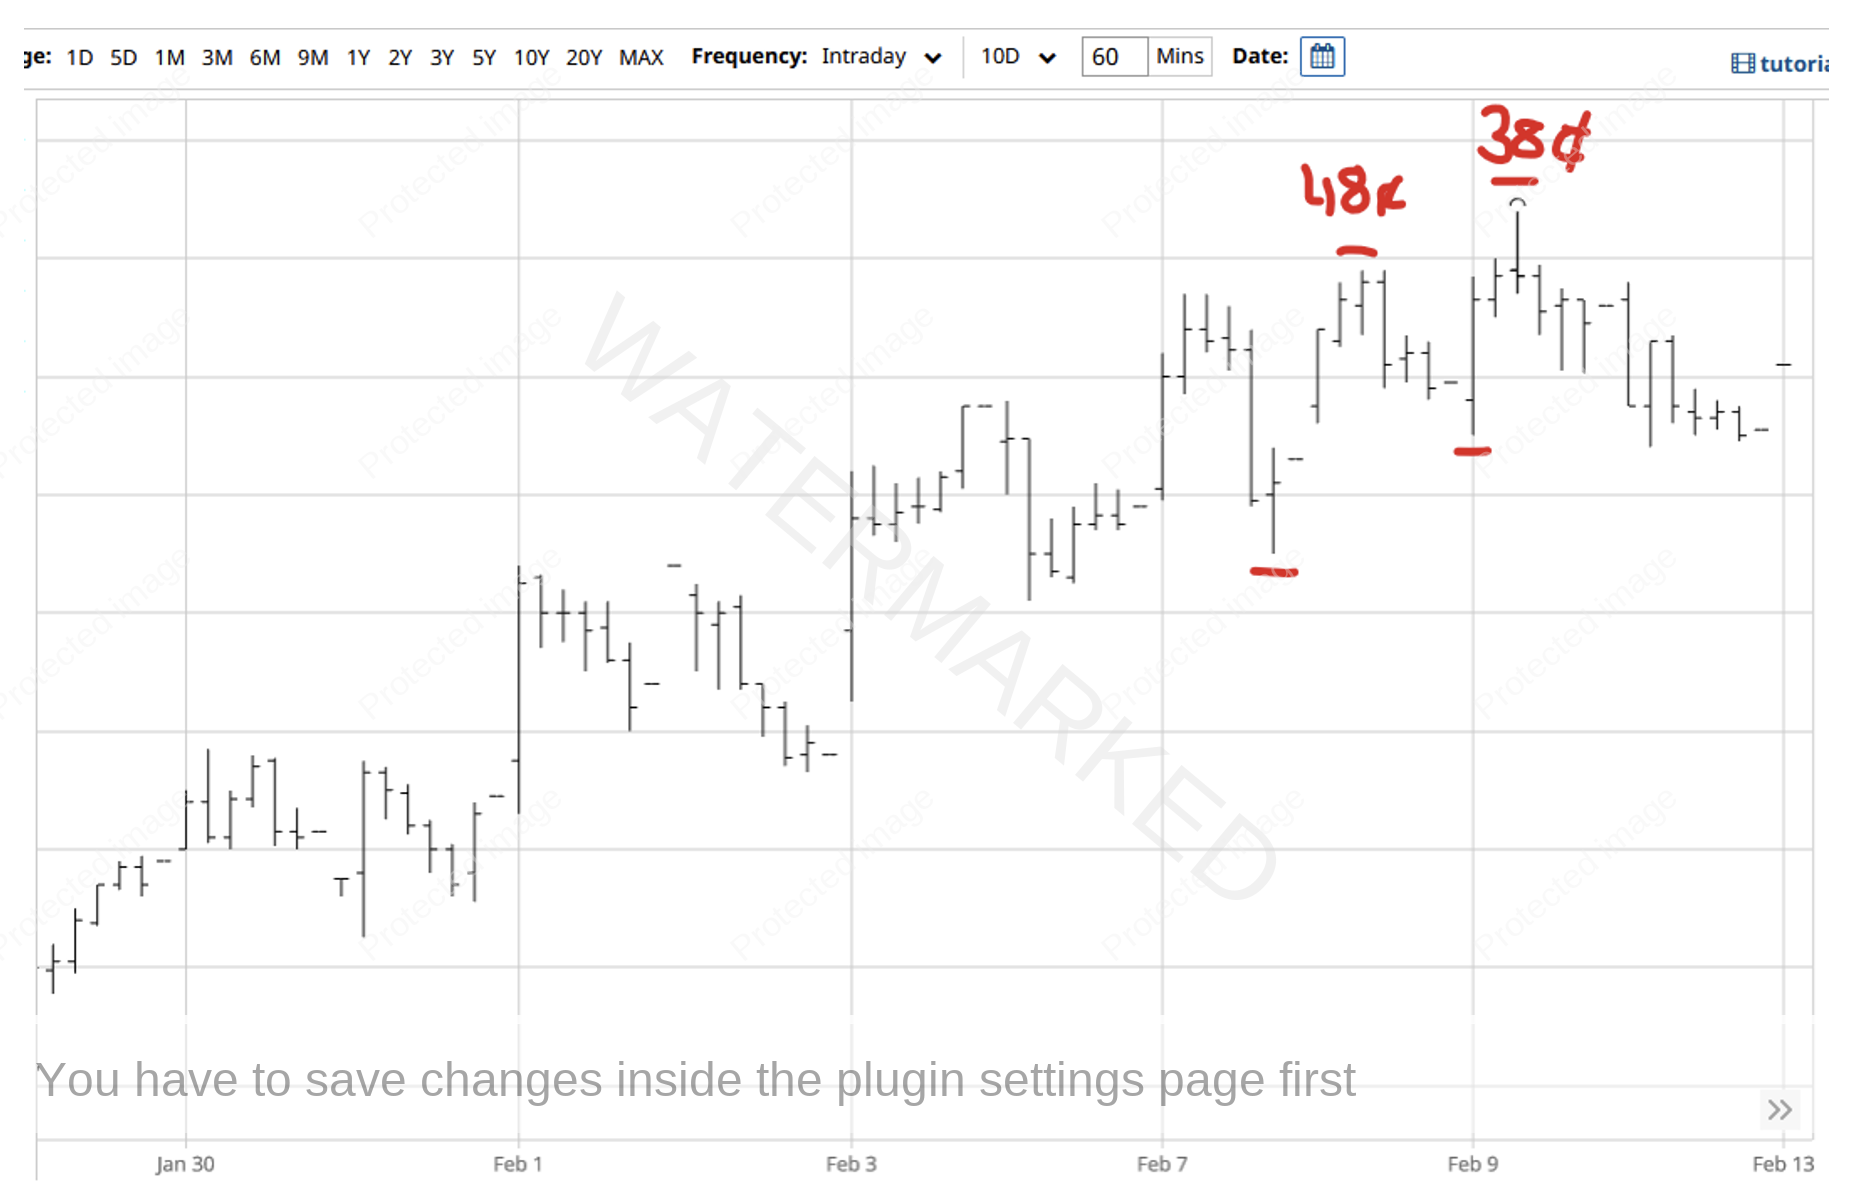
Starting from the daily swing low on 31 January at $ 24.85, there was an initial 4-hour FRO of 63 cents. The 150% milestone of this range gave a price of $26.07 (within one point of the top!) The next 4-hour swing range was also 63 cents. The 100% milestone of this range gave a price target of $26.05. From there on, there were three, contracting 4-hour swing ranges into the top. See Chart 8 below.
Chart 8 – 4 Hour Milestones
With contracting 4-hour swings into the top you can drop down another time frame to an hourly swing chart. As you’ve probably noticed, the final 1-hour swings are the same as the 4-hour swings and both show a final contracting swing range.
Chart 9 – 1 Hour Ranges
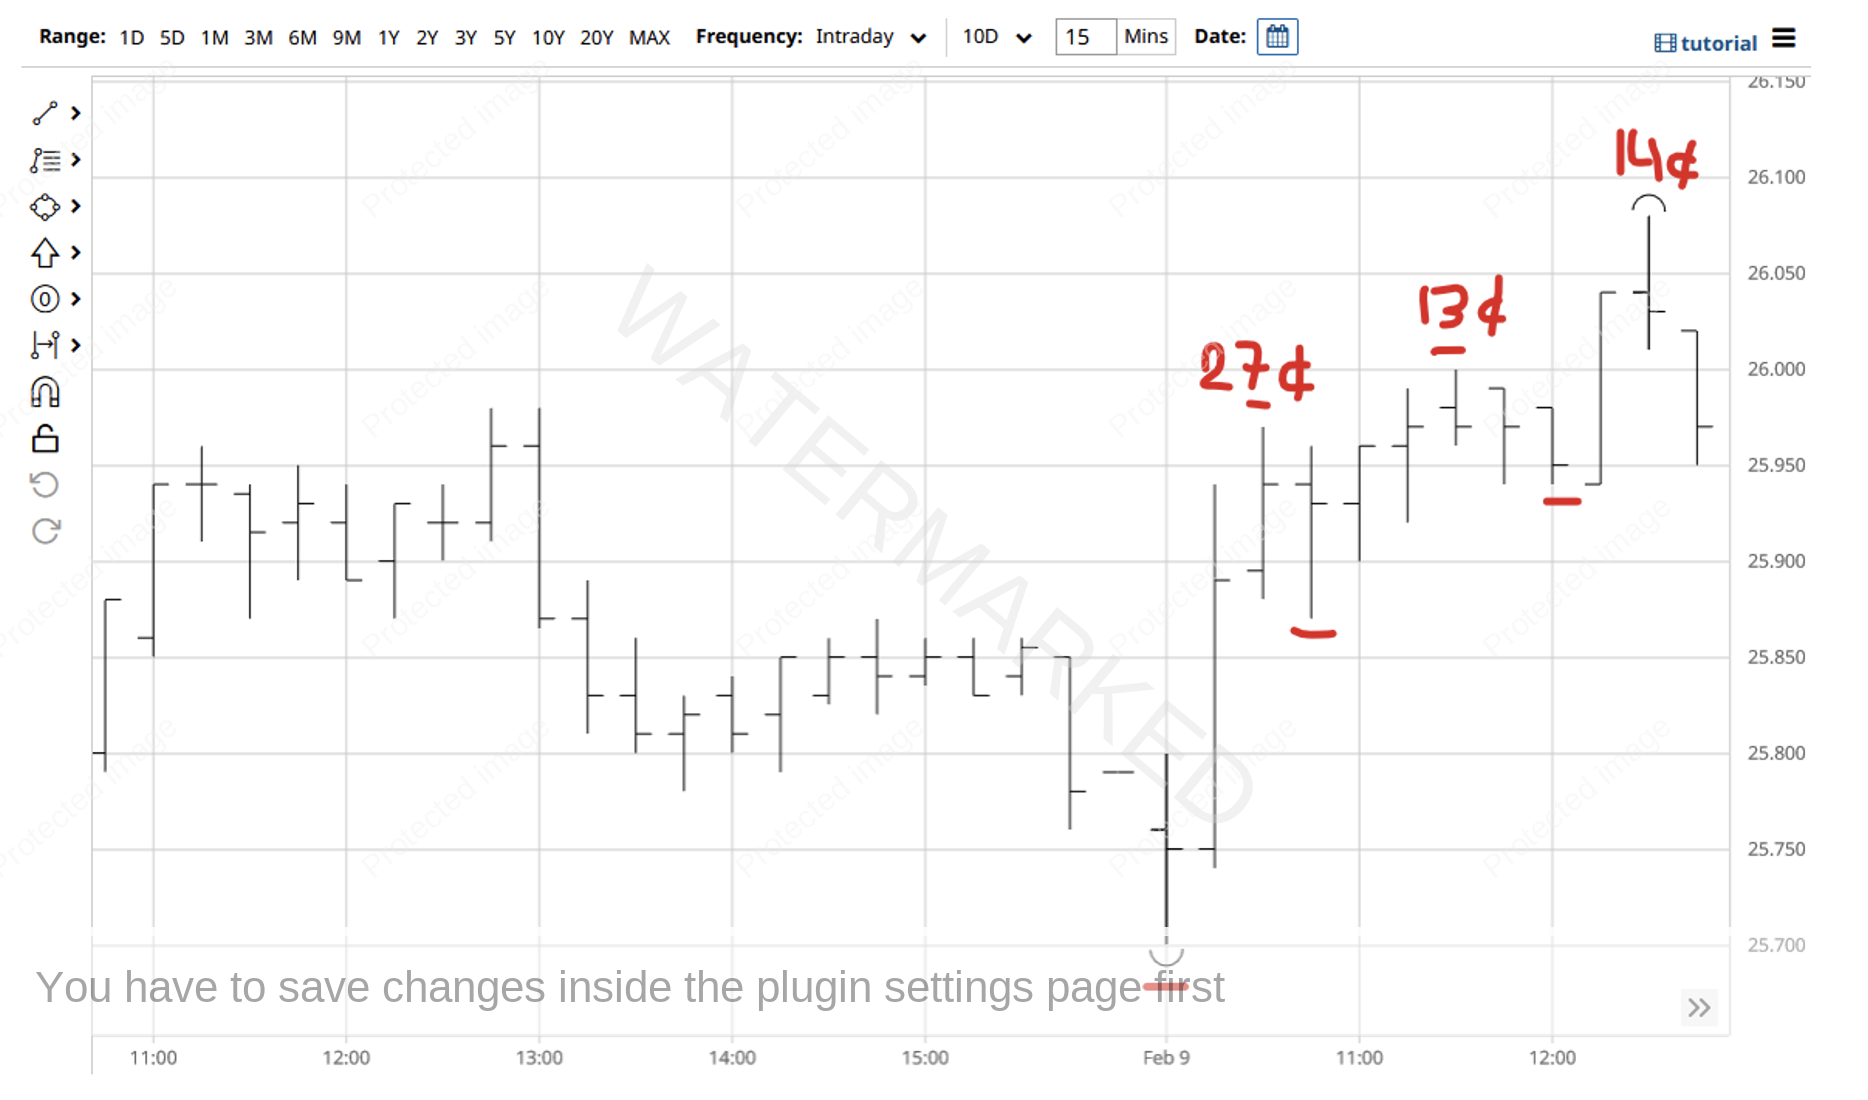
This last 1 hourly swing up had its own three swing ranges on a 15-minute swing chart, with the final swing being within 1 point of an exact 100% repeat into the top.
Chart 10 – 15 Minute Ranges
This is a terrific Double Top example and a great trading opportunity. One aspect that makes it a great example is the cluster and the clean false break of the original top at $26.02.
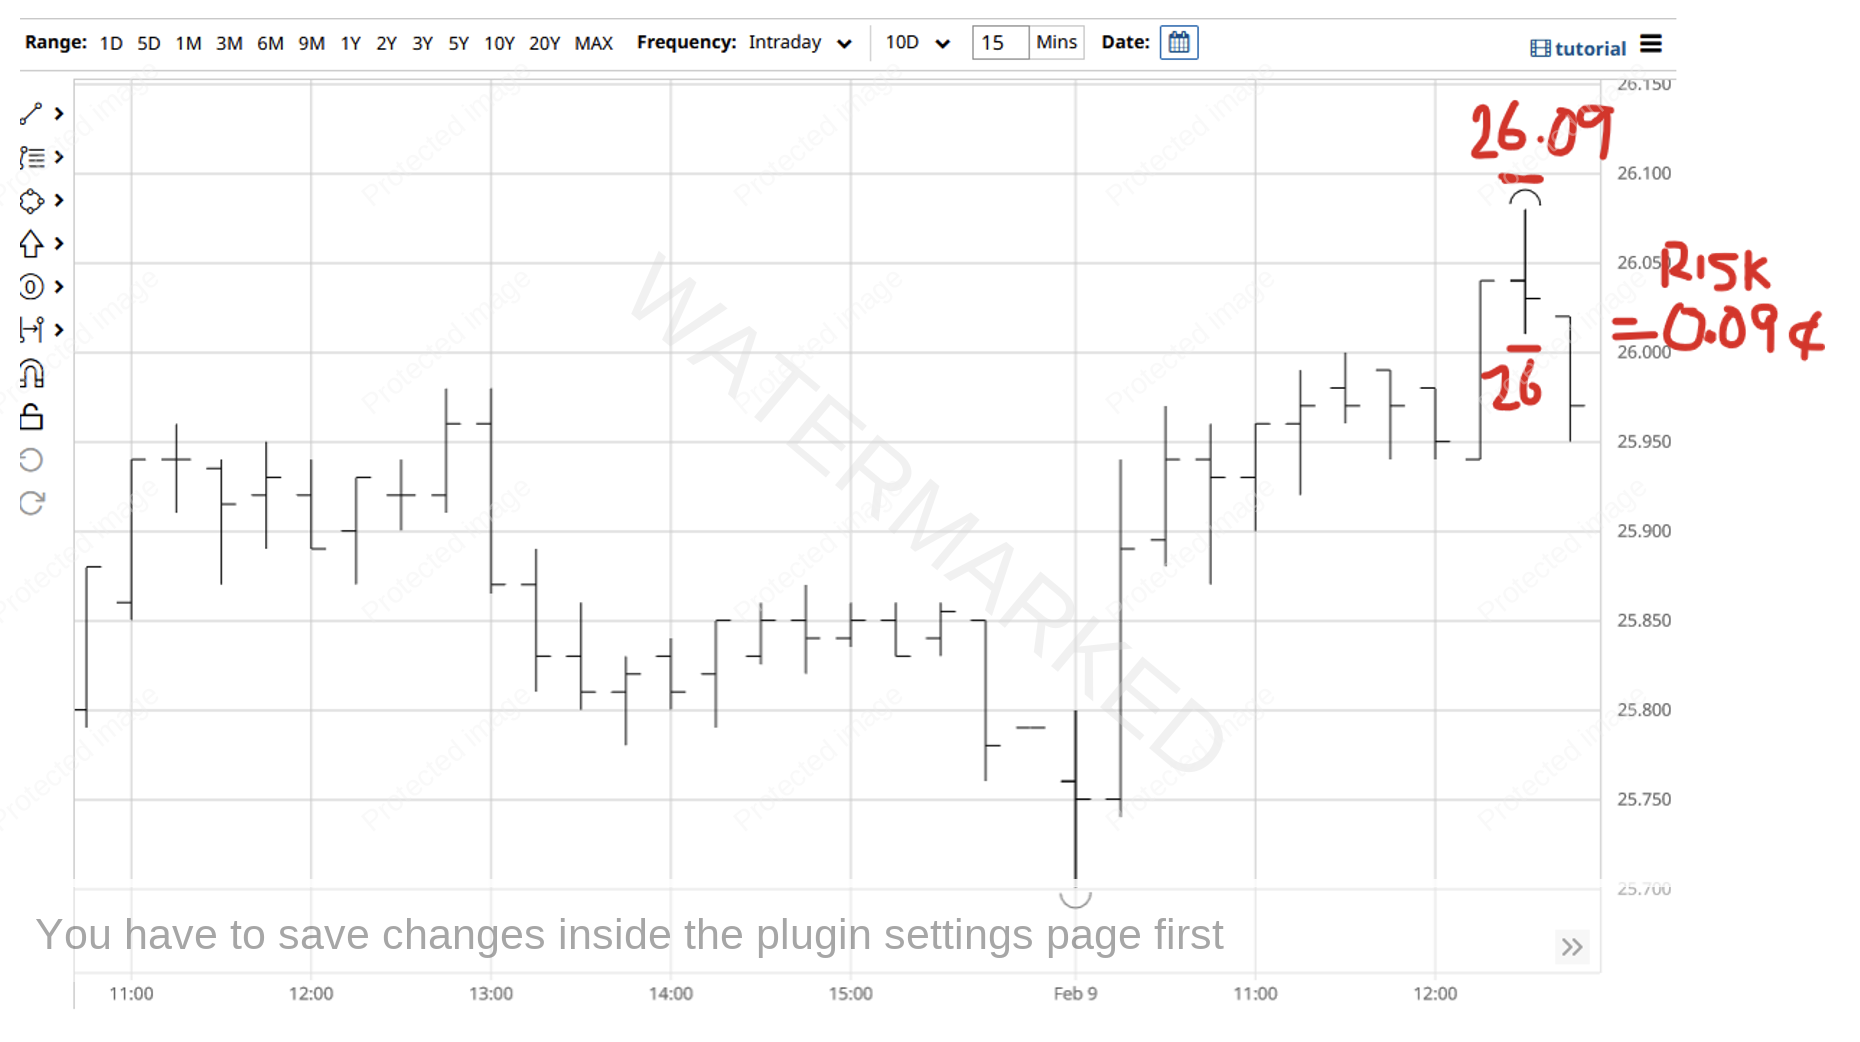
If you had entered on a 15-minute swing chart after the market had false broke the original top, entry would have been at $26.00, 2 cents under the old top, with 9 cents of risk! There was also a nice signal bar on the 15-minute bar chart that closed below the open of the bar and below the previous bars close.
Chart 11 – 15 Minute Swing Chart Entry
It’s fair to say that with 9 cents of risk, this trade has the potential for a very high Reward to Risk Ratio (RRR)!
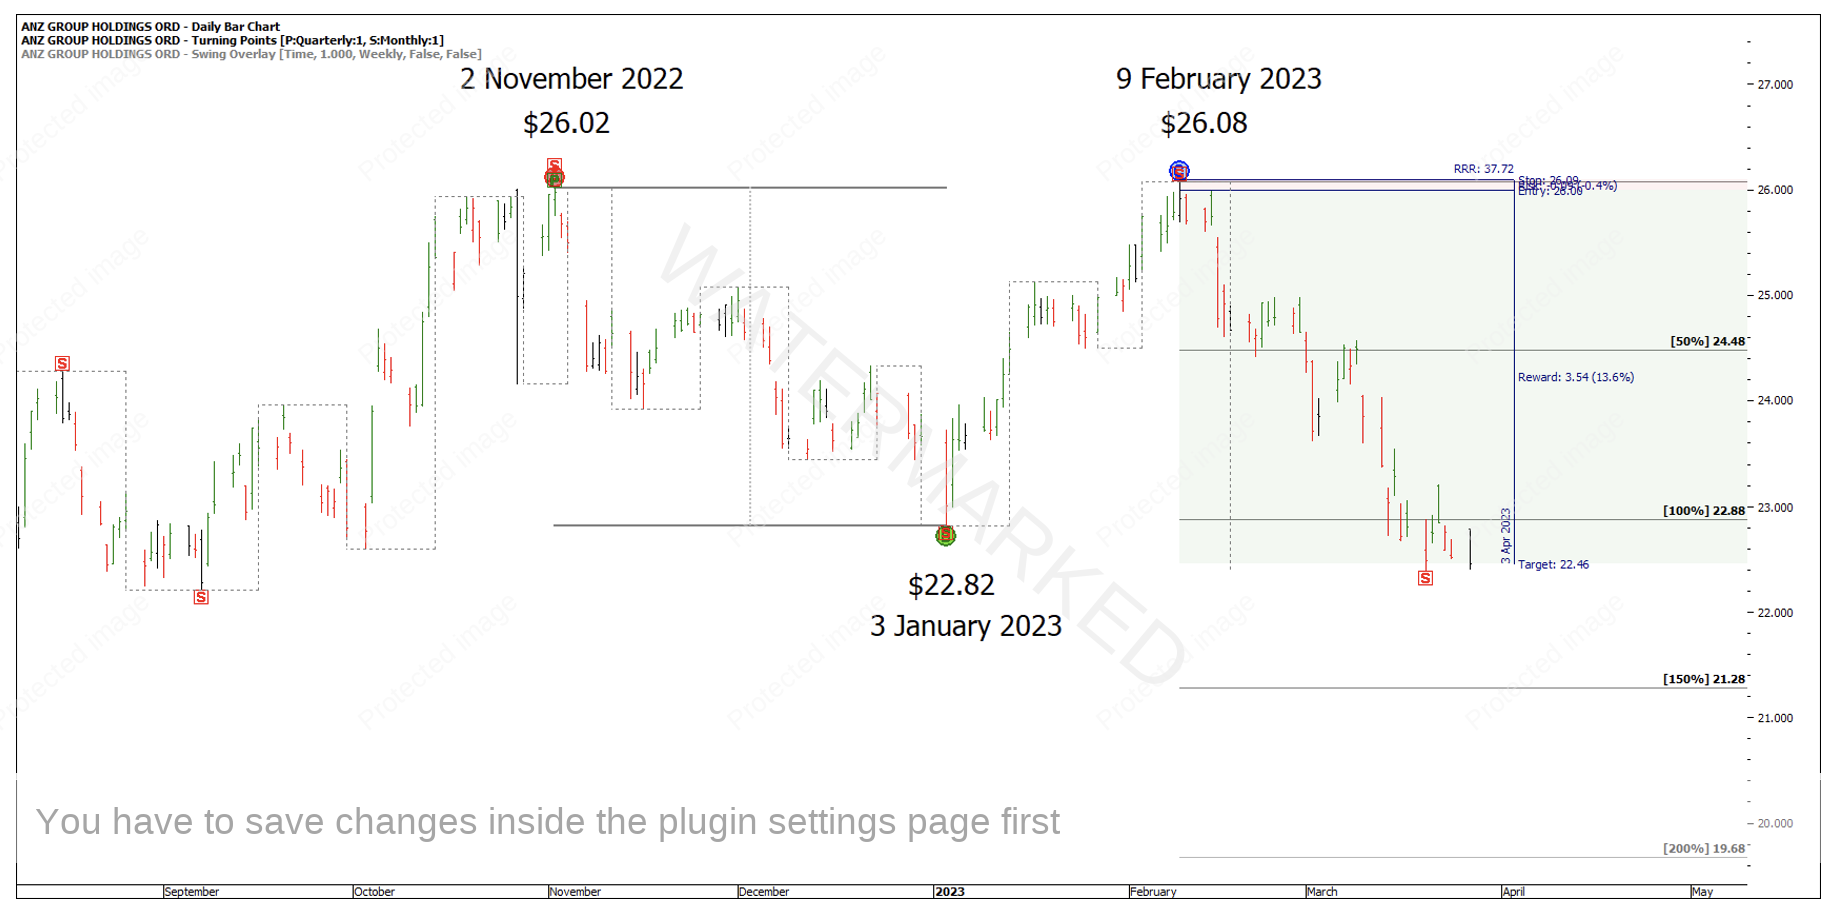
At the time of writing, this trade sits at 37 to 1 RRR on an initial position.
Chart 12 – Current Risk to Reward Ratio
If you were using a trailing stop strategy behind 2-day swing tops for example, you would have a 29.5 to 1 RRR locked in.
Chart 13 – Trailing Stops 2 Day Swing Tops
Even if you don’t trade ANZ, it’s a great example to go back over and apply the techniques to learn the key points this example has to offer.
Happy Trading,
Gus Hingeley
