More Natural Gas!
This month is another look at Natural Gas. I’m currently enjoying a holiday in the East Kimberley and haven’t looked at any markets since this time last month, so this is a review and update for me as well!
Last month I looked at the SpotV, July contract month and the Spot1 charts on Natural Gas. This month I also want to add a fourth chart into the mix and look at the next contract to come on line which is August, NG-2034.Q. This is the ProfitSource code and for some reason quotes the year 2034, whereas the contract is actually 2024 as you can see in barchart.com.
Starting off with the SpotV chart, this shows a big expanding monthly Time and Price range up and is bigger than the previous three in that direction. W.D. Gann says to measure against the last three ranges. Also, running Gann Angles from the 20 February 2024 low sees the market is running above a 1×1 and has found that as support. That also shows that this market is showing signs of strength.
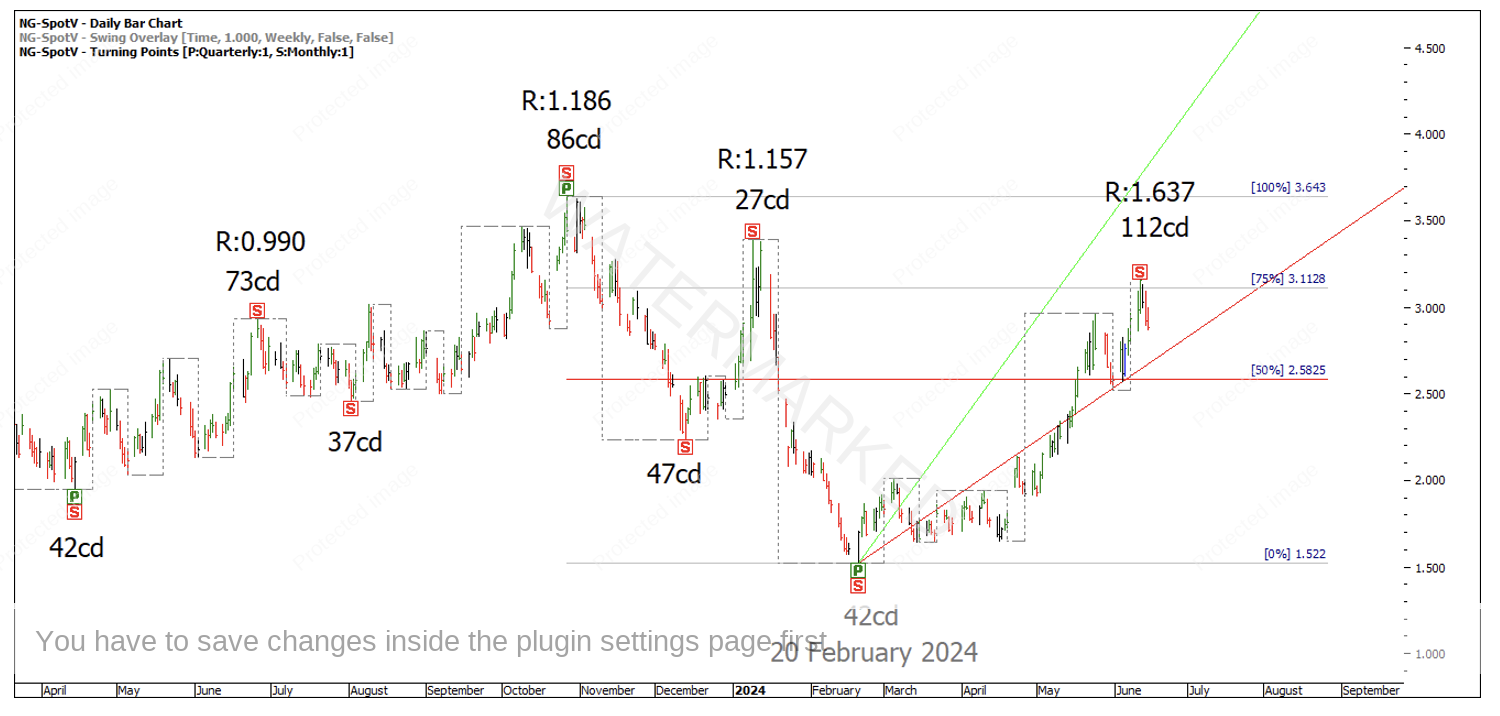
Chart 1 –NG-SpotV
Looking at a Ranges Resistance Card of the current quarterly swing, the last weekly swing low sits on the 50% retracement and has currently topped on the 75% retracement level whereas the Spot1 chart shows a later low on 26 March which makes the run up at about a 2×1 angle. See Chart 2 below.
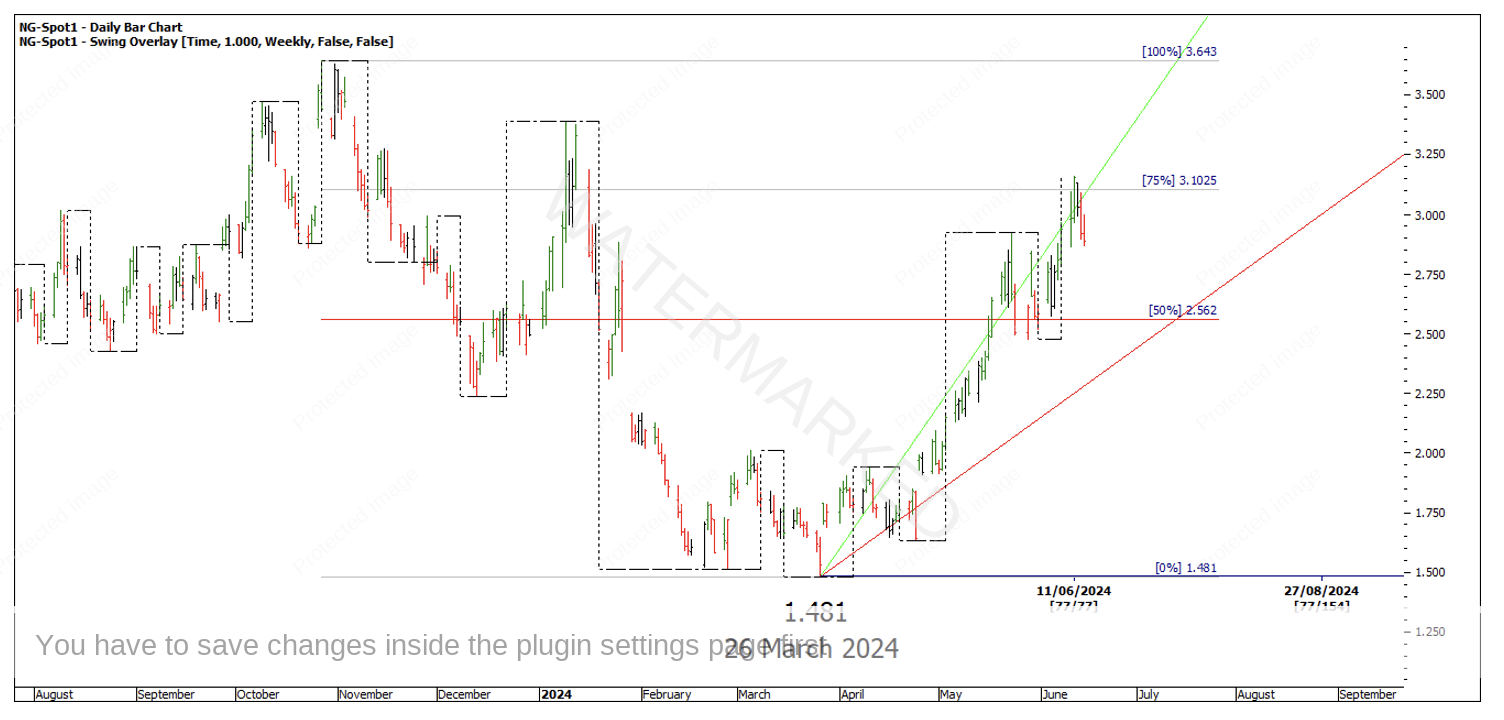
Chart 2 – NG-Spot1
Now the current July contract, (NG-2034.N in ProfitSource) shows a much different story, and this is where it starts to get tricky. As you can see below, the 11 June top is a lower top and well under the 1×1 Gann Angle from the 15 February low. The last day of trading shown below also shows the market gapping below the 50% retracement so that to me is three signs of weakness.
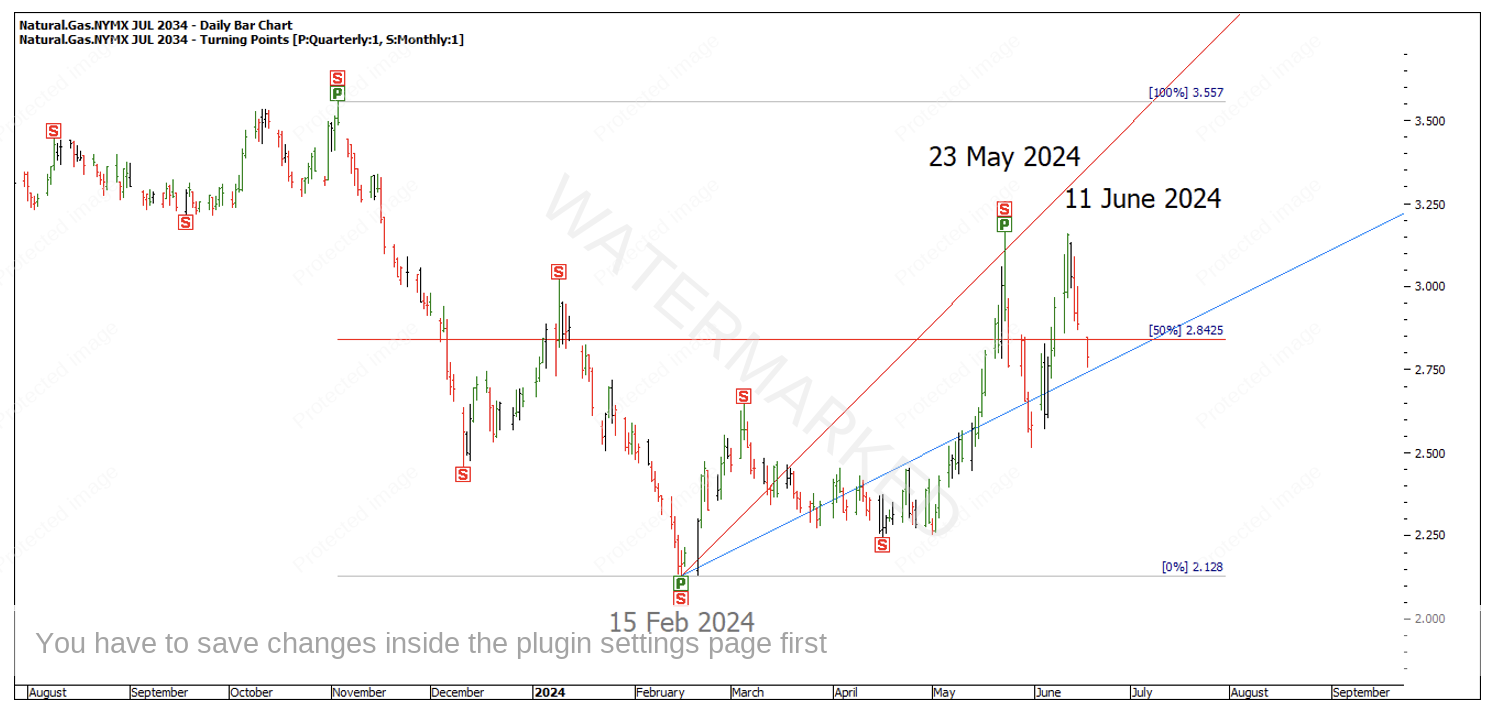
Chart 3-NG-2034.N
Last is the August contract which will be the next contract once July expires. This shows double tops with a false break on 11 June. There is still a gap down that has closed below the 50% retracement.
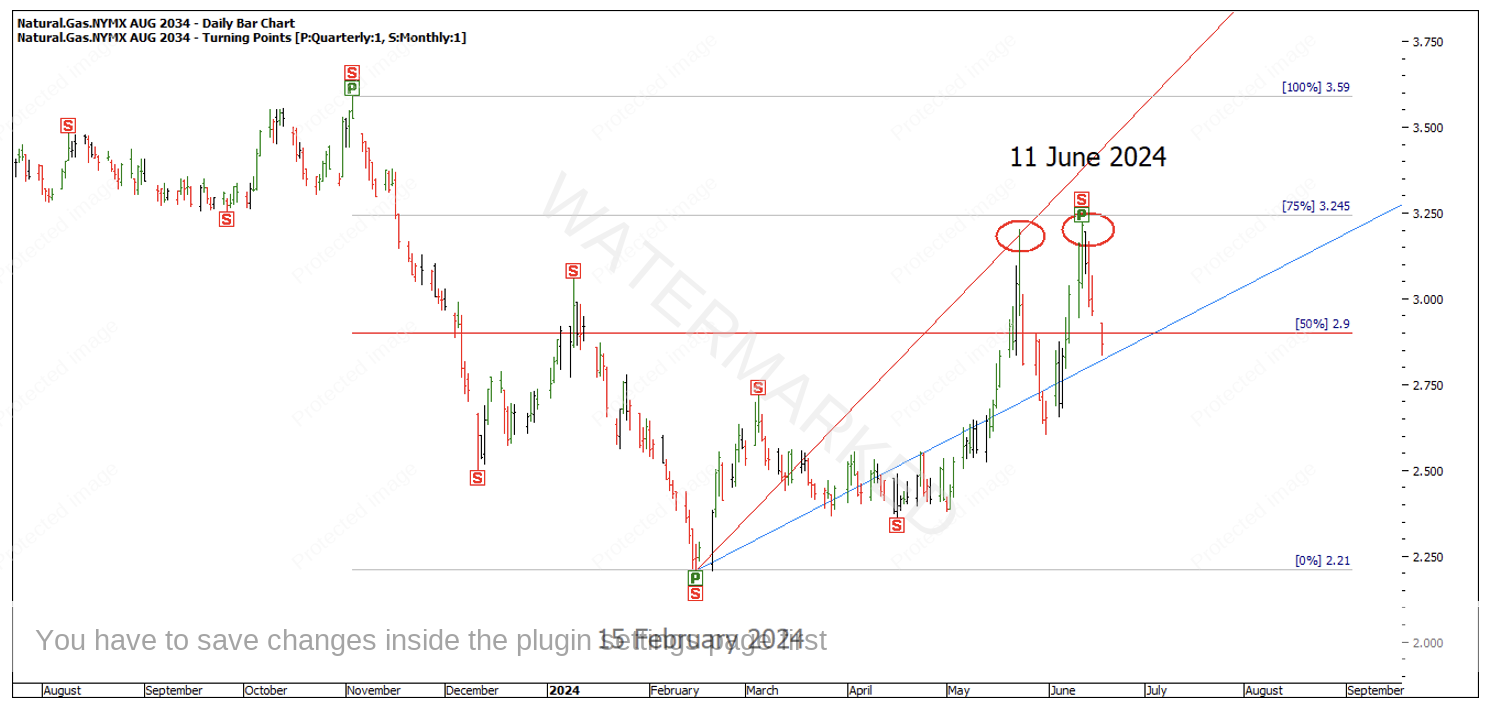
Chart 4 – NG-2034.Q
So, to recap, the Spot1 and SpotV charts show that Natural Gas in a position of strength and the two contract months show that Natural Gas is in a weaker position in comparison to the 1×1 Gann Angle and the 50% retracement.
If we continue analysing the August contract there are three weekly swings within this monthly swing and a Double Top on 150% of the previous monthly swing range or First Range Out. The third weekly swing up of 616 points is a contracting price swing and 50% in time of the previous weekly swing up.
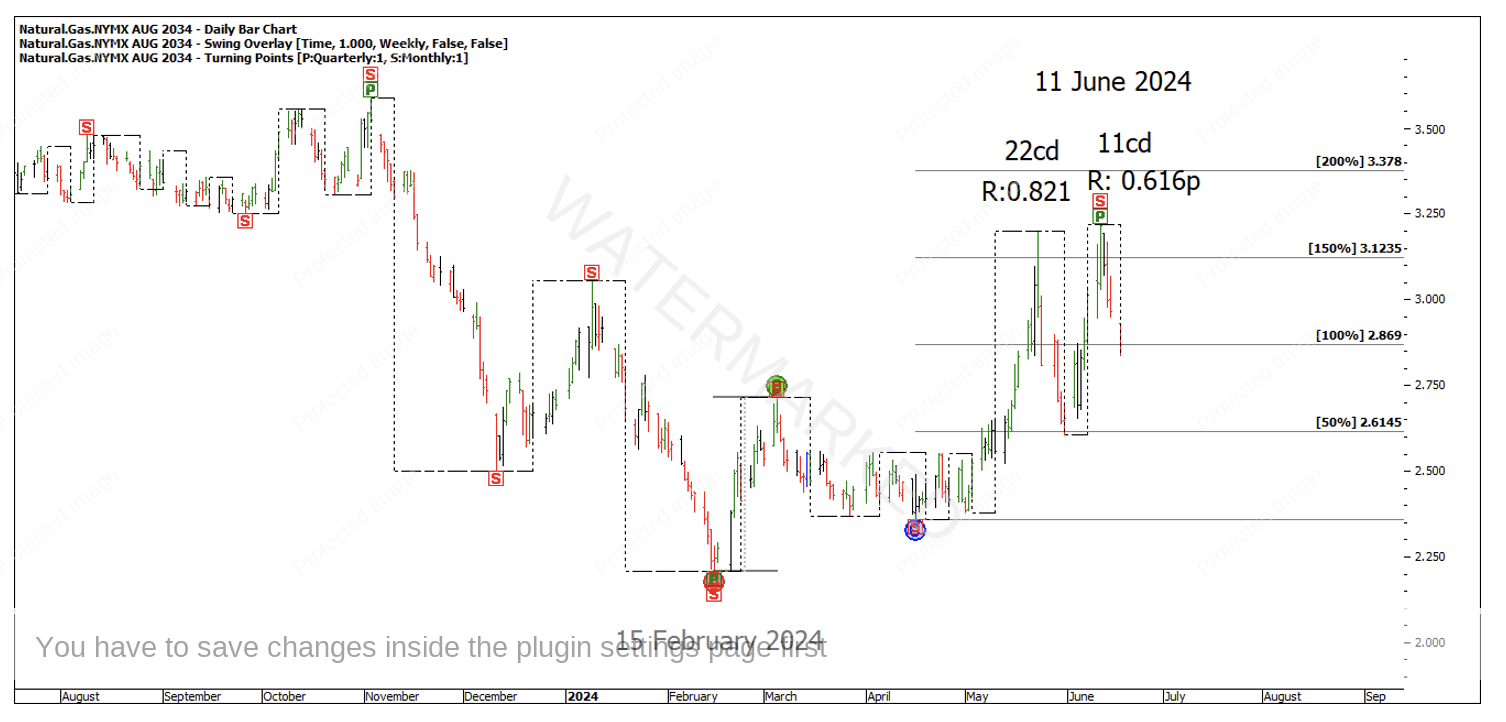
Chart 5 – NG-2034.Q
This suggests to me that this monthly swing up is probably finished, and we now have to determine if this is just a monthly pull back and we look for a potential trading opportunity to get long or if the 11 June top is a quarterly Point C and if we are now looking for short trades.
Either way, you also have to decide which contract month to trade. The July contract has the largest volume and the most liquidity which would definitely be the best for short term trades. For longer term trades potentially the August contract could keep you in longer. Either way, keeping an eye on all of them can help you make an educated decision.
Happy Trading
Gus Hingeley