Movers & Shakers
With the weather warming up it’s getting a bit easier to walk to the local café in the morning, and after a few weeks of observing Sugar, Coffee & Soybeans, our morning cuppa is getting a bit easier to understand. This month we continue our journey into these three commodities, with some good current market action for us to learn from. As you’ll see below from my previous article, I gave us some homework.
- Keeping on top of Soybeans and watching for any trading opportunities.
- Learning to work with the gaps in Coffee.
- Keep ‘sowing’ a little further to see if this was just luck or does Sugar have more to offer us.
Soybeans
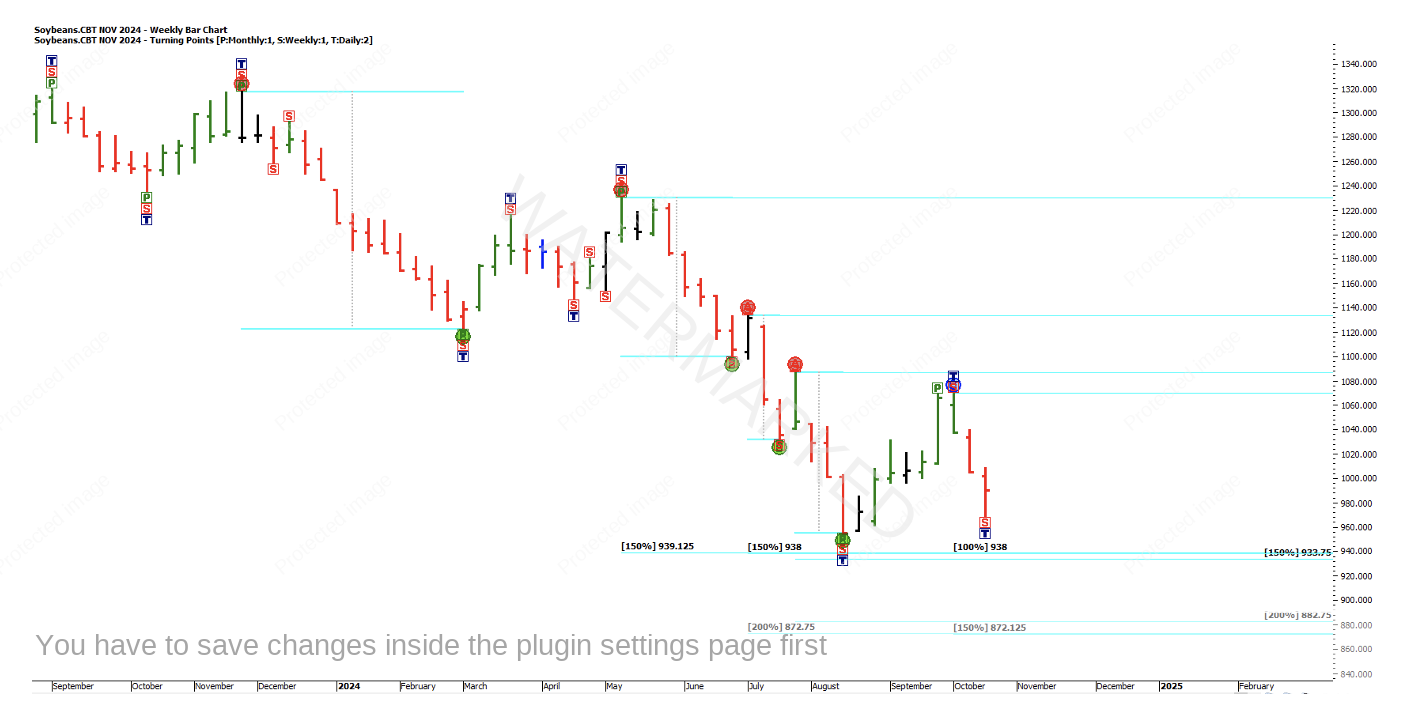
On the weekly chart below, it looks like we may have a bit more to go before we find a bottom.
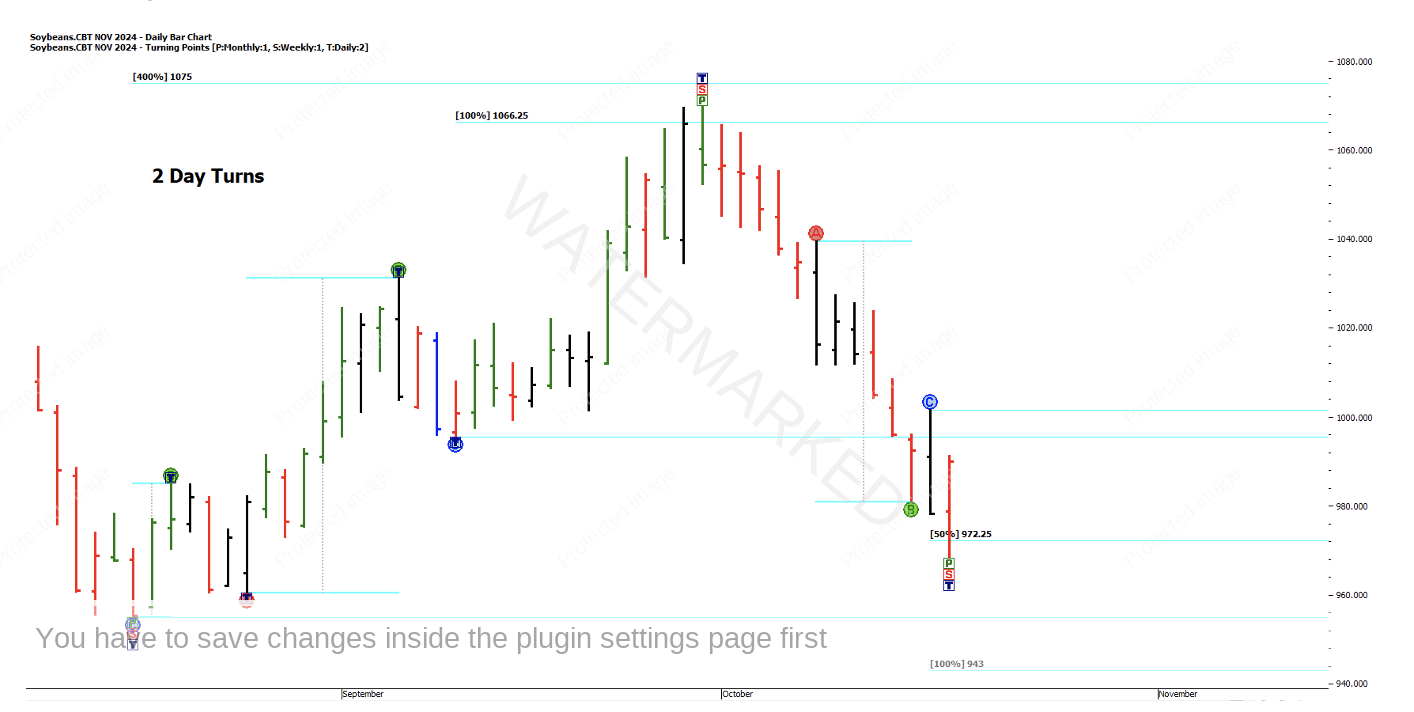
The current weekly swing down has been quite sharp but looks like it needs a pullback before resuming its journey. We can see below no real cluster to match our weekly chart yet…
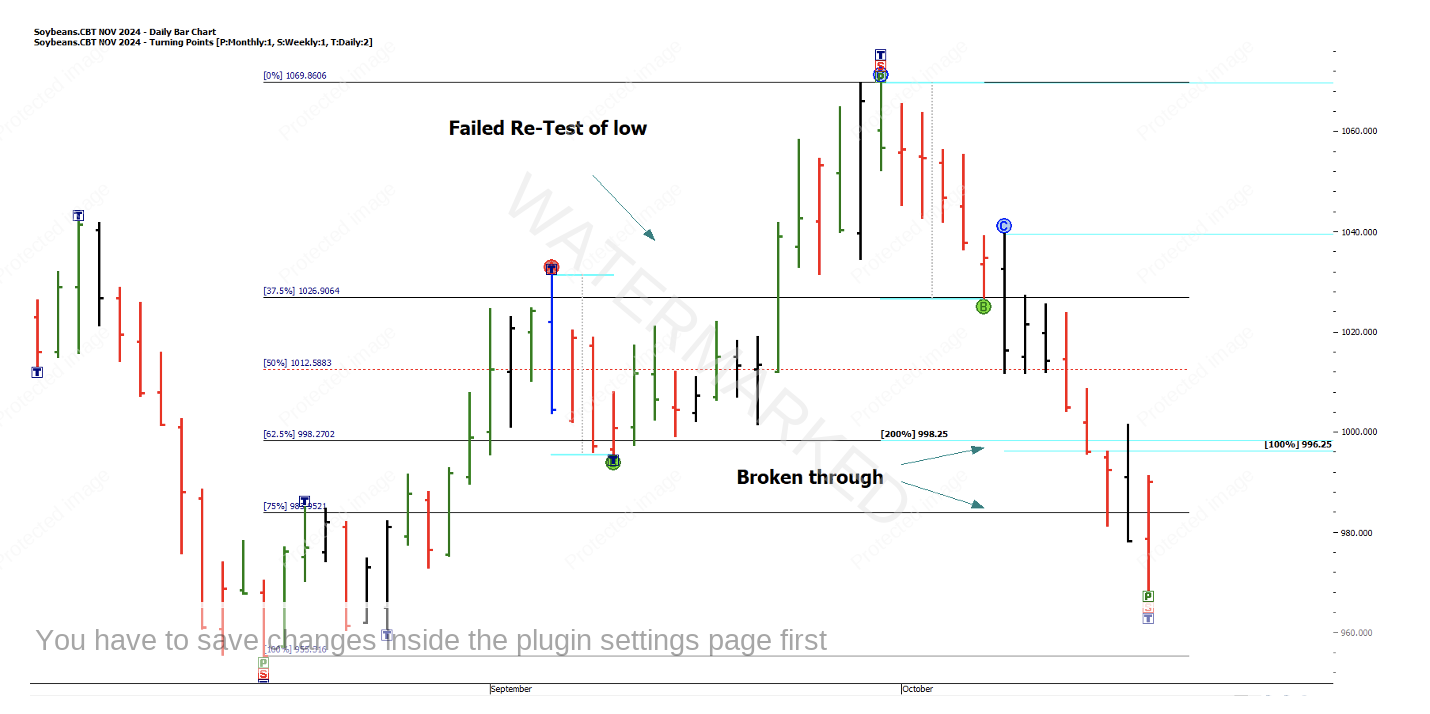
In the next chart we see a cluster on the 62.5% retracement where the market could have stopped and turned up, but it broke through 200% of the previous 2-day range and a 100% repeat of the daily first lower swing top. Note: we have also broken the 75% resistance level.
So let’s watch Soybeans over the next few weeks to see if it can get down to one of our clusters and how it reacts if/when it gets there.
Coffee
Firstly regarding our homework, let’s have a look at trading with the gaps:
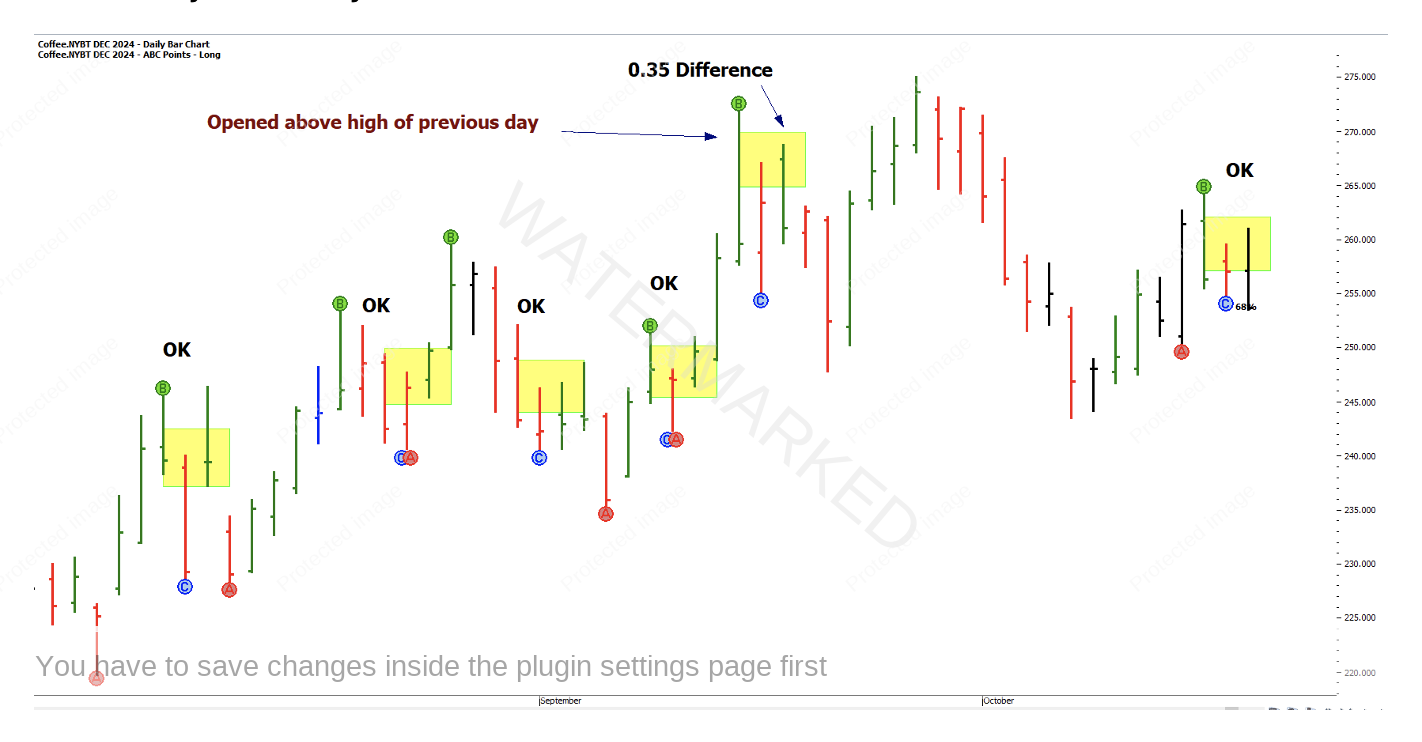
In the December Futures chart below I have highlighted the ABC Long’s since the August low, to see if the gaps would have hurt us in any way, when trying to enter the market. My ABC entry limit is set to 50% for the sake of this exercise.
So out of 6 ABC Long trades, 5 of the trades would have let you enter 1 tick above the top of the ‘Point C bar’. The one trade that gapped 7 ticks above would have you in 6 ticks above your intended entry point. 1 tick = 0.05 which has a value of $18.75, x 6 = $112.50. This scenario would need to be covered in your trading plan. We haven’t tackled intra-day entries as I think more often than not you would need to be present for those, or close by? We can delve a little deeper into the world of gaps as we progress, if needed.
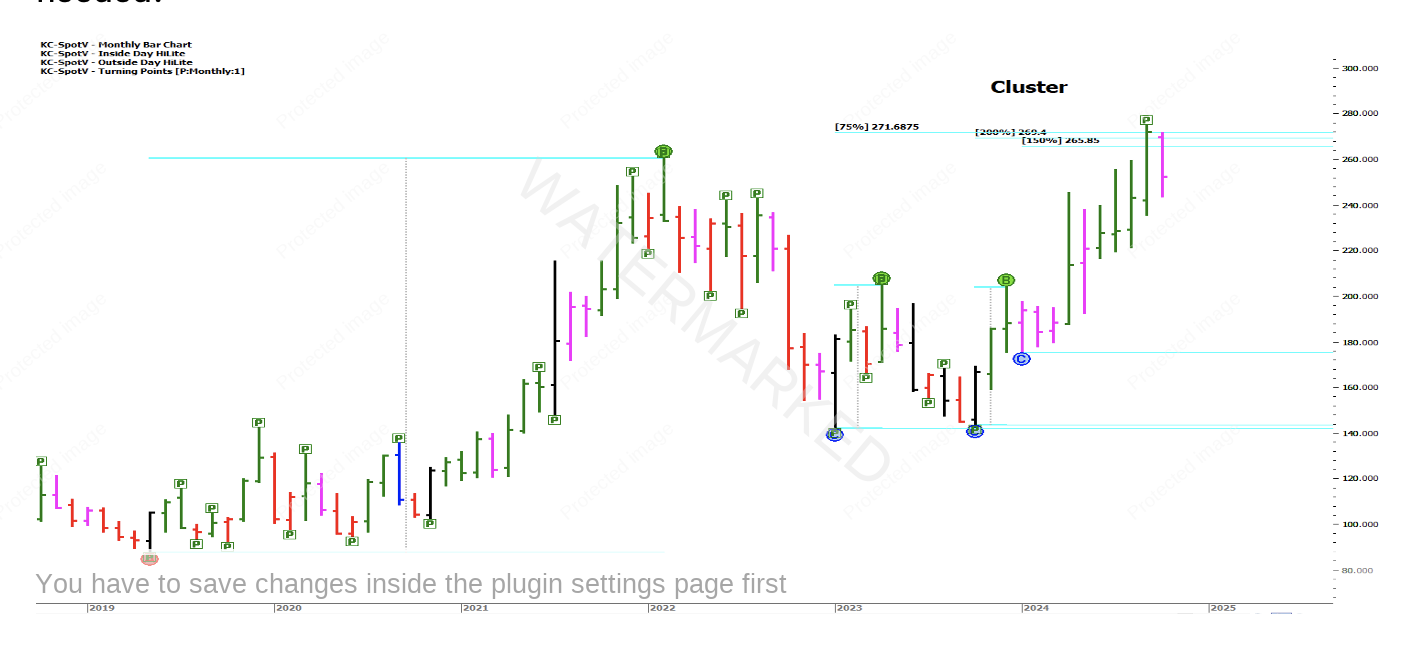
In the chart above I have used the Monthly Spot-V chart on Coffee for an idea of the big picture.
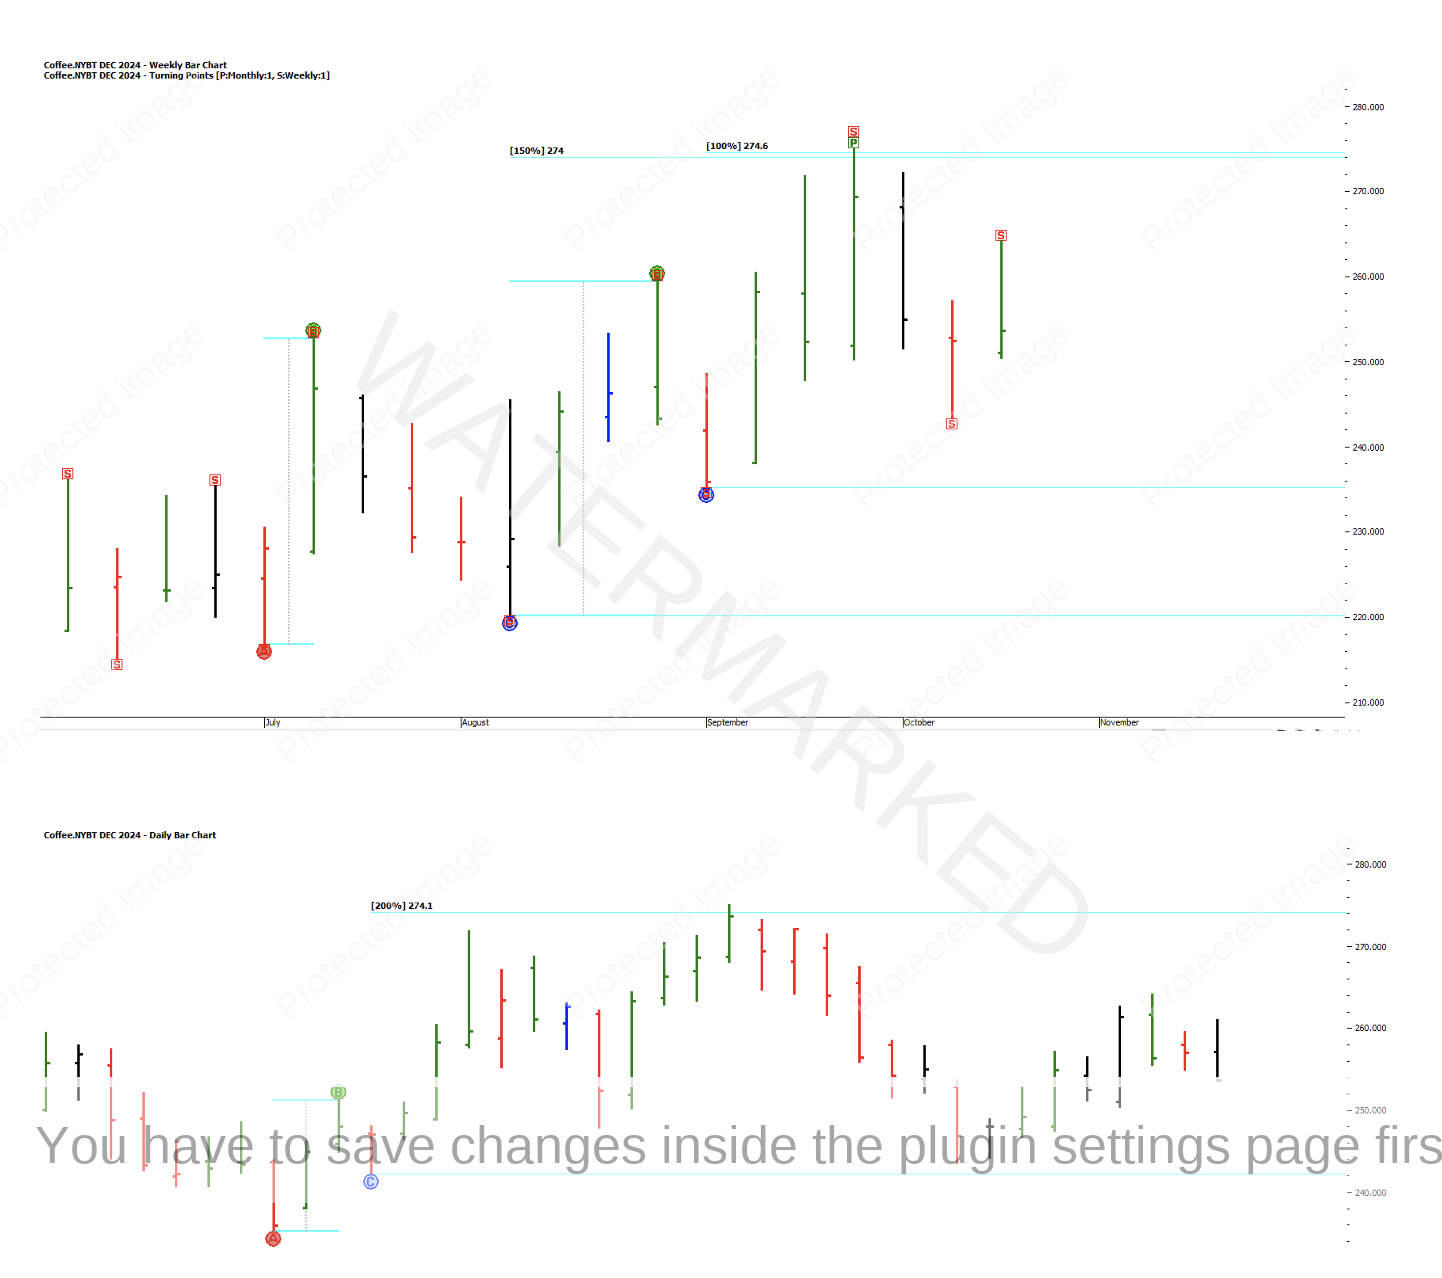
So a few reasons for a top there, albeit with a 75% milestone thrown in. Here in the charts below I have gone back to the December contract with the weekly chart chipping in with its cluster, followed by the daily chart and a 200% milestone…
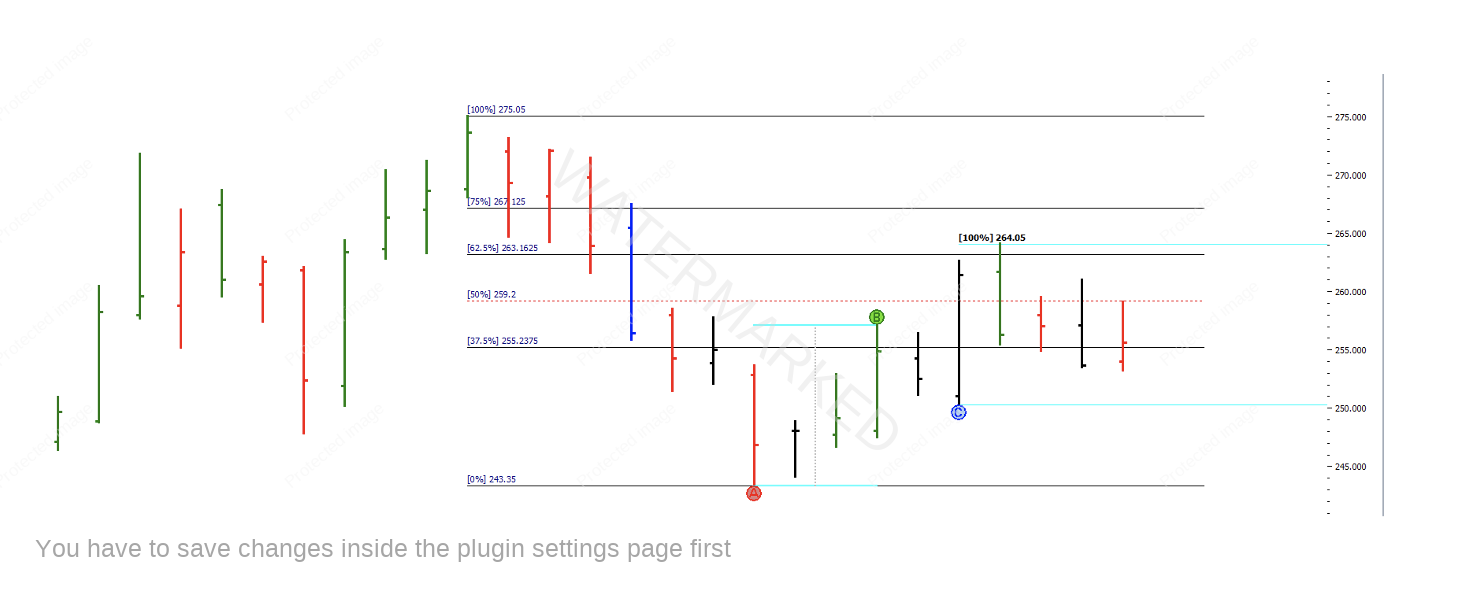
In the chart below, you can see the retest of the top and a 100% repeat coming together nicely.
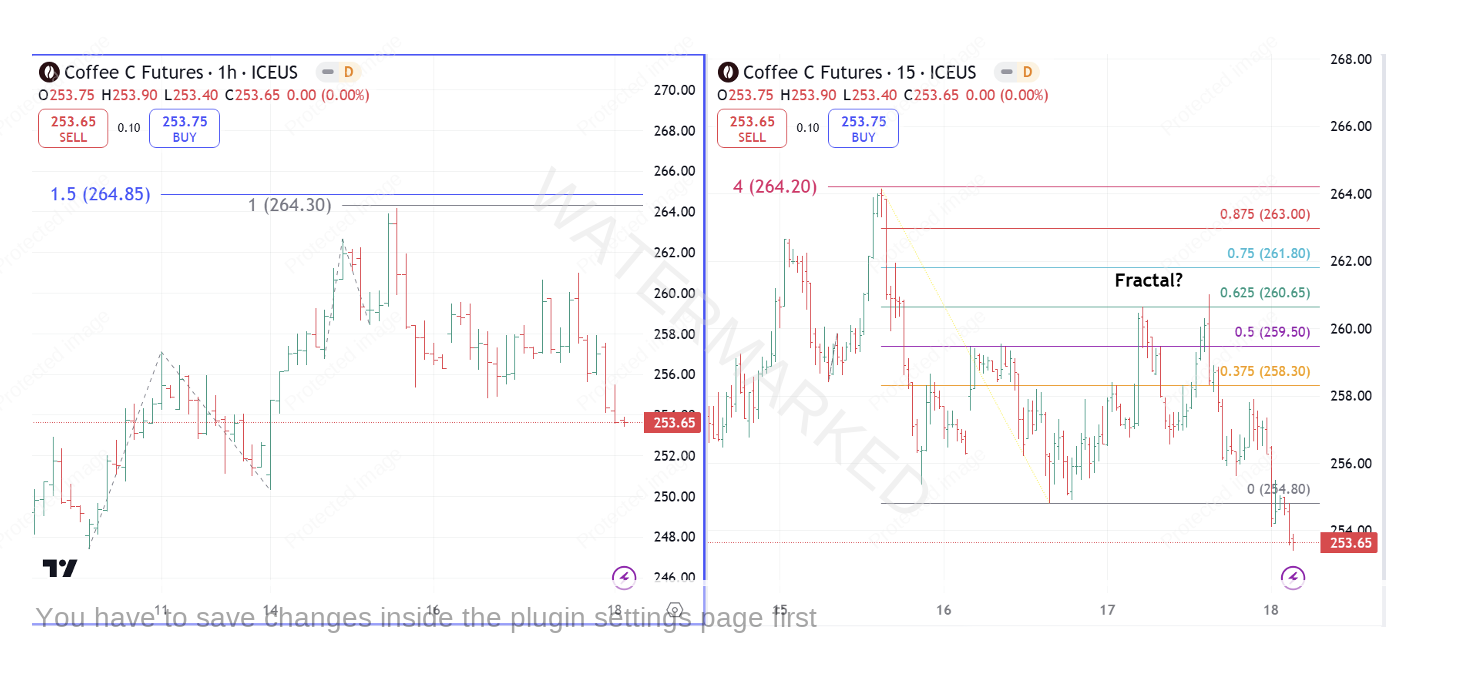
Due to the relatively short trading days, when looking at Coffee intra-day, I’m using the 1 hour and15 minute charts. We didn’t quite reach our intra-day targets, but they do put us on alert for a top.
Here we have a retracement just beyond 62.5% as we did on our daily retest. (a retest inside the retest, at the same resistance level!) Hence the ‘Fractal’ comment on the chart.
The 1 hour bar at the top was 85 ticks. Risk: 87 x $18.75 = $1,632
The 15 minute bar at the top was 17 ticks. Risk: 19 x $18.75 = $357
Food for thought, with some of those hour bars being quite big. Anyway the short on Coffee is looking good at the moment. If we repeat our weekly First Range Out then we will have travelled 632 ticks! I’ll leave you to do the maths.
Sugar
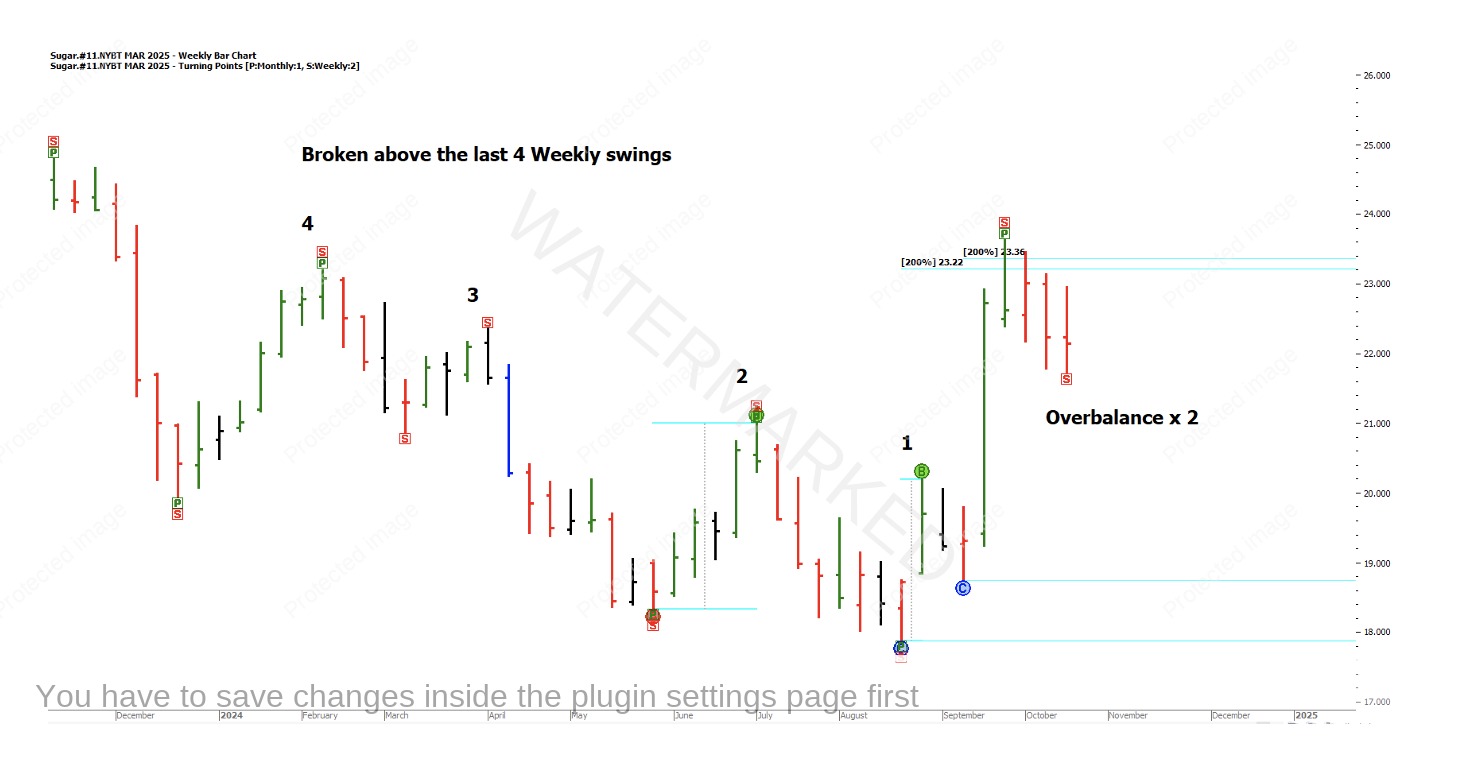
The weekly chart above shows us overbalancing the last two up swings and breaking the previous 4 weekly tops.
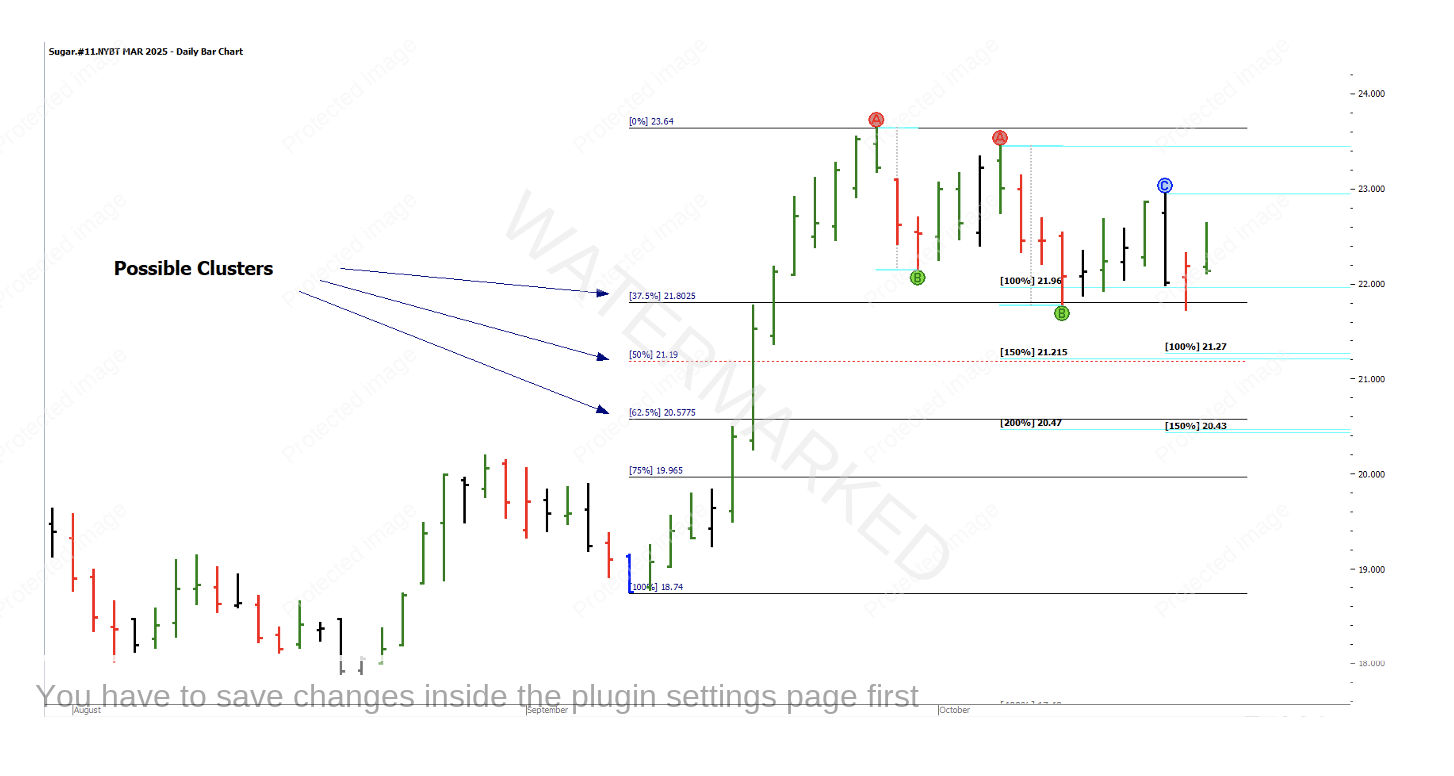
We can see in our daily chart below we don’t have a retest, but we do have a retracement of 37.5%. This level has a 100% repeat into a small Double Bottom currently. Note; there are two more clusters waiting if we break through.
The weekly trend is up with a strong move out of the first higher swing bottom, followed by a sluggish B-C Range!
Possible bullish move to follow? I’ve highlighted some areas to watch this week. See below…
Personally, I like these three markets as it’s a refreshing change for me and they are active and do have some energy about them. It is Monday, October 21st and I’ve tried to keep these charts as up to date as possible, but by the time you are reading this, they will have moved a little. So please check out the current situation to see where we are today.
Homework:
- Have a look at the pros & cons involved in trading these Futures markets.
- Dive a bit deeper into whether you can live with being 10 mins behind the live data all the time?
- Track any trades that come your way on our three moving markets.
- Check in on our ‘Sleeping giants’.
Darren Young
Careful, it’s addictive!
