Newmont – Small and Big Picture
Markets and charts are like good books, when you are focused and engaged with the content the more you seem to be able to peel from the pages. The main precious metal, Gold, has been one of those markets that I have never spent a considerable period trading. It has been more a hit and run relationship and from my side of the fence it has worked. I have been able to pick up the “book” at the right time, take what I needed from the story and get in sync with the cycle quickly and then be happy to walk away.
This market was one that always was of more interest to students outside of Australia and always was a topic of discussion when working with students in the US. I remember quite a few computer labs in San Francisco where gold was analysed.
It’s not surprising that I want to revisit the position of gold and ultimately NEM.NYSE as it has recently come to life in terms of a change in trend and much of this has come from the culmination of a multiyear cycle that those reading the Platinum newsletters should now better understand. It still amazes me that this multi-year cycle has come at the same time that we are witnessing a change in administration of government in the US.
Last month I discussed the retracements that NEM. NYSE had delivered and the chart showed we were about to complete a full 100% multiple of the cycle low using a Lows Resistance Card. The price of $58.84 was double the $29.42 low from February 2024.
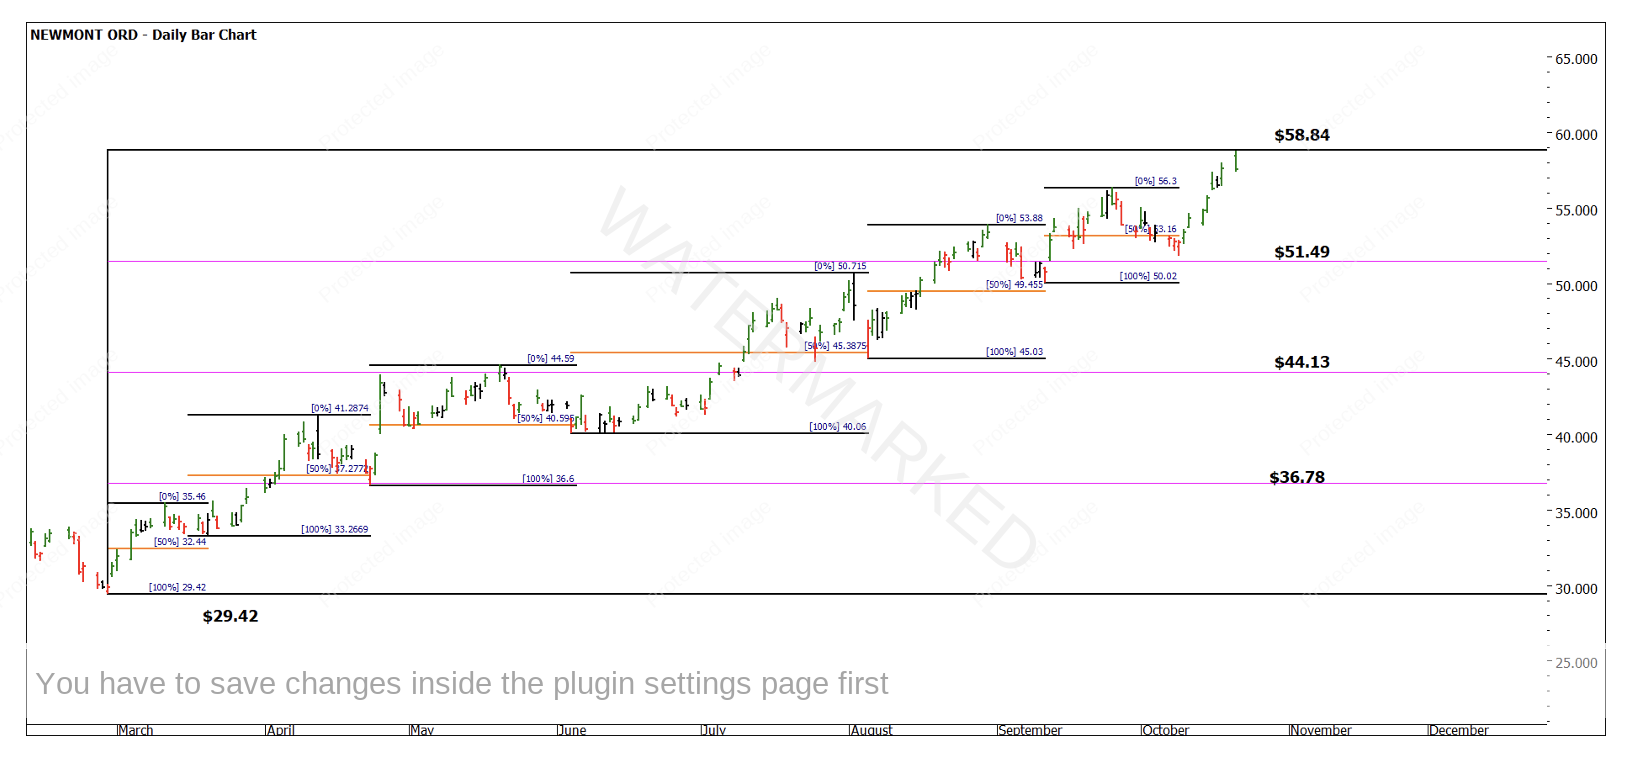
Chart 1 – NEM.NYSE Daily Bar Chart
Chart 2 picks up from this last chart, the top came in 12 cents short of the $58.84 multiple. Using the small picture to overlay some patterns we saw 100% of the previous range come in at $58.10 and this had some additional harmony with the days up and down all balanced.
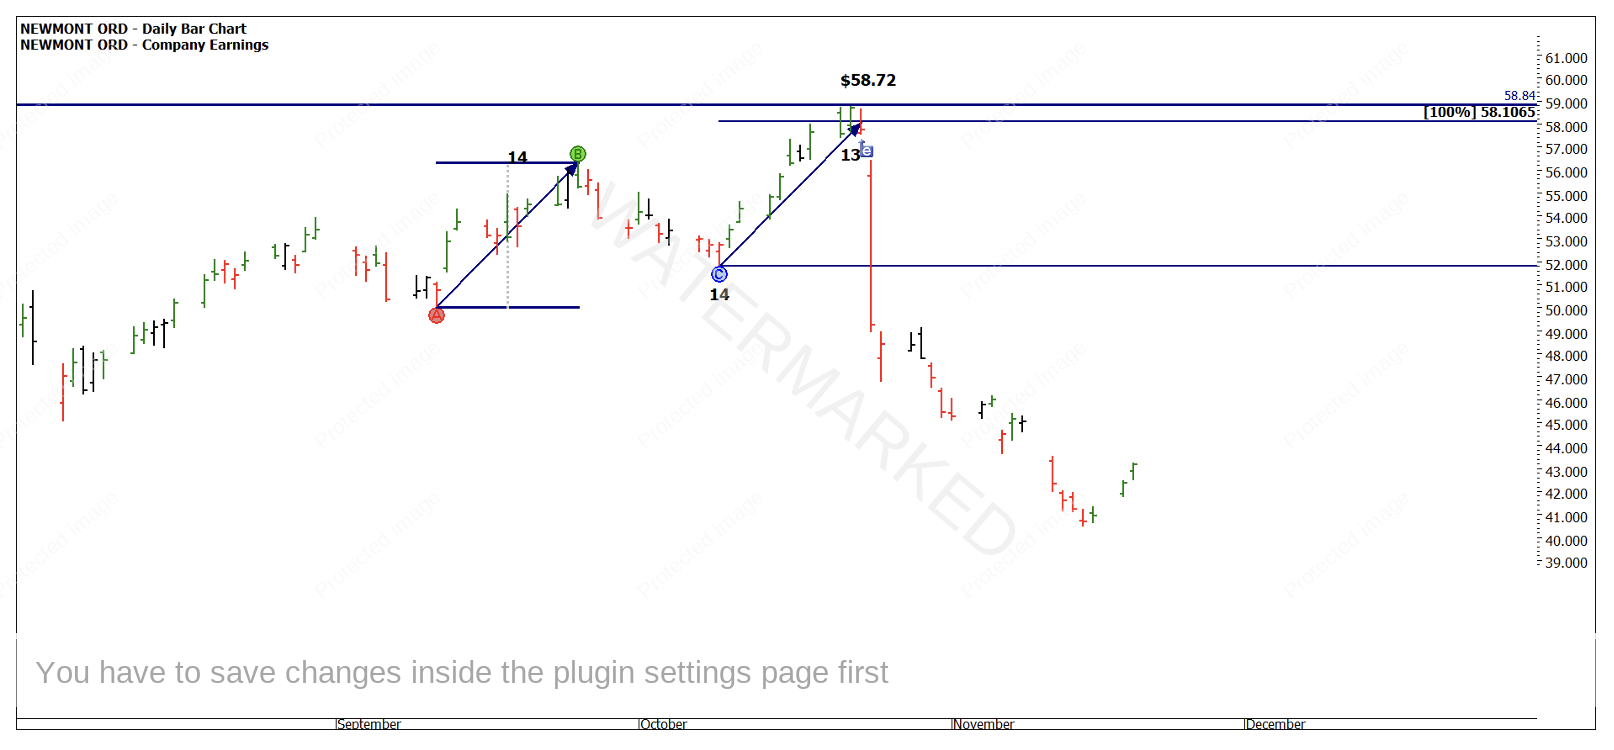
Chart 2 – NEM.NYSE Daily Bar Chart
You will also see a small icon close to the red bar before the decline. This is a company earnings marker from ProfitSource and we see that the company released earnings the day before the decline. Many in the market may draw the conclusion that a poor announcement caused the sell off. If you’re inclined to that thinking I encourage you to do the research and draw your own conclusions.
Gann said the safest place to sell was the first lower swing top off resistance. The strength of the resistance is a key part to that. In Chart 3 I have stepped out the perspective and on the bigger picture we see how 50% of the major range has assisted. I added a Highs Resistance Card in as well and 66% of the 2022 high clusters neatly as well.
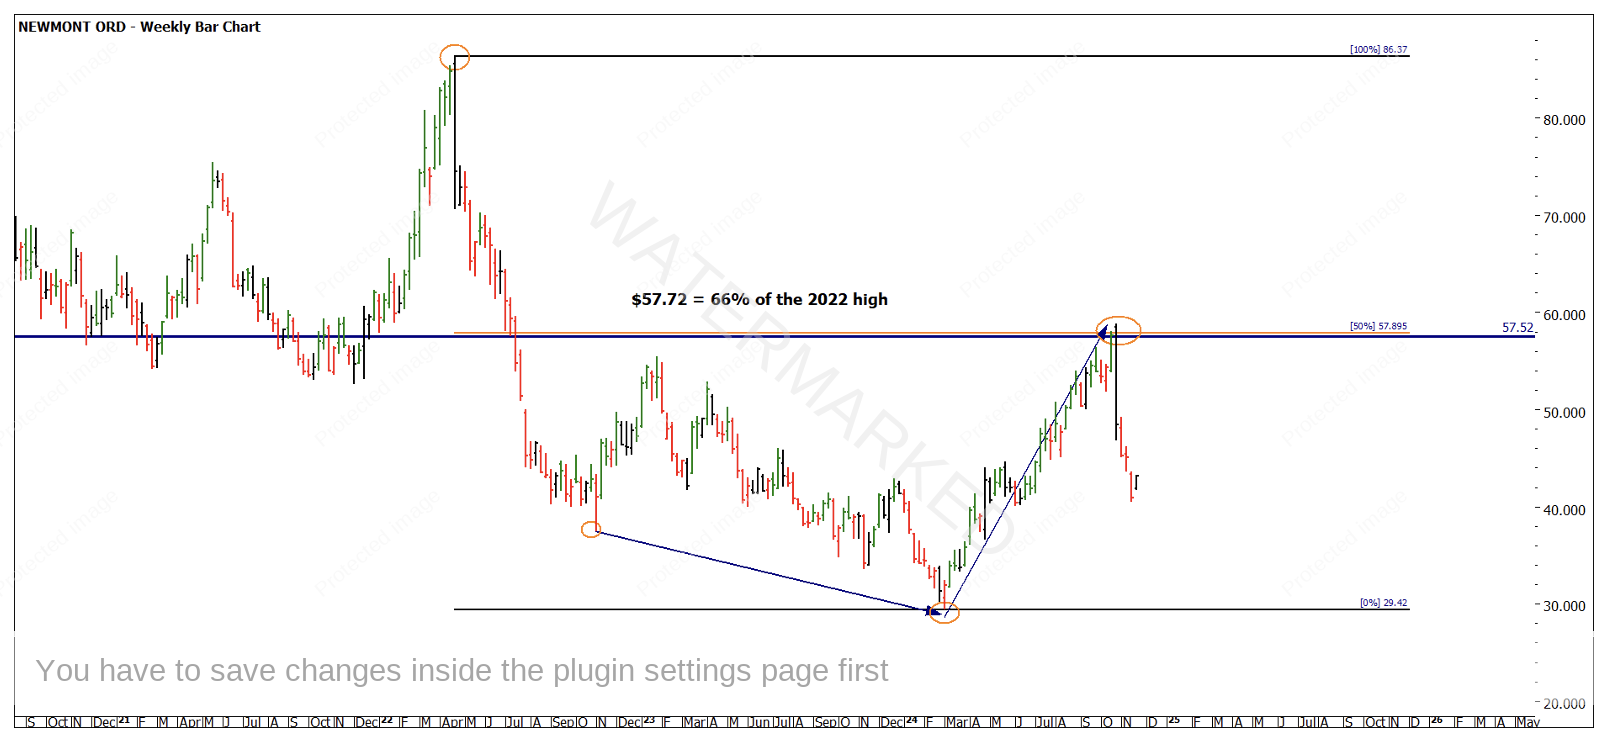
Chart 3 – NEM.NYSE Weekly Bar Chart
For those using 2nd dimension tools in their analysis you may wish to examine the areas I have circled for harmonies that add to the notion of a turning point.
The way you execute a position comes down to the entry types you prefer to use and what level of risk you are prepared to assume. The next charts look at two potential entry methods, the first being aggressive and second relying on more confirmation.
Chart 4 uses the gap down as a trigger to enter with the Openers Rule. Stop placement here is behind the gap and somewhat wide, there are several ways to trim that placement and potentially improve the risk to reward. Based on the current close the reward to risk is approximately 6 to 1.
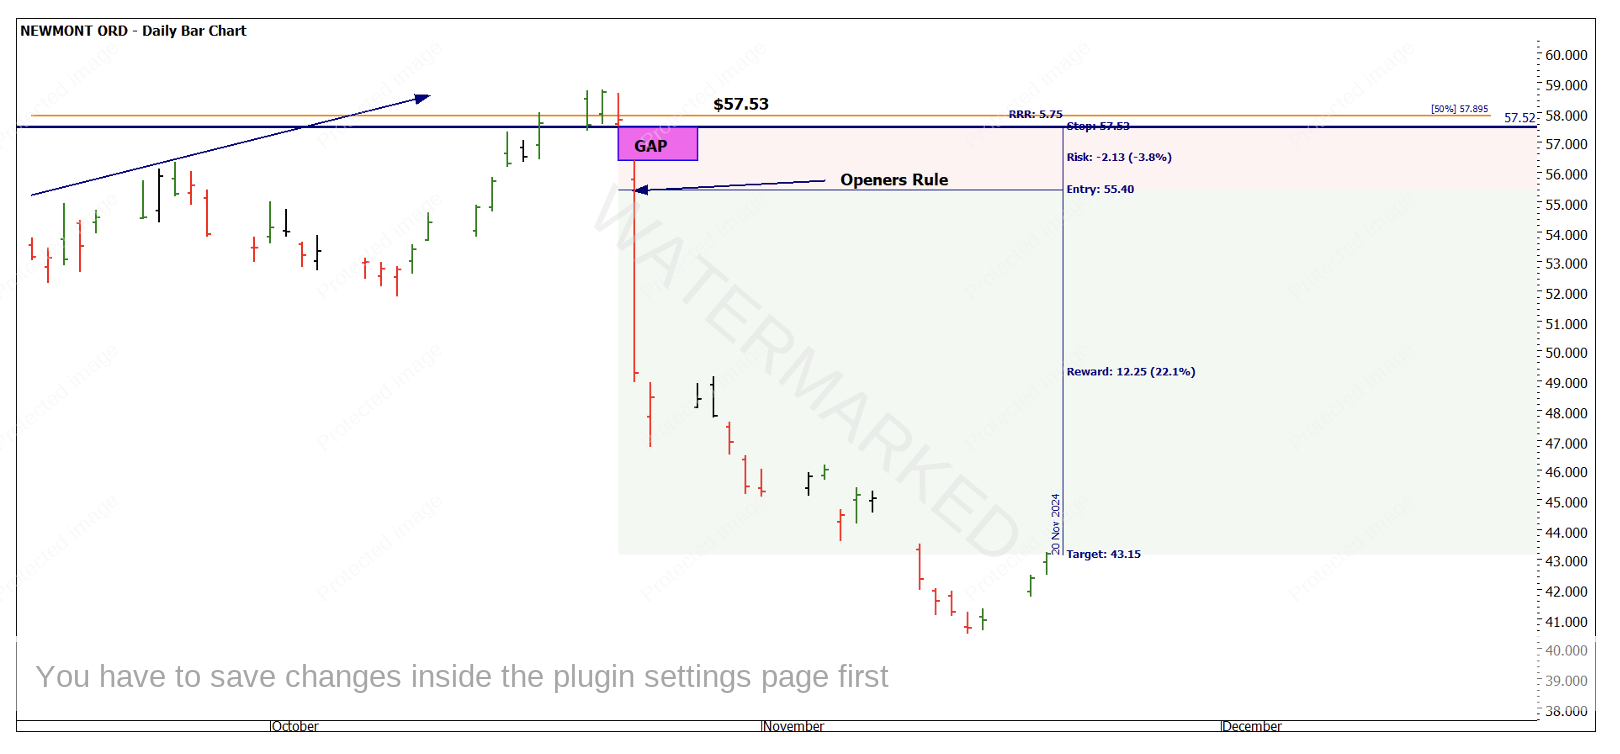
Chart 4 – NEM.NYSE Daily Bar Chart
Chart 5 is based on a more conservative entry of a confirmed lower top. The gap down on entry could have been used to finesse the placement of stops but has proven to deliver a positive risk to reward.
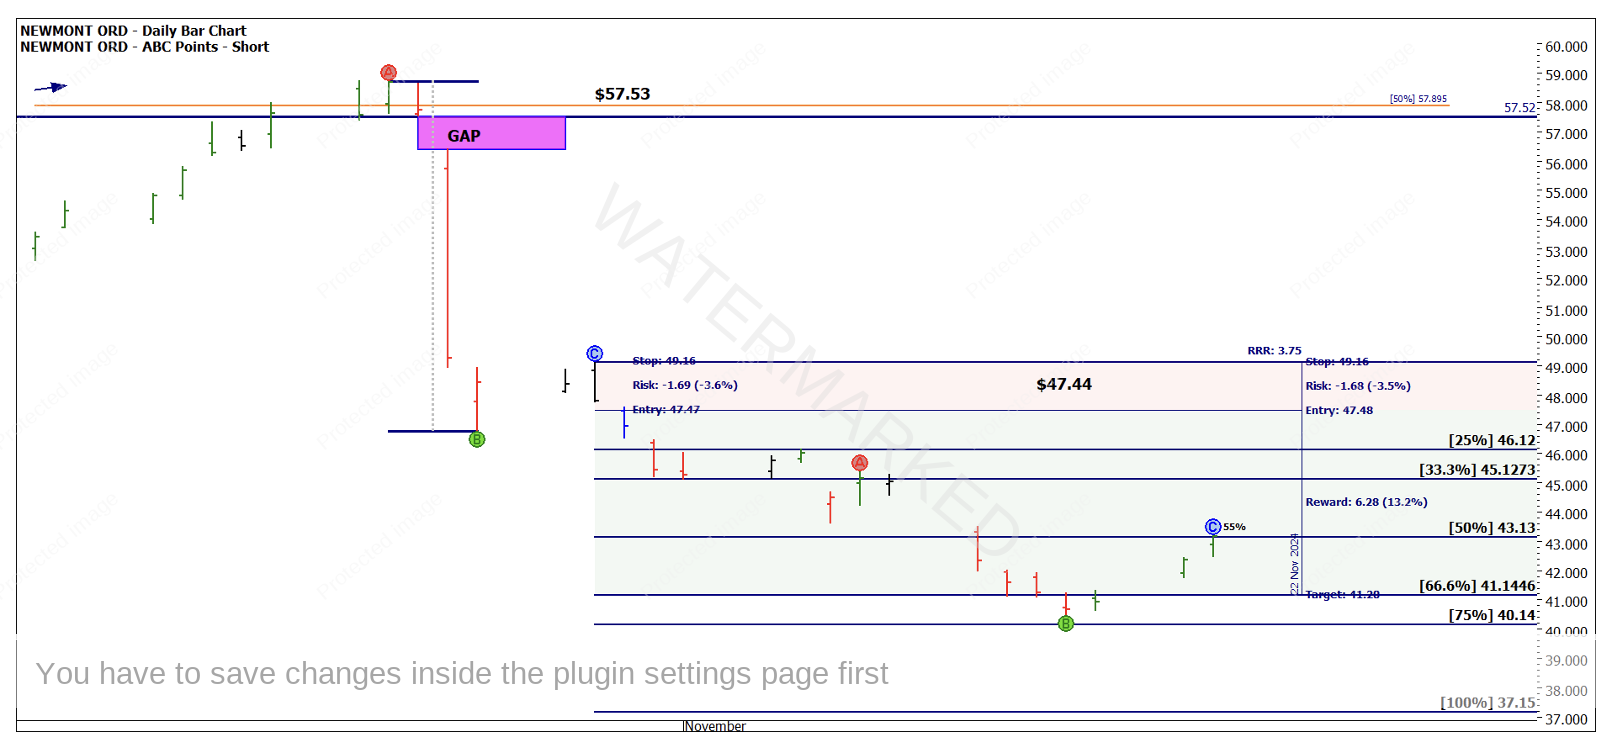
Chart 5 – NEM.NYSE Daily Bar Chart
The final chart leaves us with some points to consider. The price action has gained some strength to the upside in the last few sessions. As gaps have formed to the downside I will watch to see if these gaps are filled, and on what strength. The question might be, is there genuine buying or just short covering? Volume is somewhat low if this is to be the beginning of a new rally.
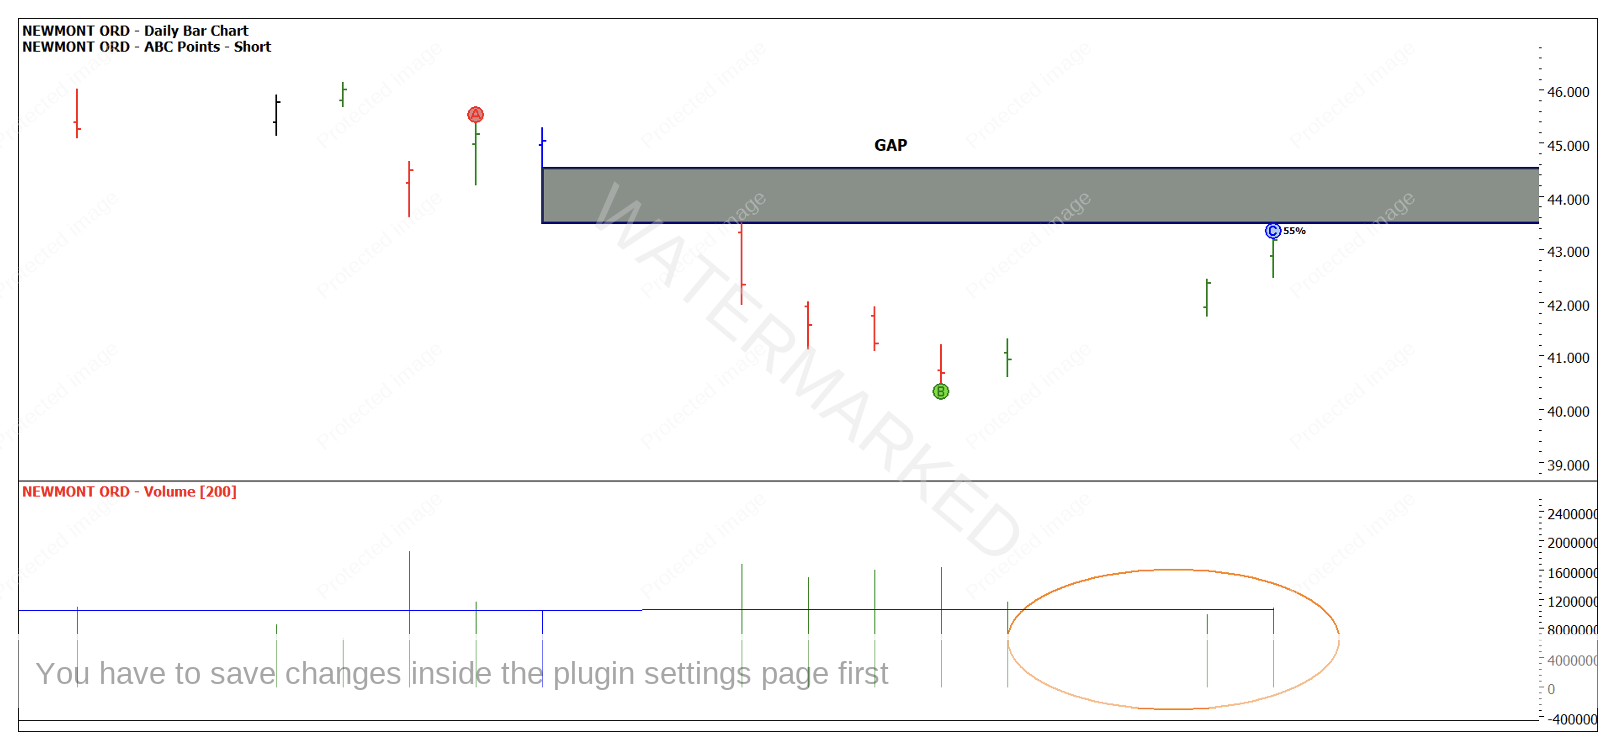
Chart 6 – NEM.NYSE Daily Bar Chart
Good Trading
Aaron Lynch