No Harm No Foul
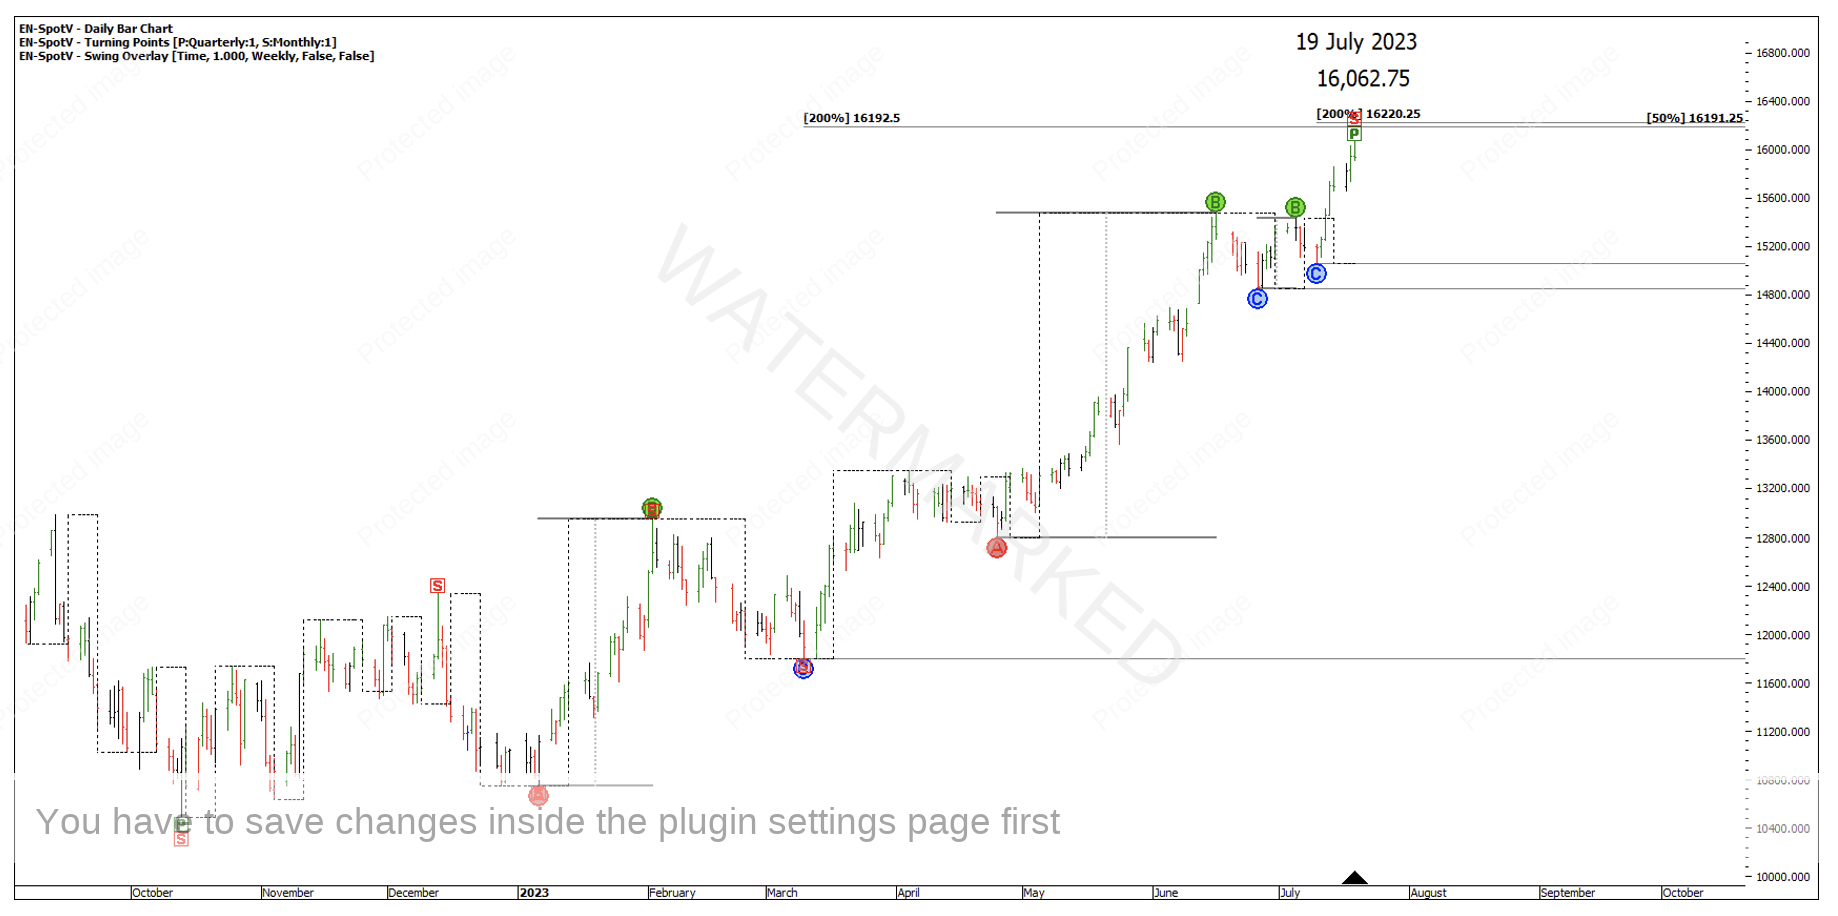
Chart 1 – Nasdaq Price Cluster
On 19 July, the Nasdaq topped out at 16,062.75 points, falling agonisingly short of the price pressure identified. At times this can be frustrating when you’re getting geared up for a trade, but unfortunately, it’s part of trading.
On a positive note, the cluster wasn’t hit, therefore there’s no entry signal and no chance for a loss, so we move on!
Looking at the monthly swing chart in Chart 2 below, it has now turned down meaning we’re no longer looking to call the end of that monthly swing up.
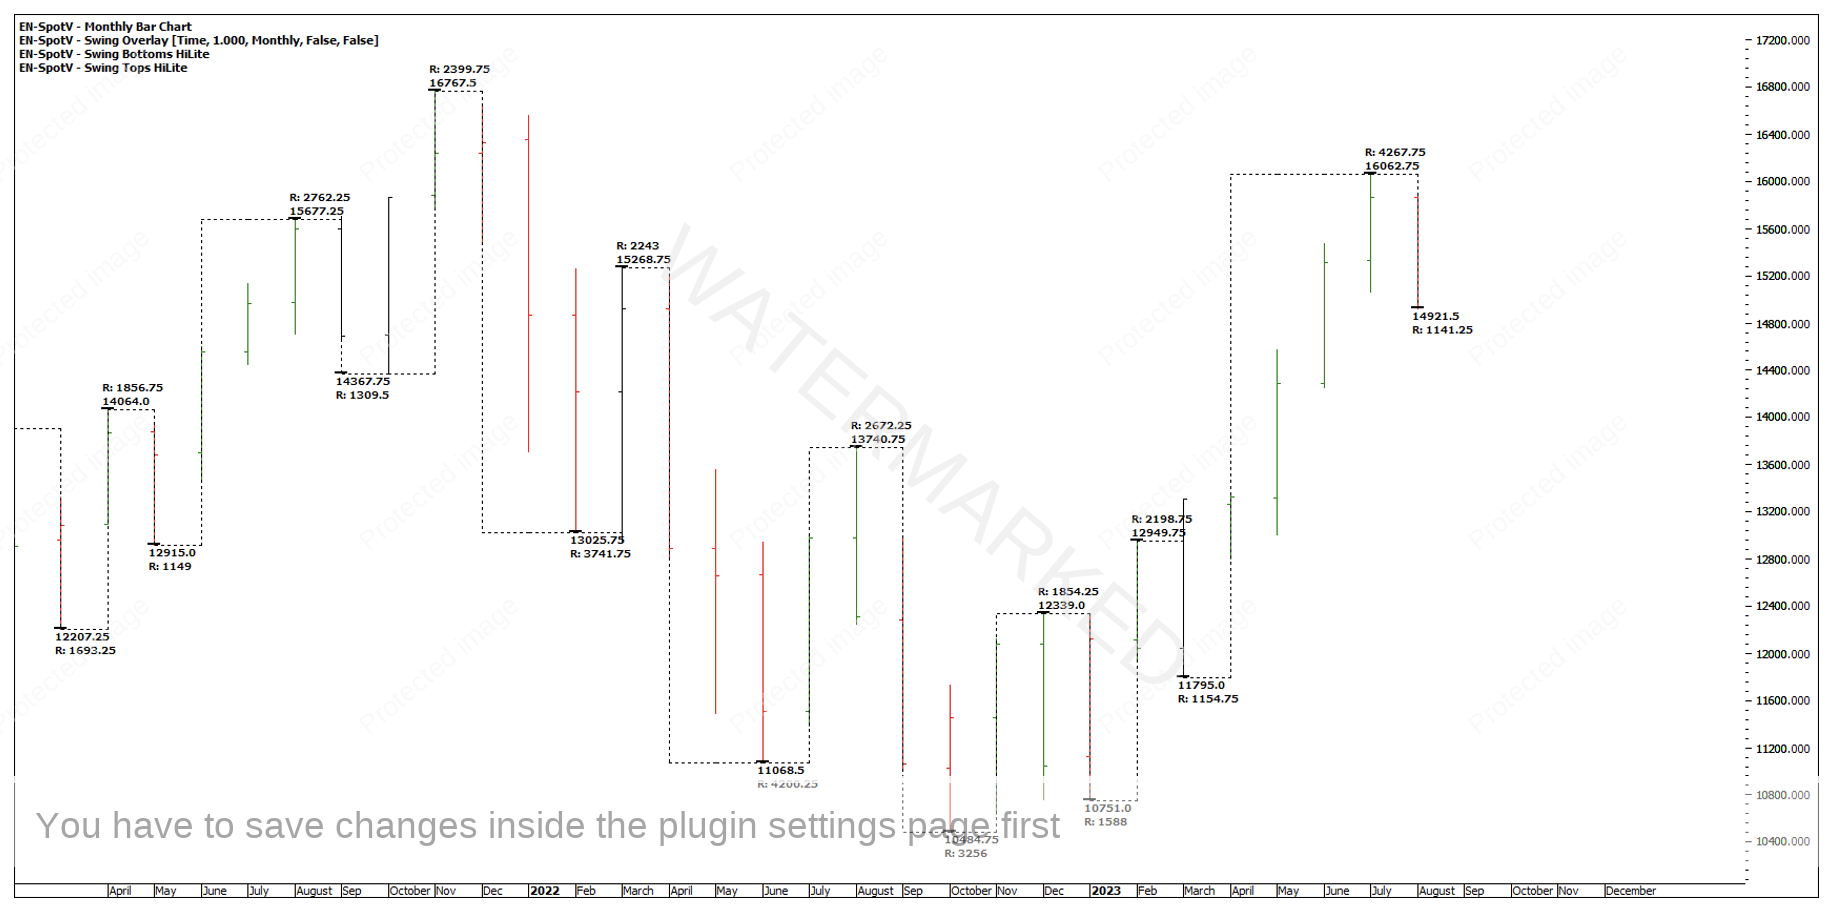
Chart 2 – Monthly Swing
The 19 July top could be the end of this quarterly move, as the Nasdaq is now trading well below the 50% milestone of the last quarterly swing range.
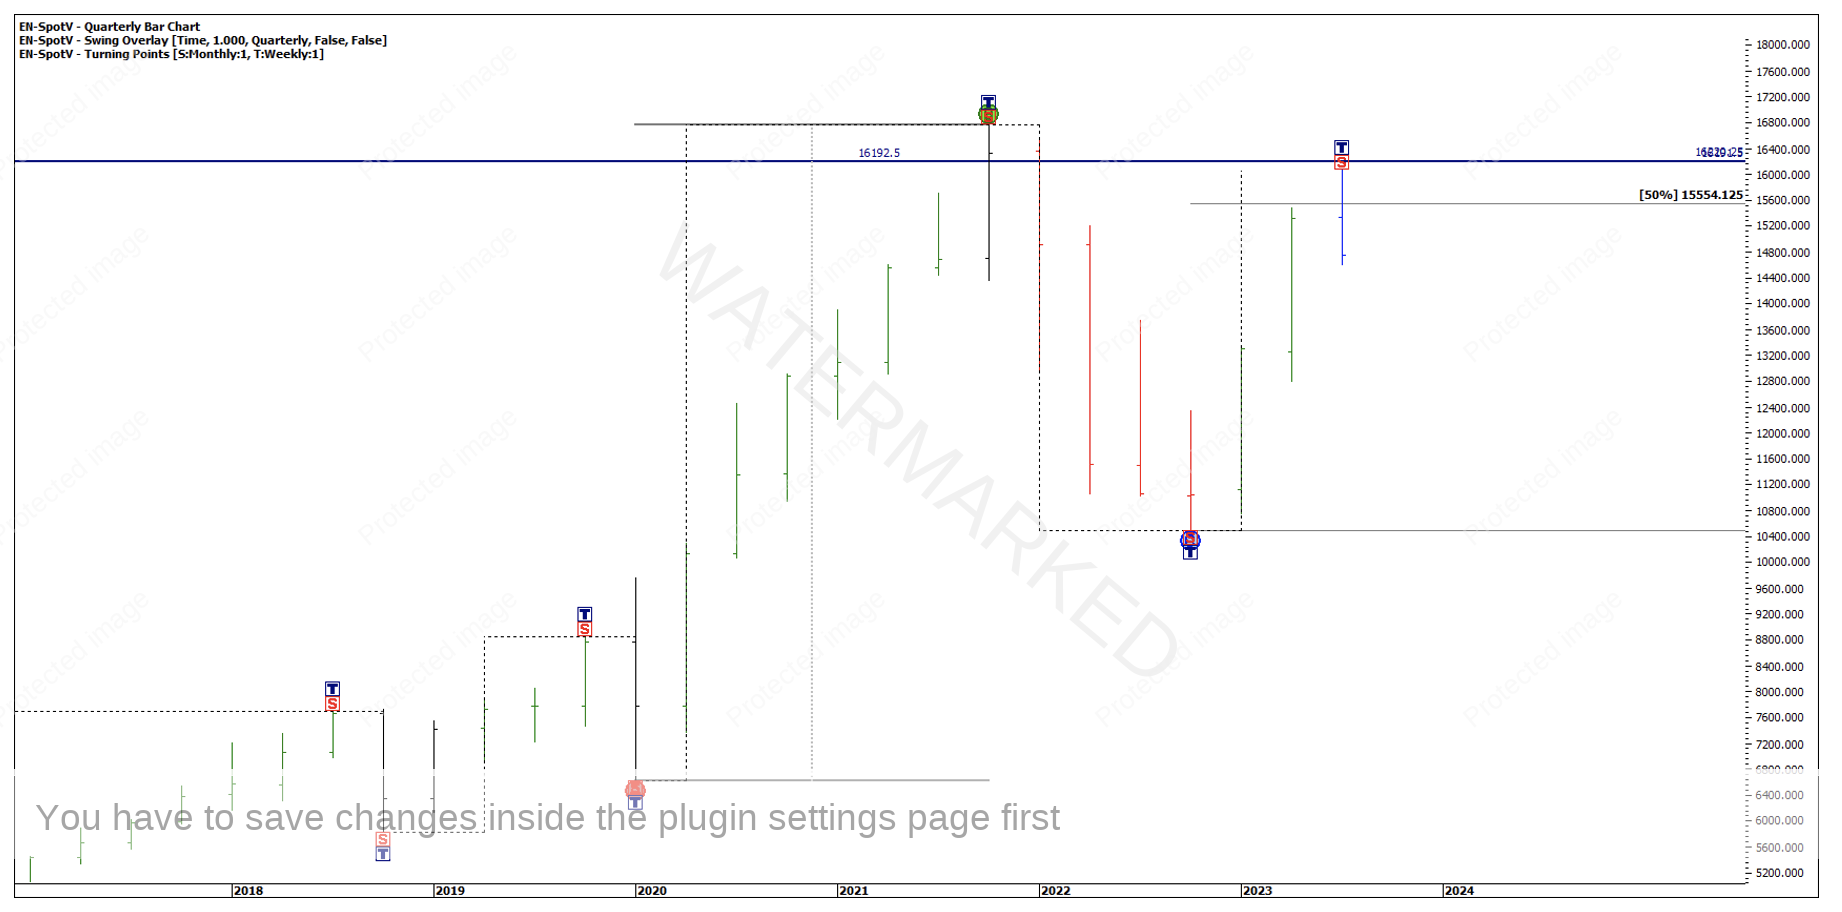
Chart 3 – Nasdaq Quarterly Swing Range
However, it may still pay to watch the obvious, which is a fourth and final monthly swing up into a Double Top setup as monthly Section 3 is an expanding swing range at 4267.75 points.
Let’s now move on to another potential setup on the British Pound, or FXBPUS in ProfitSource.
Take a minute to examine Chart 4 below.
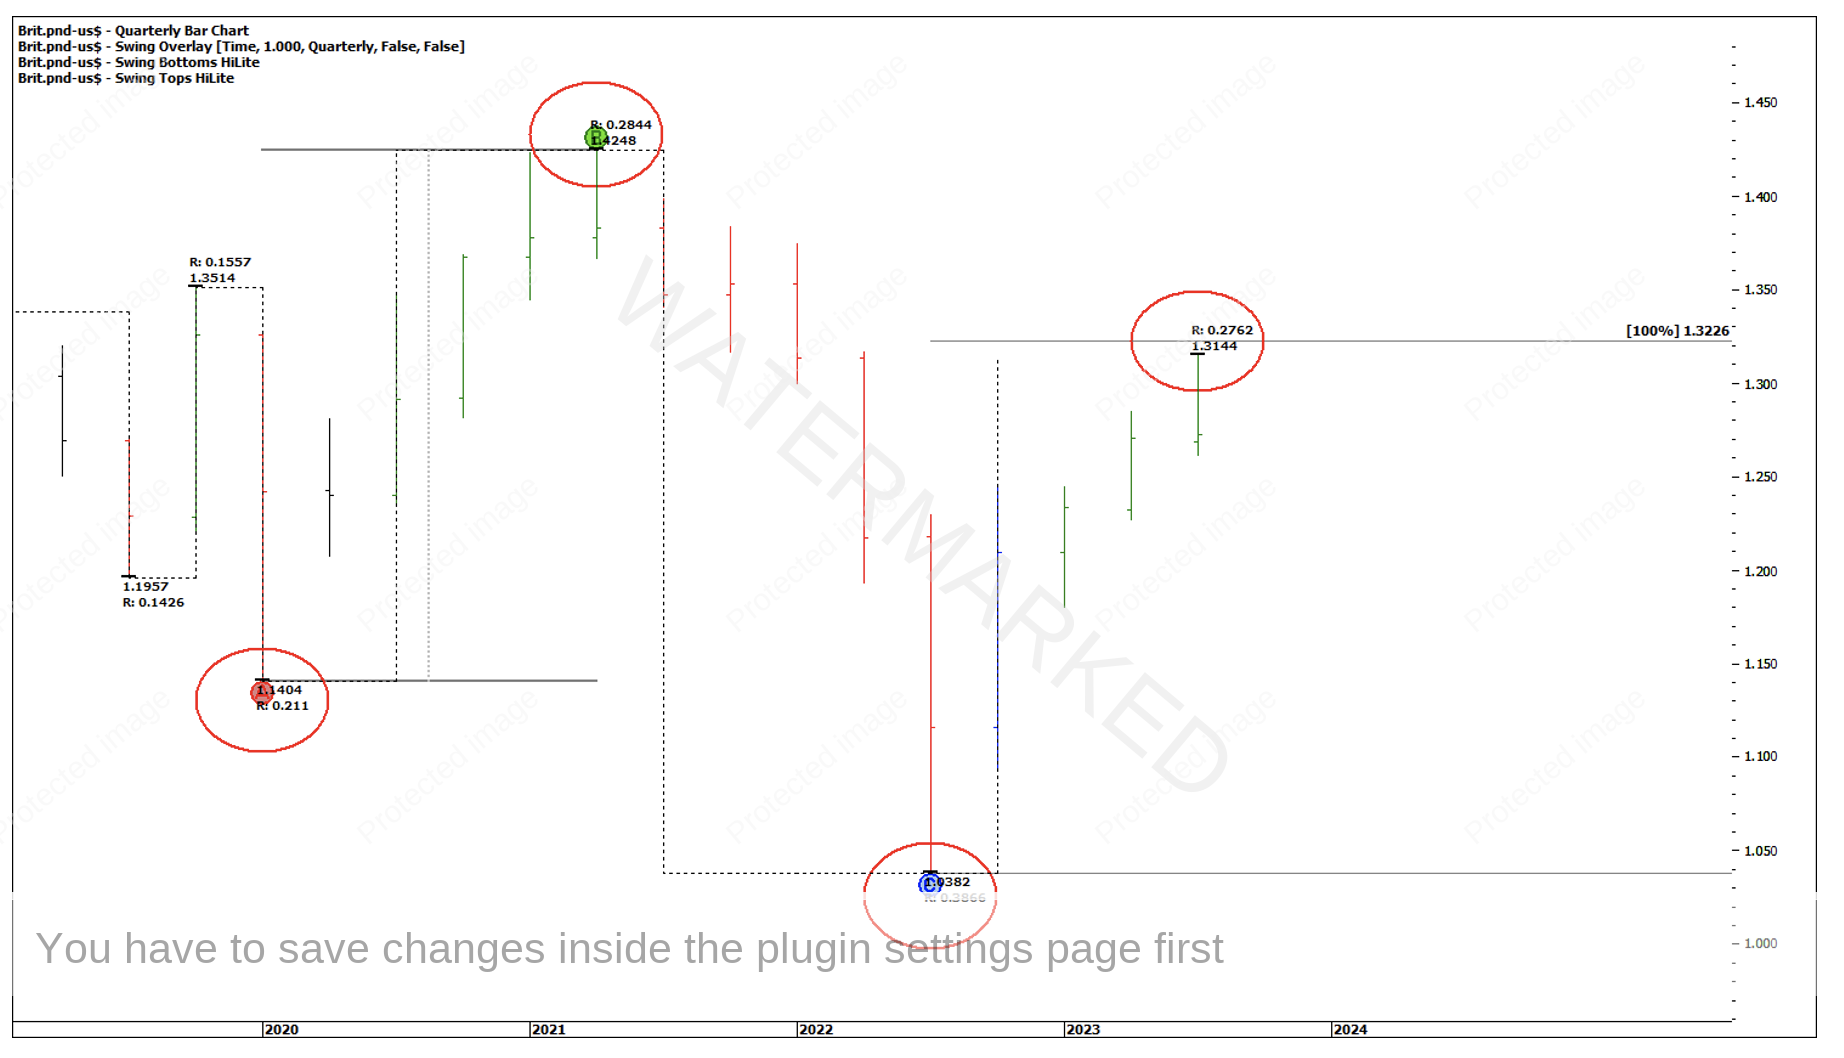
Chart 4 – British Pound Quarterly Swing
The big picture quarterly ranges show an expanding swing down and at present a contracting swing up.
The monthly swing chart is a slightly trickier one due to an outside month, so you can potentially combine these two perspectives in Chart 5 below.
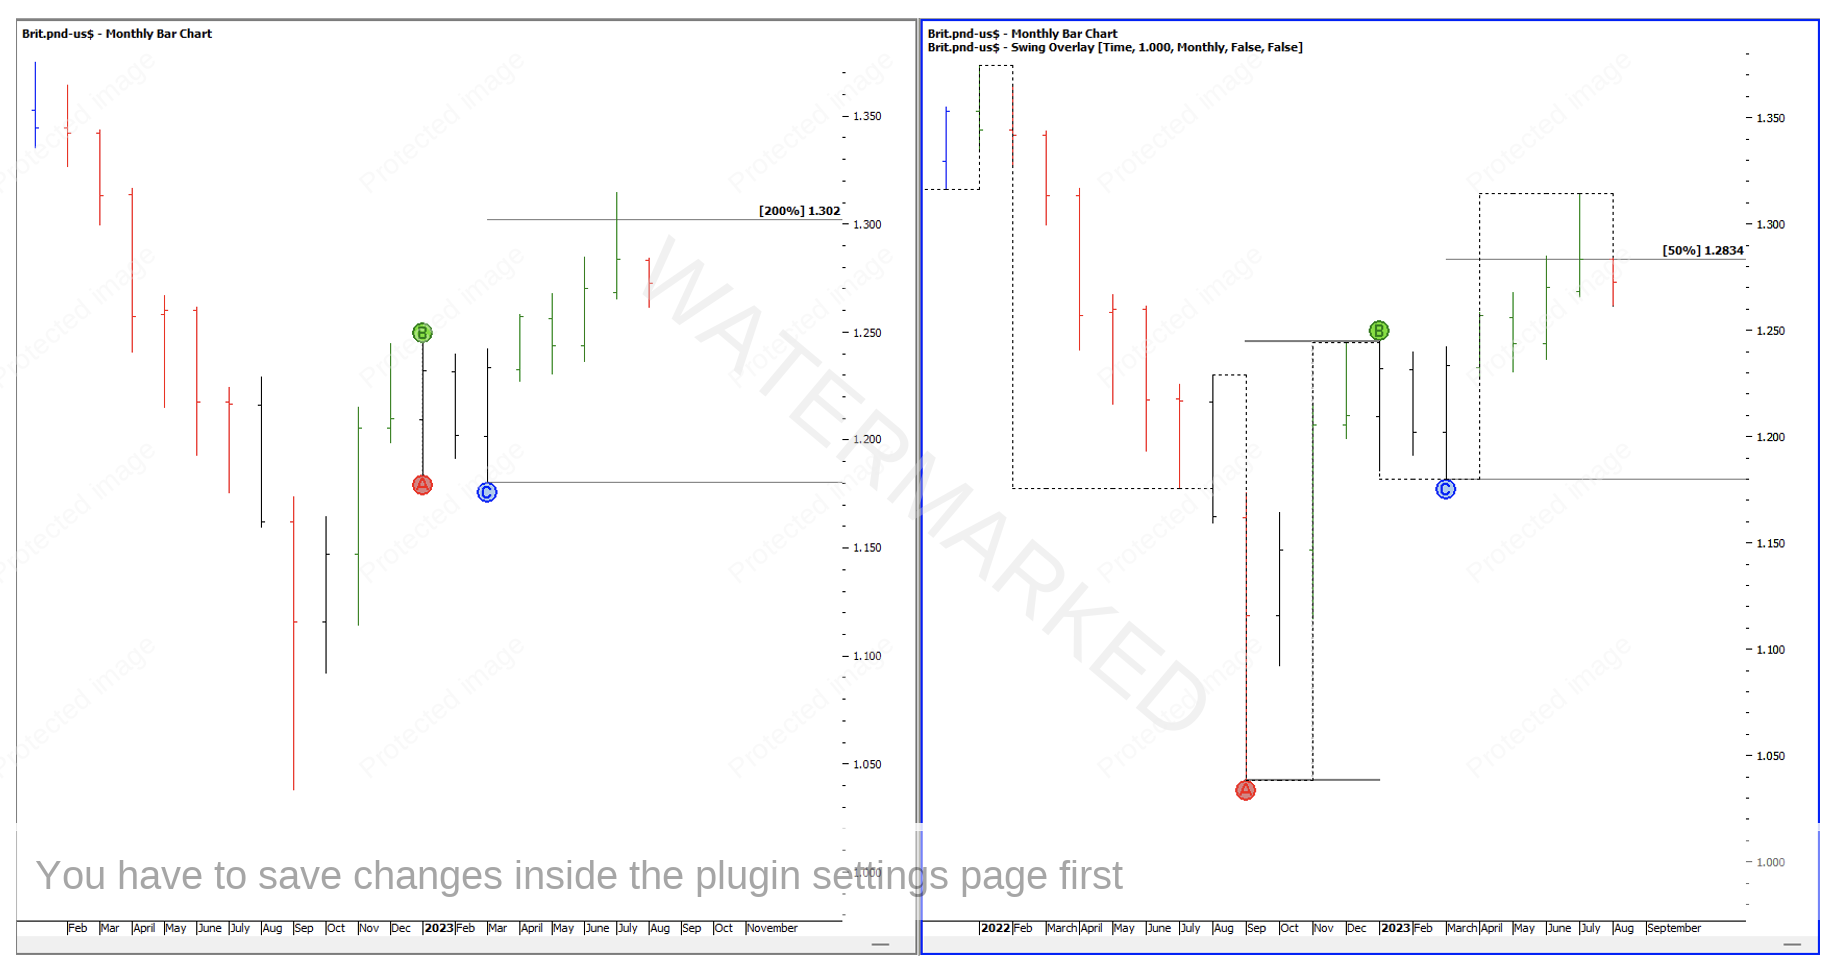
Chart 5 – Monthly Swing Chart
Has the British Pound failed at the 50% milestone of the monthly First Range Out, potentially kicking off a quarterly swing range down? Or could the pound be pulling back into a higher bottom to find support on an old monthly swing top, highlighted with red circles in Chart 6 below?
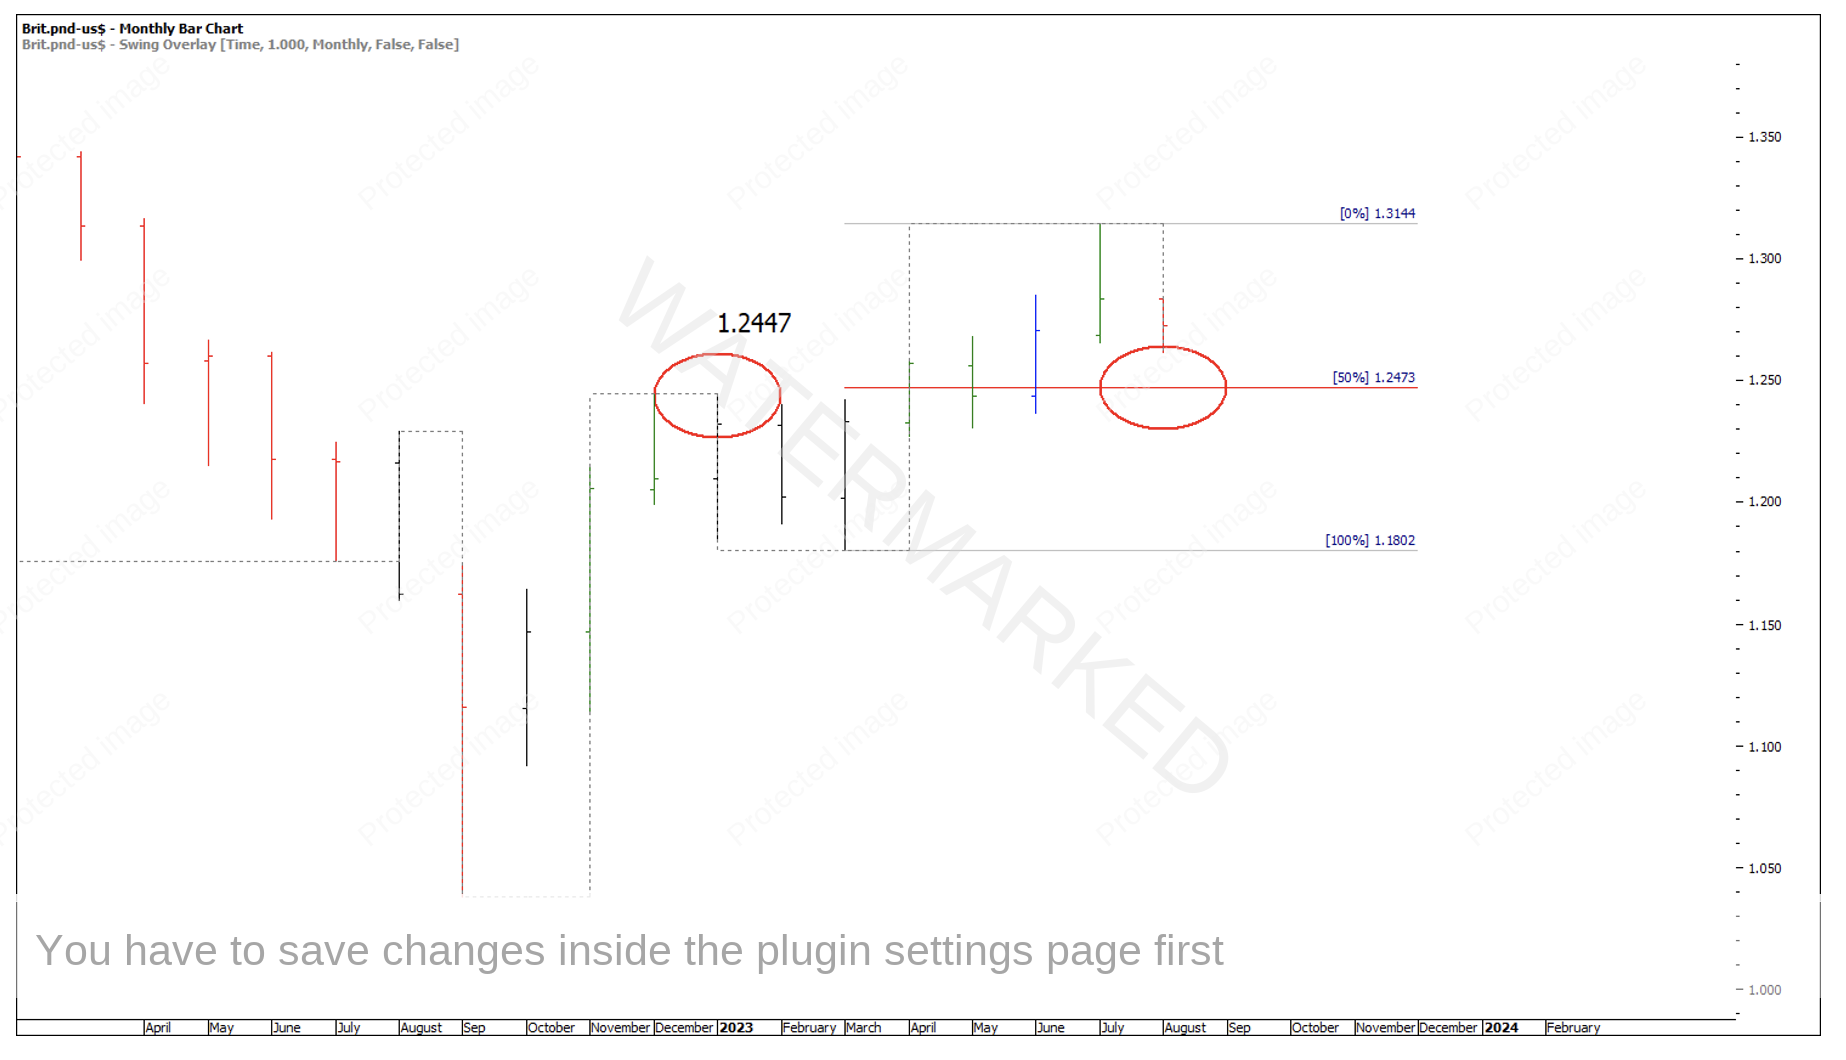
Chart 6 – Monthly Scenario
Looking at the weekly swing chart, we can identify a repeating weekly swing range into the top followed by a 200% weekly Overbalance in Price to the downside.
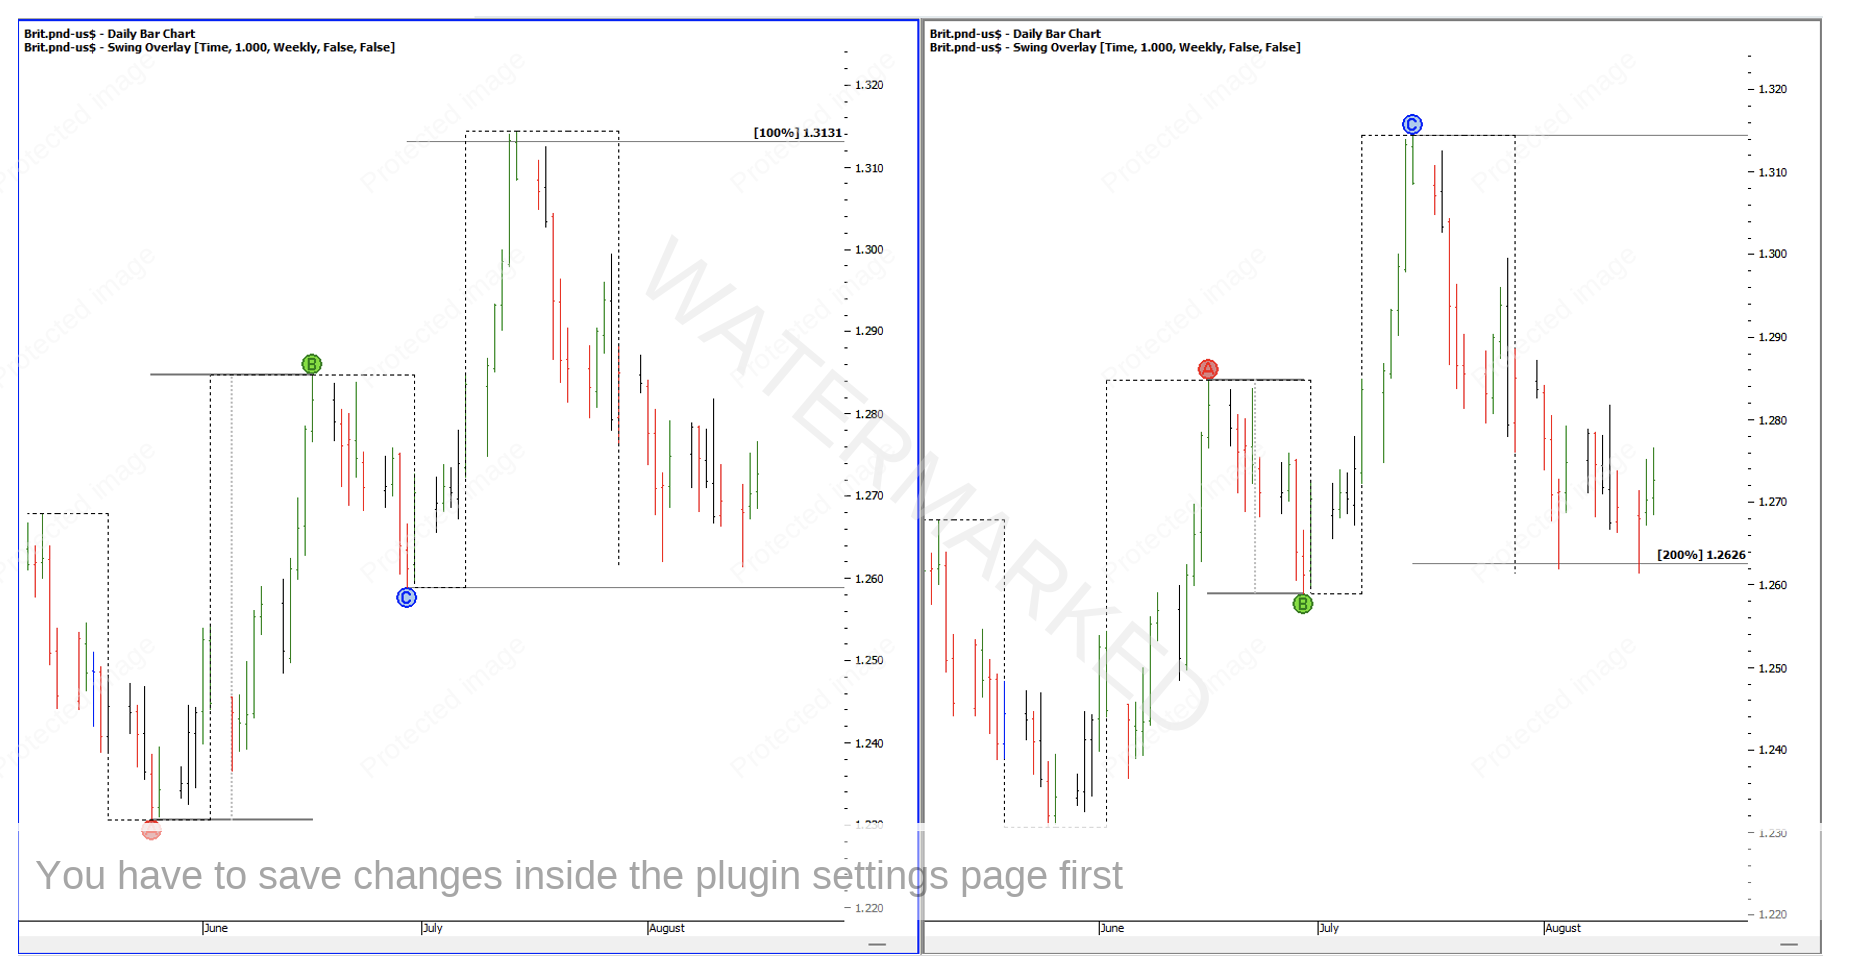
Chart 7 – Weekly Swing Chart
So far, we’ve got double bottoms on the 200% weekly swing milestone. At the time of writing on 21 August, the daily swing chart has confirmed an expanding daily swing up of 173 points and is currently contracting to the downside (yet to be confirmed) of 100 points compared with 204 points. The above weekly and daily swing charts suggest to me that the British Pound could be gearing up for a weekly re-test.
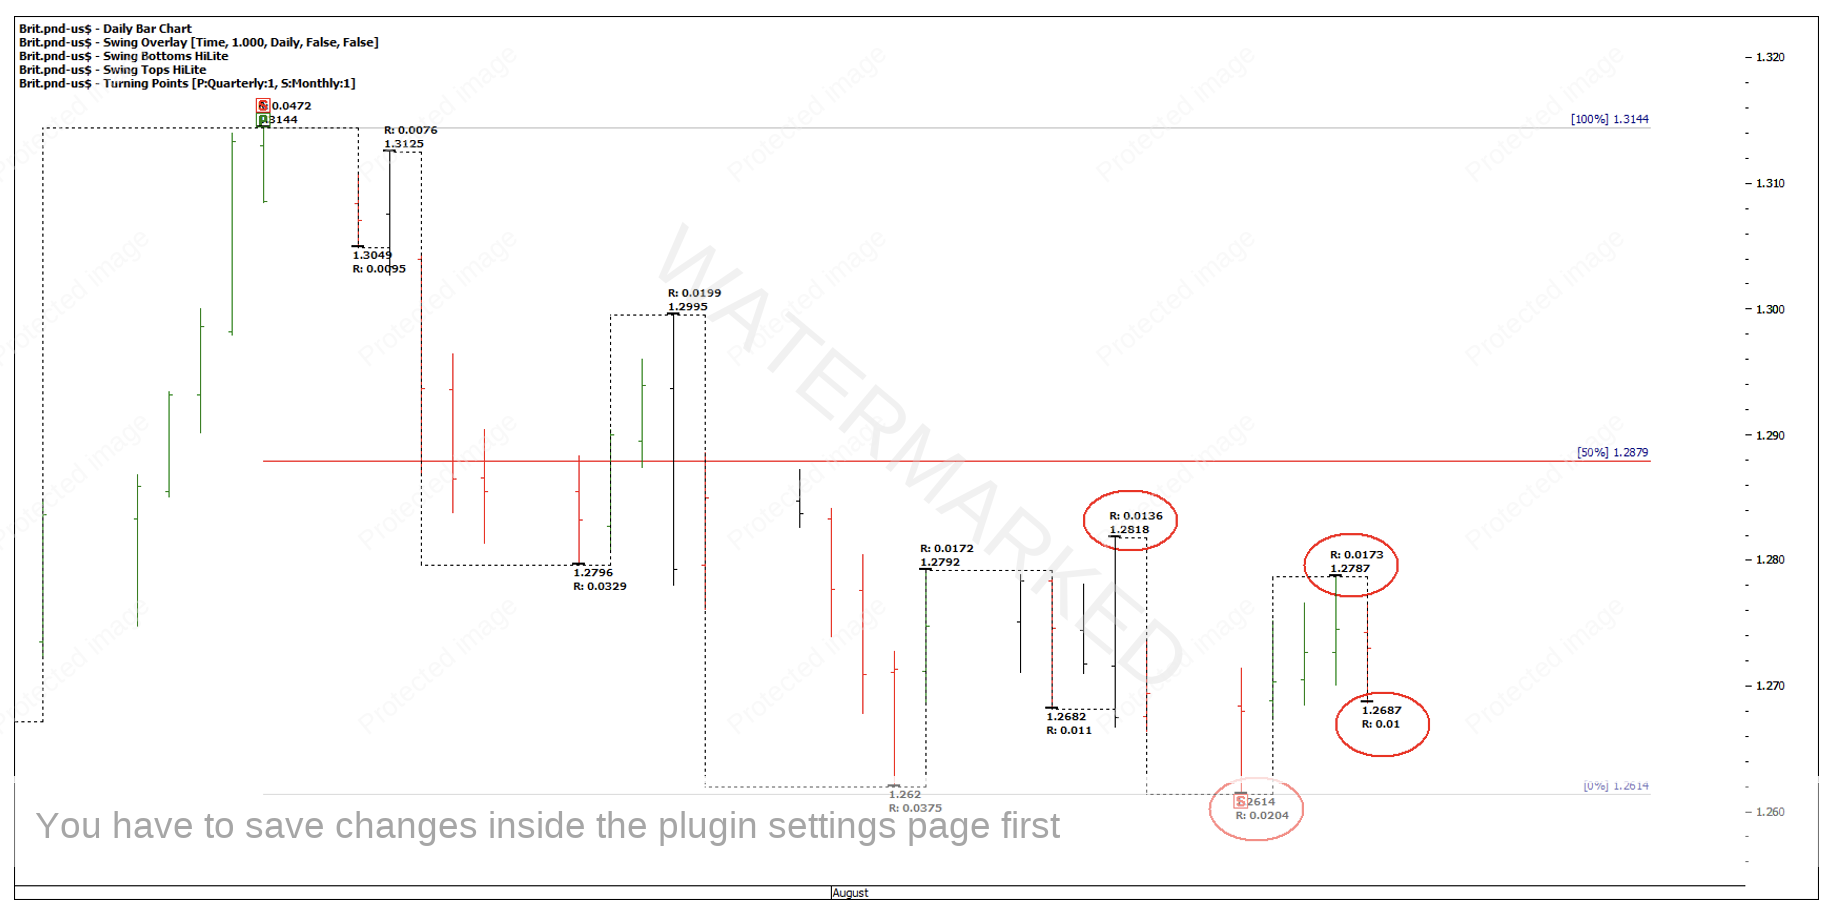
Chart 8 – Daily Swing Ranges
Now I can use my Price Forecasting techniques by applying the weekly swing range milestone, Double Bottom milestones, the daily First Range Out milestones and the weekly retracement card.
Although I don’t see a tight price cluster just yet, I do see three areas to watch, so I can put in an alert in my trading software when the market gets close to one or any of these.
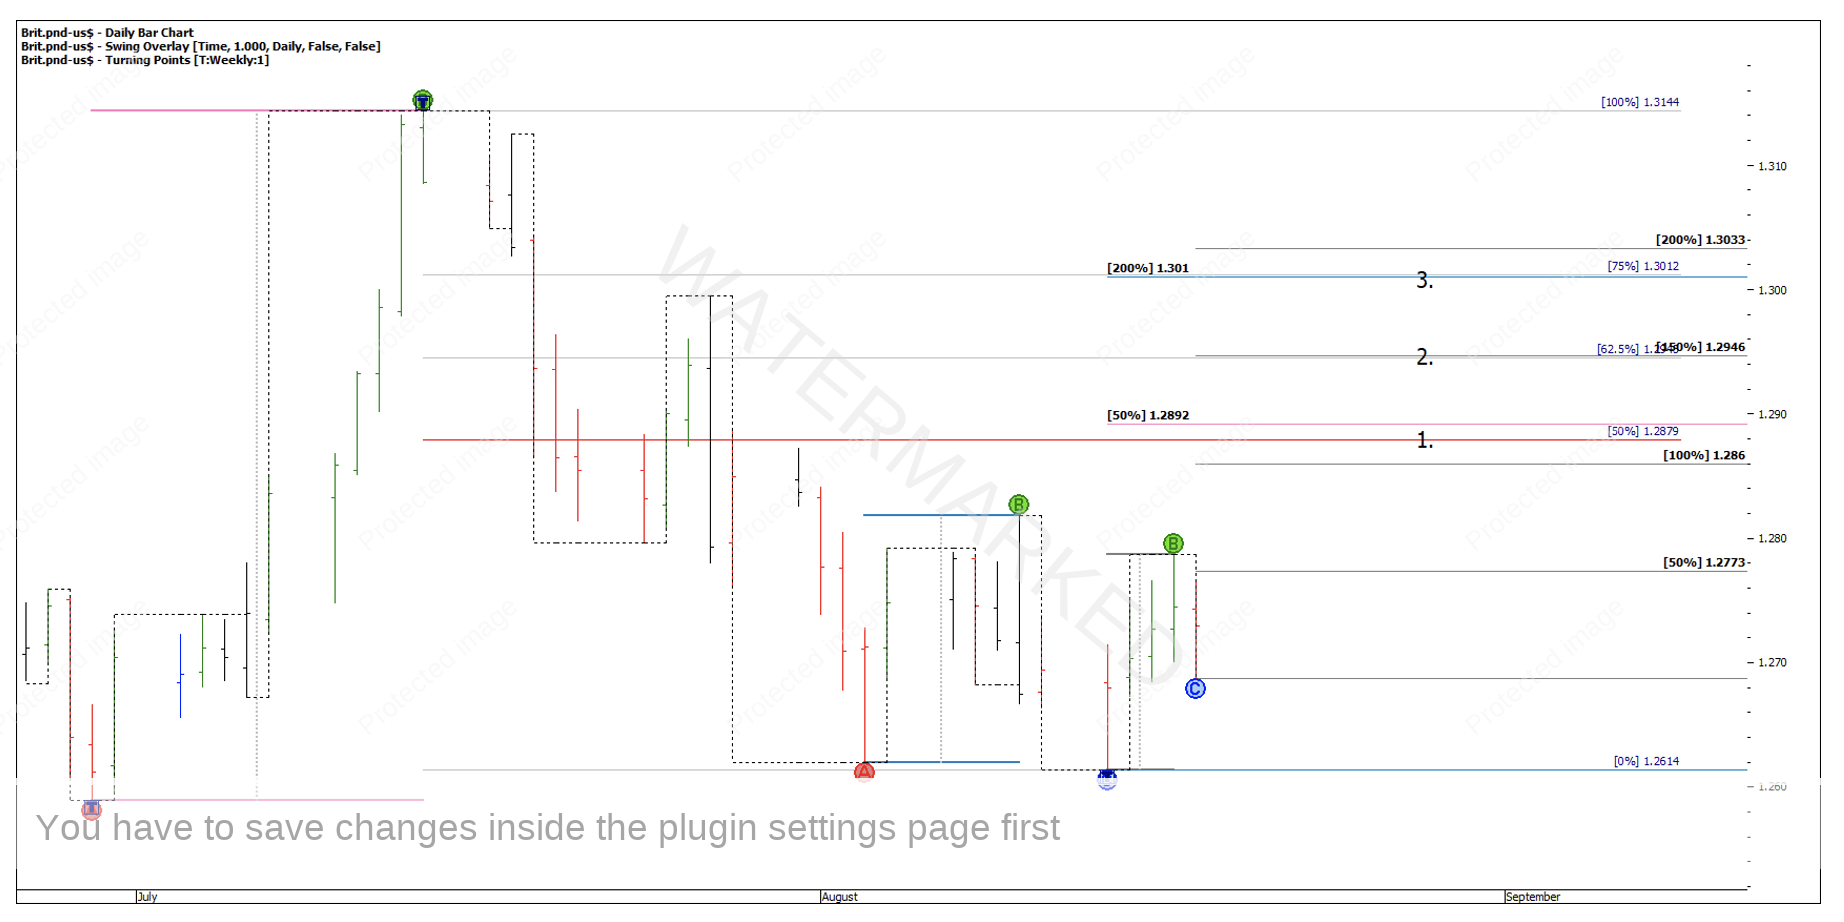
Chart 9 – Identifying Cluster Areas
Now I can revisit the pound in a few days, weeks or only when my price alert is hit and then continue the analysis to see if there is continued evidence of a strengthening cluster.
Below is our watchlist of markets and price pressure areas, but these are by no means places just to buy or sell at market. Instead, they give us a starting point or areas of interest to watch.
| Market | Price Cluster | Alert Price | Cluster Type |
|---|---|---|---|
| Nasdaq | 16,190 - 16,220 | 16,070 | Double Tops |
| British Pound | 1.2860 - 1.3033 | 1.2850 | Weekly Retest |
Happy Trading,
Gus Hingeley