Normal Transmission?
After a very lacklustre 2020 in the Oil market (read sideways market) we have now seen the price action come to life. A decade ago, Oil was the market that dominated the news cycle and all the polarising views that it generates. Peak Oil, climate change, oversupply and undersupply were all themes that drove sentiment.
In current times the themes may have changed i.e. COVID-19, electric vehicles and renewable energies but the analysis themes and techniques in my trading world have stayed the same. We are seeing a few drivers to price in Oil, like aircraft not flying in the quantity that is anywhere close to normal, we might argue that demand is improving but a fair way off from record levels. We have seen a new administration installed in the US and this can place pressures (in both directions against the US Dollar). The somewhat normal but still abnormal pressure we see on Oil is the weather. For those not tracking the US, we are seeing winter storms placing huge pressure on demand for Heating Oil. When we are seeing snow in the state of Texas it’s fair to say North America is getting a winter blast. These are factors that we can apply against our technical techniques, so they aid our analysis and should not be seen as an impediment to trading. My only regret with weather like this is the inability to travel for a skiing holiday, mainly due to COVID-19 concerns.
As we look to 2021, we should remember that historically Q4 and Q1 can produce major turns on Oil. This combined with the seasonality of the US Dollar should be examined.
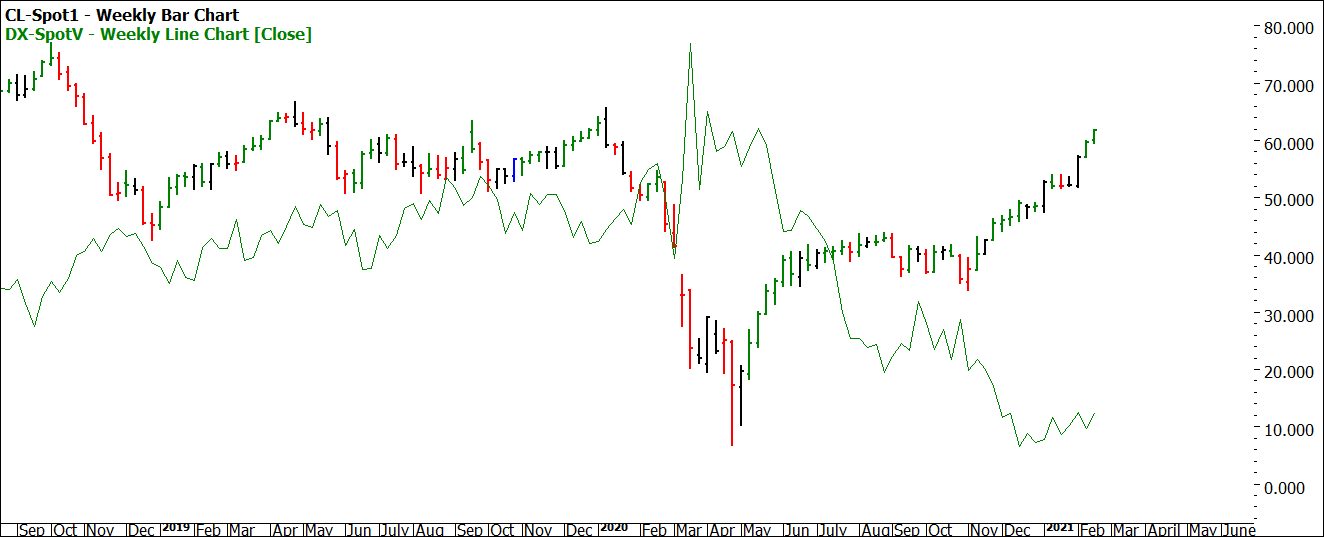
Chart 1 confirms what you may have expected, that US Dollar index pricing has been falling as the Oil price has increased, which shows there is more than just increased demand pushing Crude prices higher.
Chart 1 – Crude Oil vs US Dollar Index Overlay
One other more fundamental factor that is worth pursuing for commodities is the use of the Commitment of Traders reports. The COT reports are published by the CFTC to showcase the overall positions of commodities market segments. The users, the producers, and the speculators. This is a distinct difference to other listed asset types and can provide insights into demand. I will allow you to explore this separately, suffice to say the users of Crude Oil are increasing their net long positions in line with the expectation there will be more demand for Crude over the coming front months.
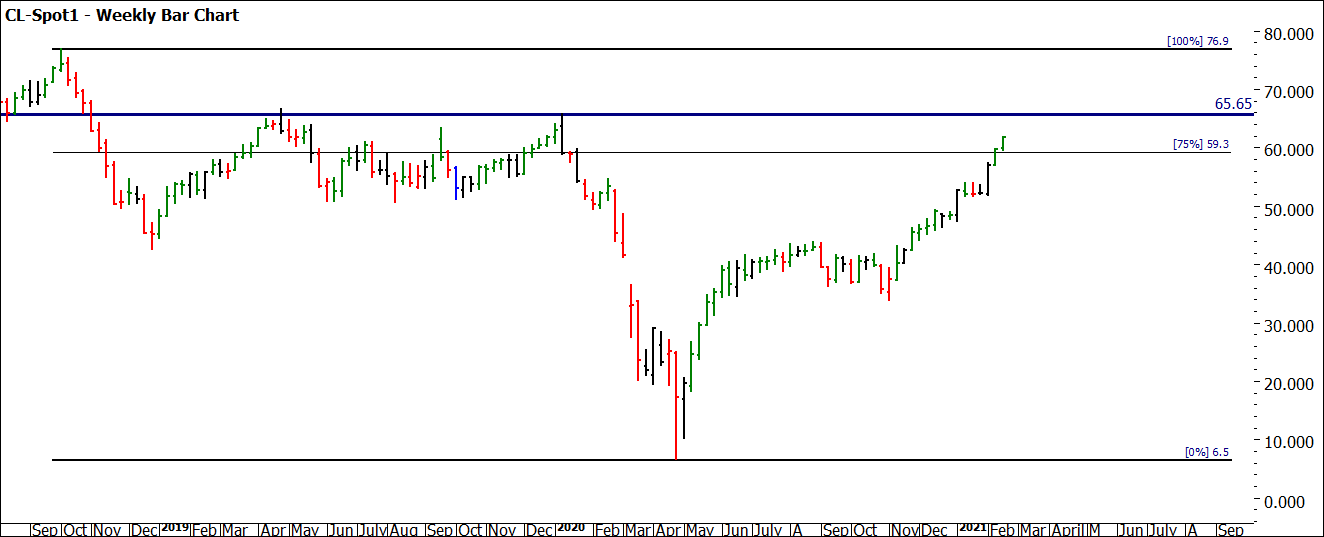
Chart 2 provides us a quick sense check on the medium-term picture. The price action has crossed the 75% milestone of the 2018-2020 range. Also, we are approaching multiple tops around the $65-$66 area that were strong resistance. If price action were to break these levels it may suggest we are well into a new phase of Crude pricing.
Chart 2 – Weekly Bar Chart Crude Oil
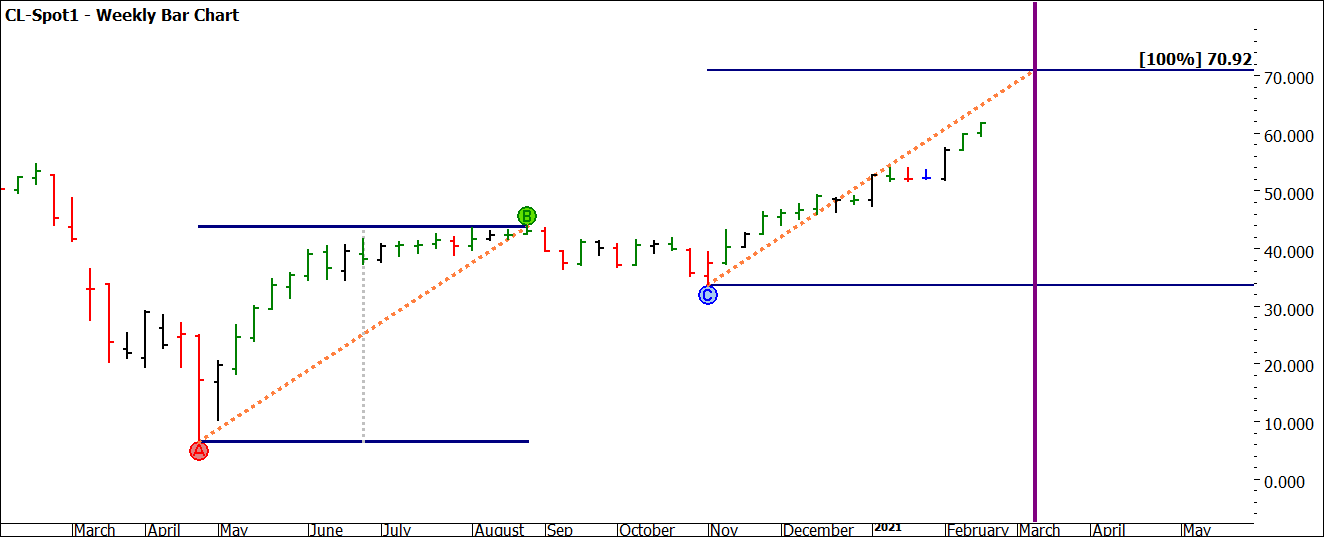
Chart 3 focuses on the current sections we have in this move, using the pressure points tool and a speed angle. If we are to see a 100% repeat in time and price, that would give us a target of just under $71 by the 9th of March. It’s important to note we have seen the price action under the speed angle in the last few weeks but it may still act as a guide into a turning point. If so, we may have a third section to develop in the next stages of 2021.
Chart 3 – Weekly Bar Chart Crude Oil
If you refer to the January Platinum newsletter, I spoke about the analysis that may have allowed you to enter the market long. As you advance with trade management and selection of larger ranges to trade, the logical next step is to look at where and if you could add to the positions (pyramiding).
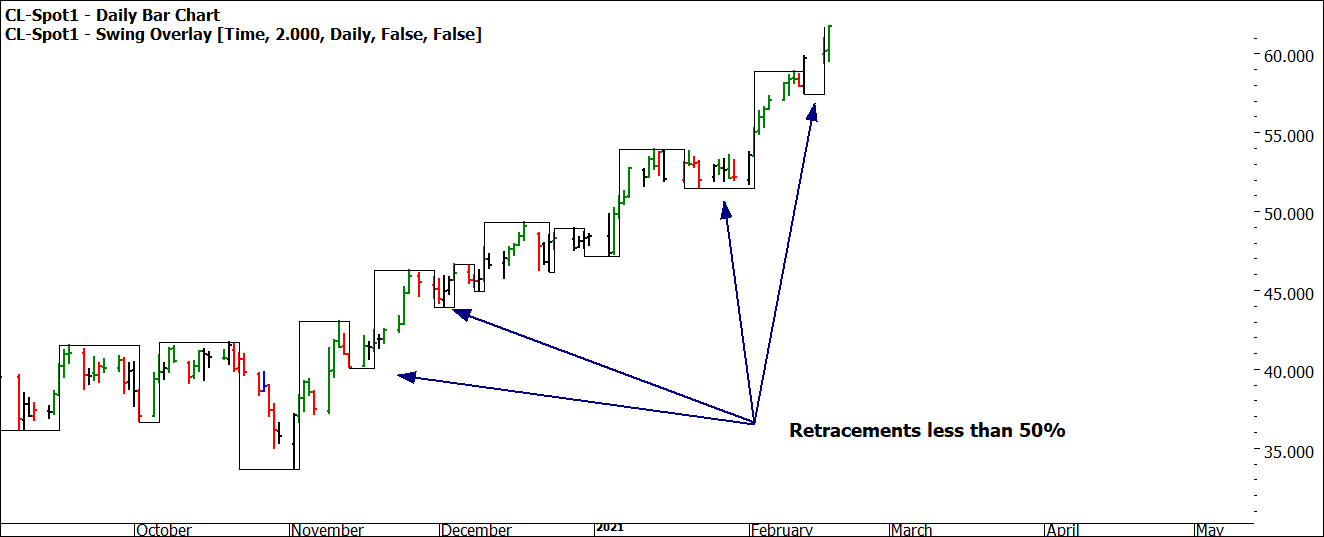
There are no hard and fast rules to adding to positions and I might say it is a craft in its own where testing can play a crucial role. (For those interested, Mat will be discussing pyramiding and compounding in this month’s Active Trader Program Coaching, as he discusses how to set up for a trade with a Reward to Risk Ratio of 100 to 1 or more.) Where David assisted us was to look at opportunities where the swing retracements are less than 50%. You can then decide if you’ll be adding positions on confirmation of the next swing (top or bottom) or even on breaking of the previous swing top or bottom in the direction of your trade. Chart 4 looks at the logical swing bottom where adding to the position may have been warranted. Your homework is to test the outcomes on what may have been.
Chart 4 – Daily Bar Chart Crude Oil
The number one area to remember when adding to positions in any existing trade is to add a smaller position each time to the trade. Creating a balanced pyramid is critical, many a trader has come unstuck by inverting the pyramid and adding more to the position as it develops. It can leave you very exposed at the eventual end of a move where the biggest positions are added last in the move and can evaporate the profits created in the initial part of the move.
If we are to see more defined and developed trends in commodities in 2021, adding to positions is a vital part of your toolbox to have ready to go. Any work put into that now will be rewarded later.
Good Trading
Aaron Lynch


