Oil – Geopolitical Temperature Gauge
2025 continues to deliver on volatility and short sharp moves. This has been a feature of patterns we have seen so far. The continued challenges we face geopolitically translate from what can seem a long way away to impact us locally in many forms. Another observation I am seeing is the news and the reaction are not always lining up in a traditional sense. The market can be moving in advance of announcements.
Crude Oil is used by many as a barometer to measure tensions, and when it comes to the Middle East the impact to supply of Crude shifts prices rapidly. We have been discussing the Crude market in our Ultimate Gann Course Coaching and the sideways movement in different phases of the past 12 months has been challenging, as when it trends strongly Crude is a fantastic Gann market.
Chart 1 shows us the overall position using 1st dimension price analysis. Using the All-Time Low of $6.50 and the true top of $123.68 we see the area at approximately $65.09 as providing some resistance in the recent space.
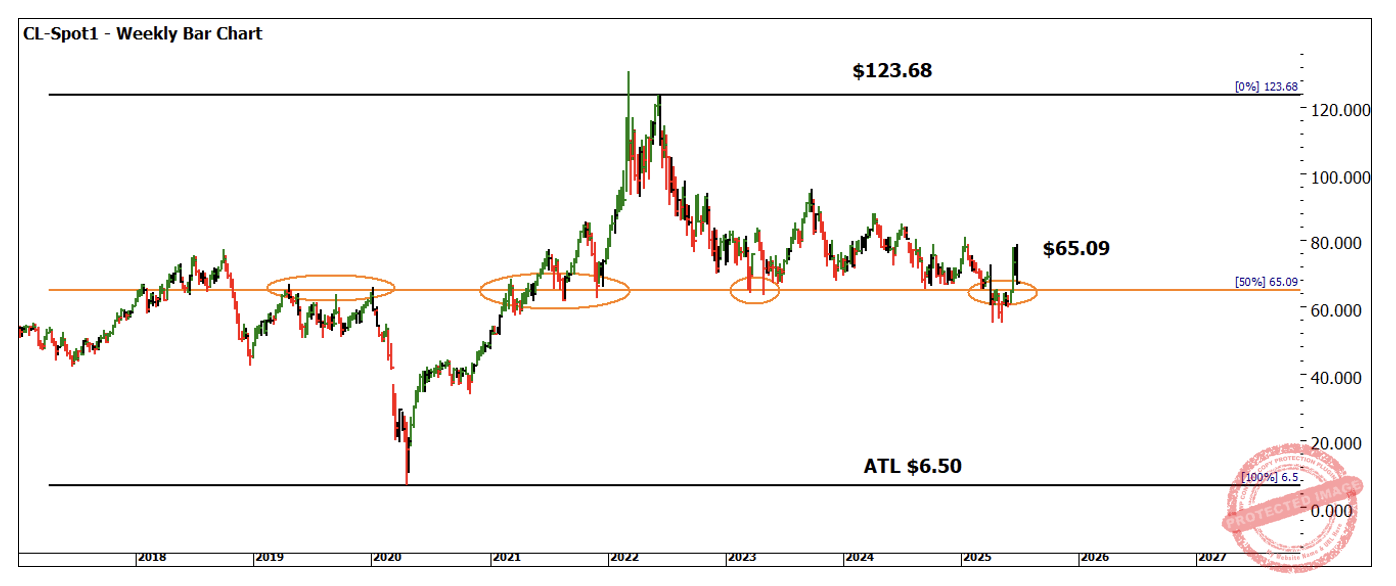
Chart 1 – CL-Spot1 Daily Bar Chart
Chart 2 shows us the recent sideways activity, with an upward bias, as we moved towards and ultimately above the $65.09 level. The 100% level from the double bottom clustered at this approximate level, so this provided a good make or break point for this market.
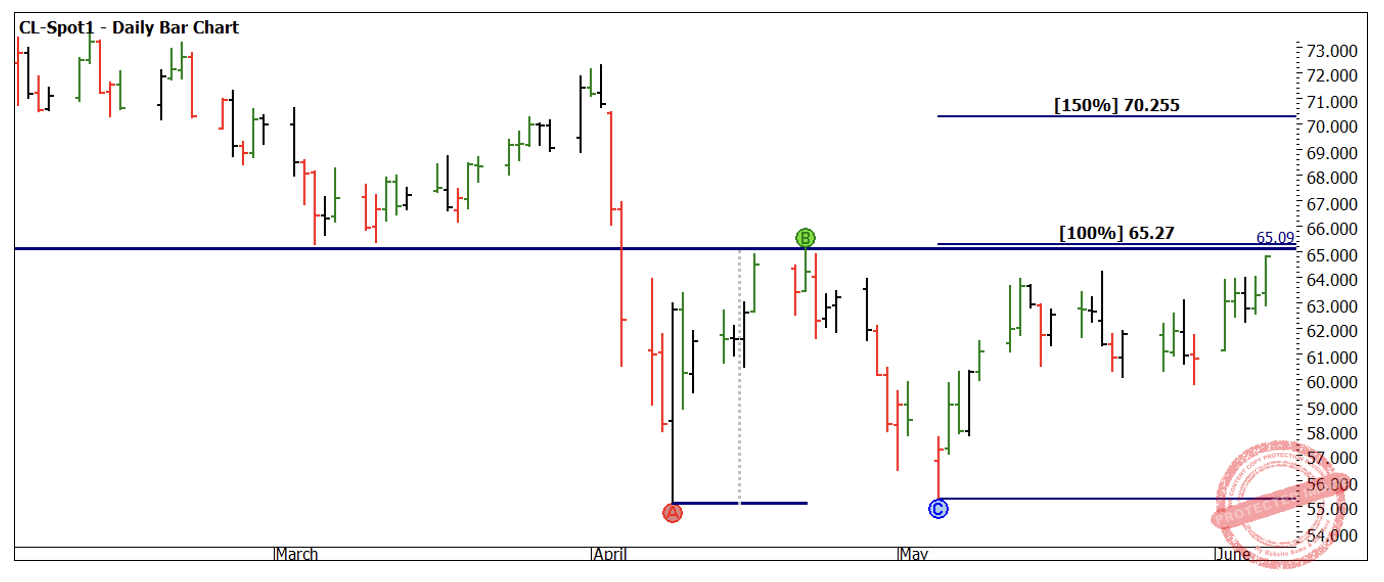
Chart 2 – CL-Spot1 Daily Bar Chart
Chart 3 is mainly focused on price work with a touch of strength and weakness from squares, another recent topic we have worked on in coaching.
The All-Time Low of $6.50 as a Lows Resistance Card showed how the oranges lines (full multiples of $6.50 in price) have mainly held the price action up; we see the horizontal line on the double bottoms supporting price as a multiple of $6.50. The diagonal lines show us strength and weakness in the square; we can use the diagonal in the same way we use angles for support and resistance.
Any potential move, if it aligns with some time pressure, can be used as part of our classic Gann Setup.
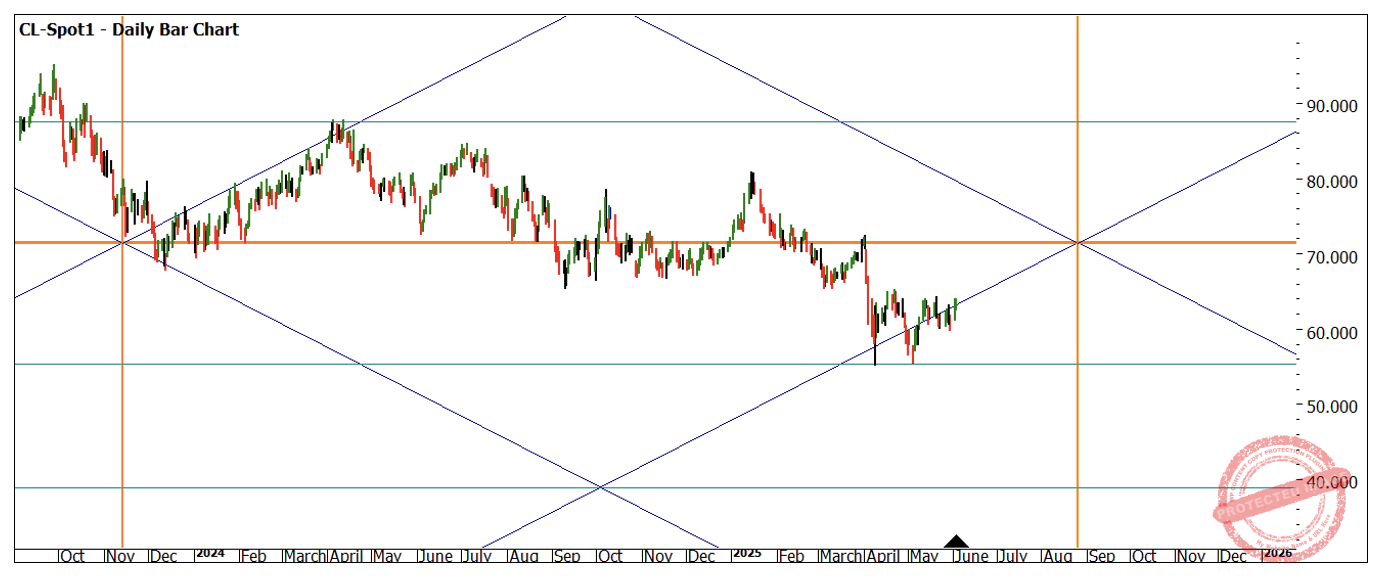
Chart 3 – CL-Spot1 Daily Bar Chart
That time pressure came in a few areas, but the one to note here is Time by Degrees and harmony around the major lows we have seen in the last 12 -18 months. If we align to the 6 June as an anchor, we see a number of Time by Degrees tags backwards and I have noted some in Chart 4.
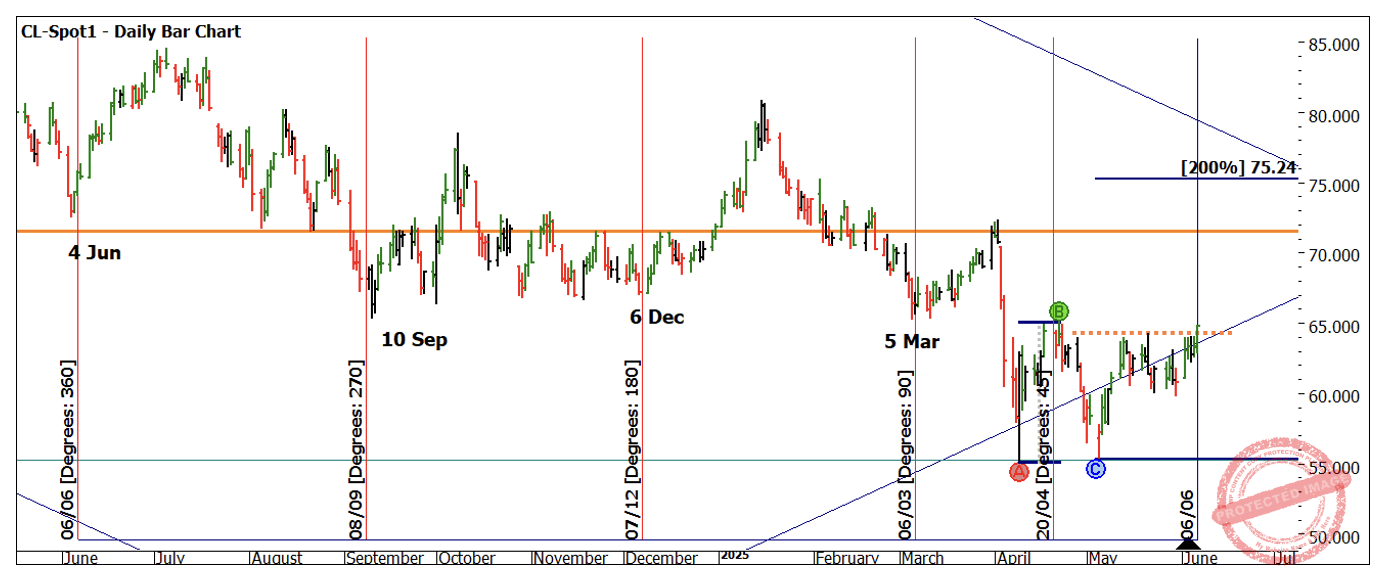
Chart 4 – CL-Spot1 Daily Bar Chart
There are other time frames that are apparent when using 6th June as a zero date and you can undertake that as an activity to research. The double bottom provided a guide for ranges to follow, and the orange dotted line was a basic entry from the Number One Trading Plan of breaking multiple bar chart tops.
A closer inspection on the numbers is in Chart 5. Entry was achieved at $64.02 with stops placed behind the previous 1-hour swing bottom at $63.18. The 200% double bottom target of $75.24 was the area I was looking for a potential exit.
Risk was $0.84 per contract, and the move came suddenly as tensions and conflict broke out. The final reward to risk was approximately 13.3 to 1.
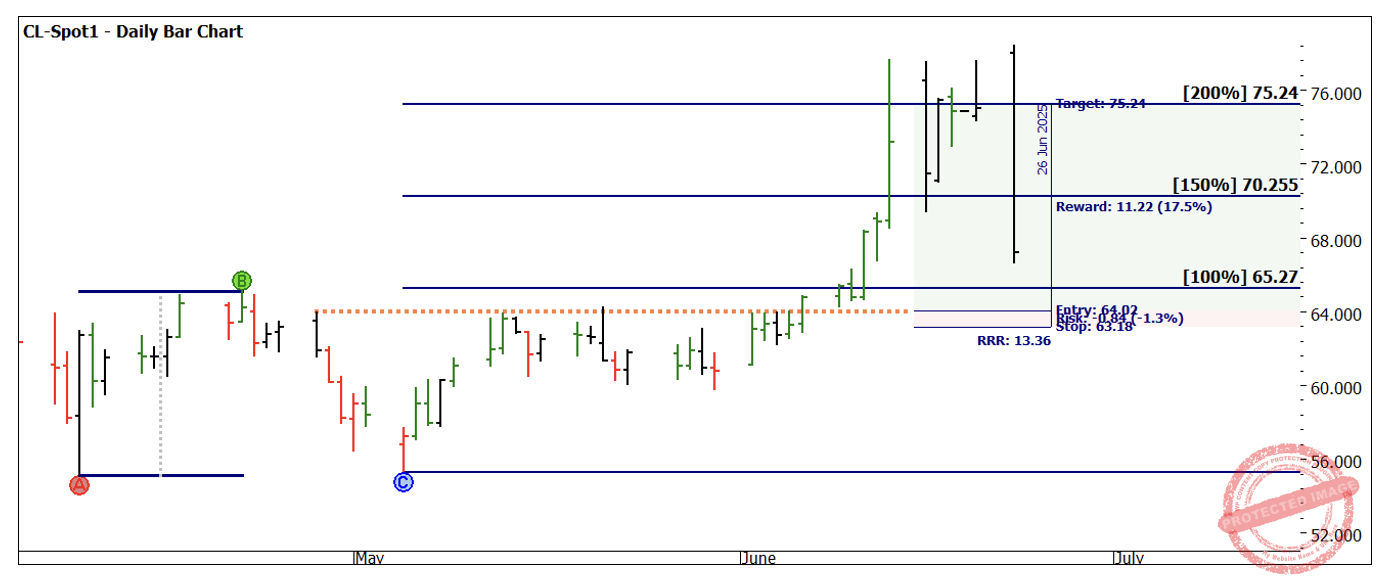
Chart 5 – CL-Spot1 Daily Bar Chart
As mentioned, the moves can be volatile and quick, and I was a little surprised by the speed of the move after entry. The 6th of June is a war date and is something I watch thanks to David’s Master Forecasting Course, for students in that arena of study I suggest you add that to the list of action items to review.
Chart 6 was acting as a guide on where the next price resistance could be all-time low to all-time high, 50% is $76.89. There have also been reasons to reverse and be short in recent sessions and I will look to cover this off in future discussions.
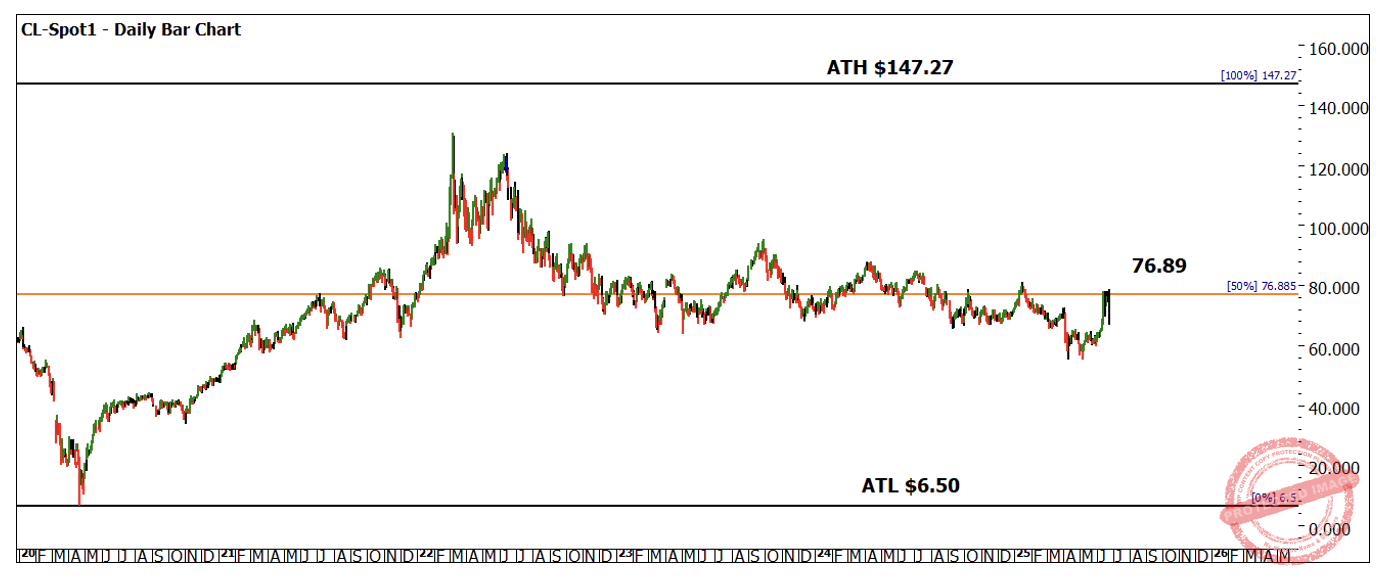
Chart 6 – CL-Spot1 Daily Bar Chart
The current high of $78.40 is an interesting price as I remember this exact price at a top in days gone by. If you head back to 2006 you will see this price on 14 July.
This move would not sit in a textbook version of a Classic Gann Setup as we did not have a clear position in the market that suggested the end of a move. It’s best described as picking up a chunk of the move once its underway. The move had completed 100% already of a 200% double bottom move, but as they say there is more than one way to skin a cat. A quick note, if you follow Crude and did not pick up this setup “easily” rest assured this is one of those positions that comes from following a market for a long time.
I look forward to sharing more on this area of the market in discussions to come.
Good Trading
Aaron Lynch