Oil in 2022
As we have discussed a number of times in what has been a very challenging and disrupted year, commodities and the inflation rate are now front and centre on the minds of markets and economic policymakers. When COVID struck, the notion of supply shortages due to increased demand would not have been the initial thought. That’s why economics can be such a challenging beast to understand. In short, we are experiencing a lag in the system in getting back to the old levels of production and delivery. It takes time in the “real” economy to turn back on the levers of production. I was only recently reading the challenge for builders small and big in obtaining timber for construction. Natural products like timber, oil and crops are produced in cycles and can’t necessarily be quickly ramped up to increase volumes.
We have seen markets become sluggish in the last quarter of 2021 as equity markets had the jitters and several commodities sold off. If you are tracking petrol prices only, you may have missed that there has been a 25% drop in the price of oil per barrel from November to December not that we have seen any relief in the cost of fuel at the pump. Again an example of the complexities of economies and raw materials.
This decline in oil prices may be the opportunity to set up into the first quarter of 2022 based on our studies of previous December months. As specialists of single markets, you should have already spent time setting up for a road map based on history for what’s to come. Some would use the term forecasting, I prefer to think of it as setting up scenarios that you can be in front of not reactive to, setting up the “big rocks” for the year ahead can make it easier to cross the metaphoric river.
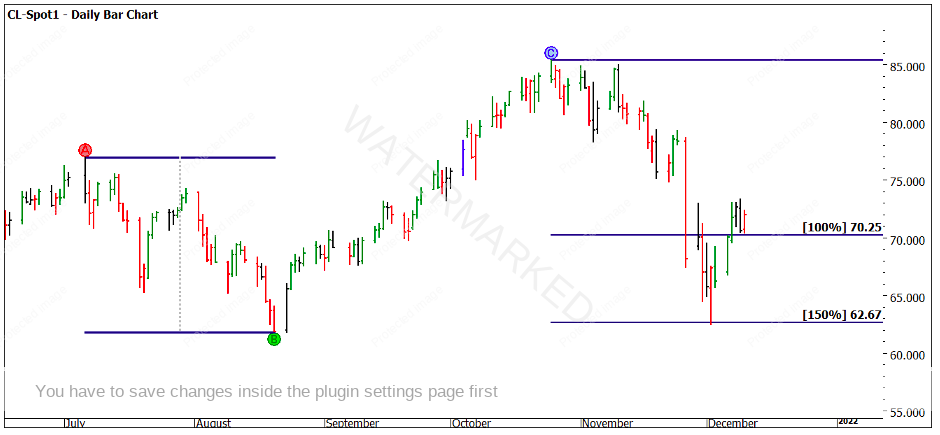
If we jump to oil, we might consider that December is a very active month for major turns, in particular lows. This aligns with the northern hemisphere winter and the demand for heating oil, a derivative of crude. Chart 1 begins simply as we measure the decline in November/December to the previous move in the same direction.
We see how 150% of the previous range has acted as support in the market. Our Road Map Chart tells us to look for a potential Point A. Whilst the low has produced a daily swing bottom, we could not be certain that this is a major low.
Chart 1 – Daily Bar Chart CL-Spot1
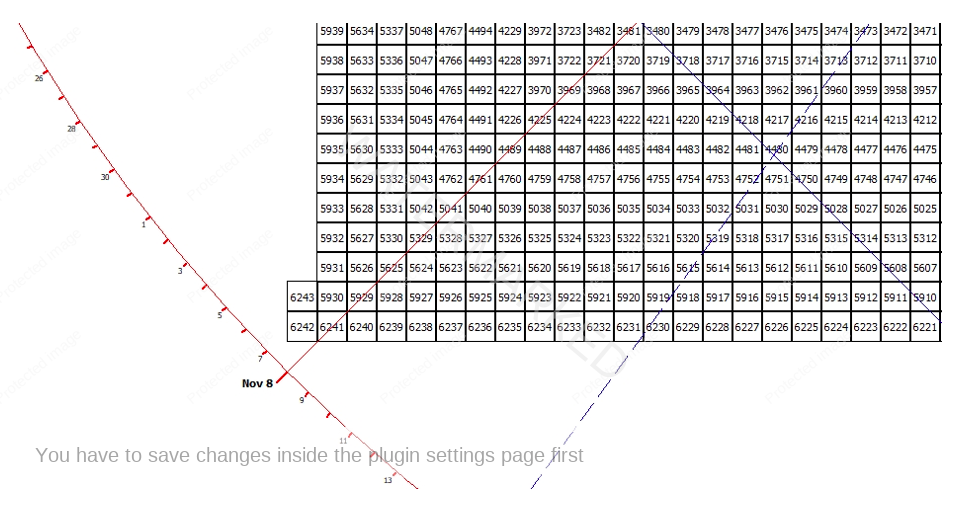
The actual low of $62.43 does come close to making a “double bottom” with the August low of $61.82. For good measure, you can always check prices on the Square of Nine to see where the price sits. In this case on the Ordinal Cross. You can also use other numbers like the range in price and time on the Square of Nine.
Another way to work with numbers that a market gives you is to use a price as a time and vice versa. I will leave you to investigate, but if the low at $62.43 is important, you may also want to use that as a time frame in say calendar and trading days and see if there is any value from the current low.
The cyclical nature of a commodity can be used as a guide to assist us in defining the broader trends. If you were looking to understand the opportunities that exist in oil, you should commit some time to look at the first quarter of each new year, are they bullish/bearish or neutral. You should also look to see how these trends correlate to the frequency of lows in November /December.
This data on every year can provide some strong insights, it would be wise to study in particular the years that align with our Master Time Cycles. One of the major cycles Gann and David discussed were 10, 20- and 30-year cycles. We will not always find the year we are in provides us with the start of a major cycle; we may find that there is a cycle underway that we need to pick up on.
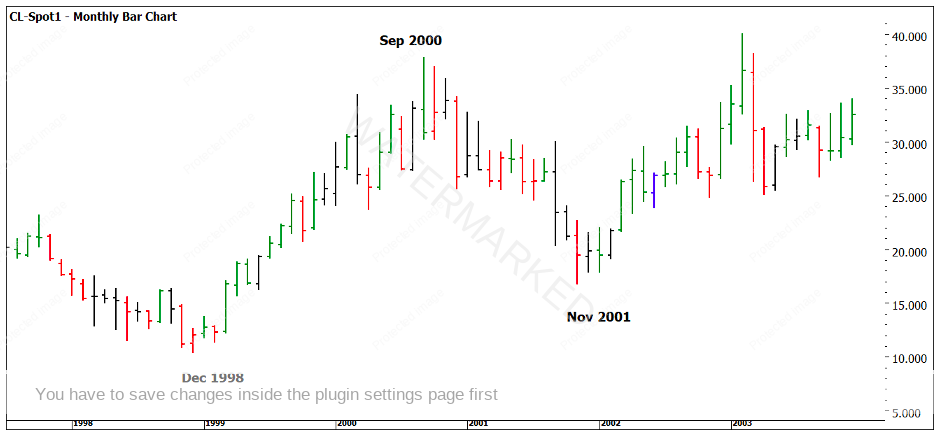
As David said if we pick up on a cycle halfway through there’s still the opportunity to participate in what’s left. In the case of oil, again, I have some homework for you. There are a number of major turns that we see occur in certain years over and over again. The 8th year of each decade has often produced what we could call a Point A. The 10th year of the decade has often been a Point B and the 1st year of the decade may be a potential Point C. Of course, they can be tops or bottoms but if we use those points as large rocks, we may be able to set up for the year ahead.
Chart 2 shows an example of this pattern starting back in 1998/2000/2001.
Chart 2 – Monthly Bar Chart CL-Spot1
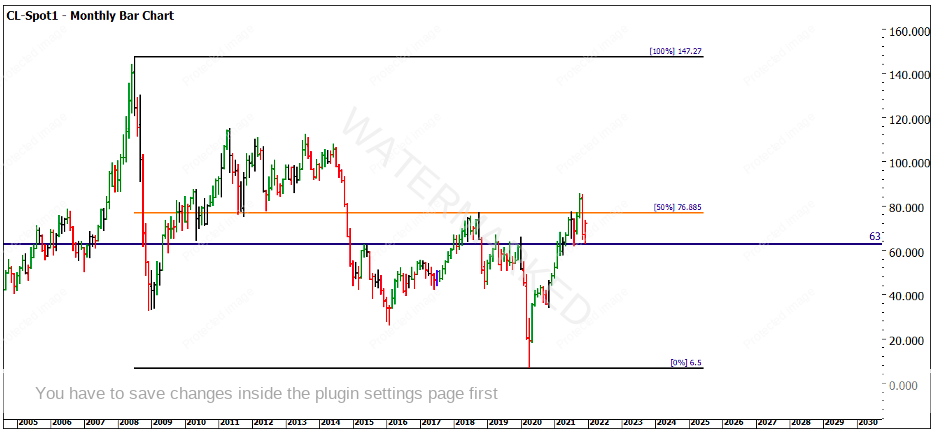
Chart 3 looks at the big picture using a retracement tool from the All-Time High to All-Time-Low. We have a series of old tops and bottoms clustering around $63. This may be an area to watch for support in the current market. The 50% level at $76.89 is key to any future upside potential. We would need to see strong closes above this level to get serious about a longer-term uptrend.
Chart 3 – Daily Bar Chart CL-Spot1
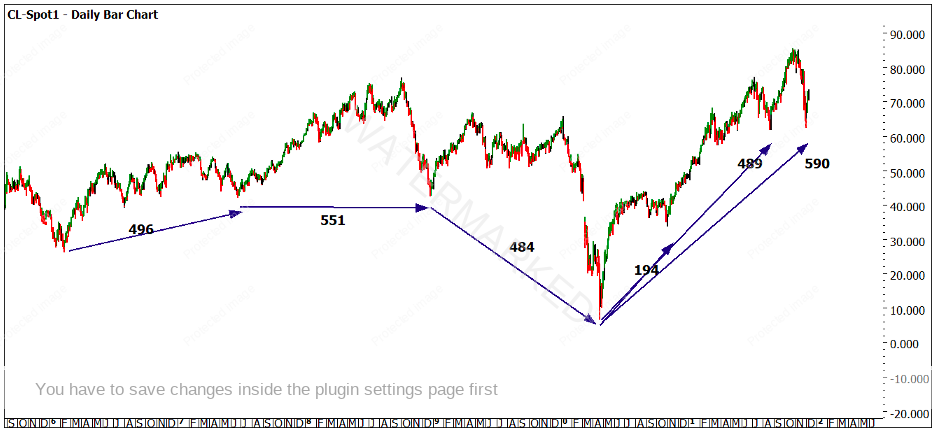
The final chart I will leave you with for 2021 looks at the time frames between major lows. There is some harmony here for those prepared to dig into the story. Lows on oil are often clear cut where highs can be frequent and make analysis more challenging. If we follow the repetition, then the August low that came in at $61.74 may already be the physical low as opposed to the December low.
Chart 4 – Daily Bar Chart CL-Spot1
You should research the proportions of these time frames and go back and see where they appear historically.
I wish you all a safe, relaxing and happy Christmas and prosperous 2022.
Good Trading
Aaron Lynch
