
On the Contract Change
Last month I left us looking at two scenarios on the SPI200. The first being the market making triple tops on a trend line of previous all-time highs, or the market breaking through and then watching the next major yearly milestones as a possible point of resistance.
At the time of writing last month, we had seen the SPI200 make an intraday high at 9239. This ended up being the high of the day but the trendline hadn’t been hit at this stage.
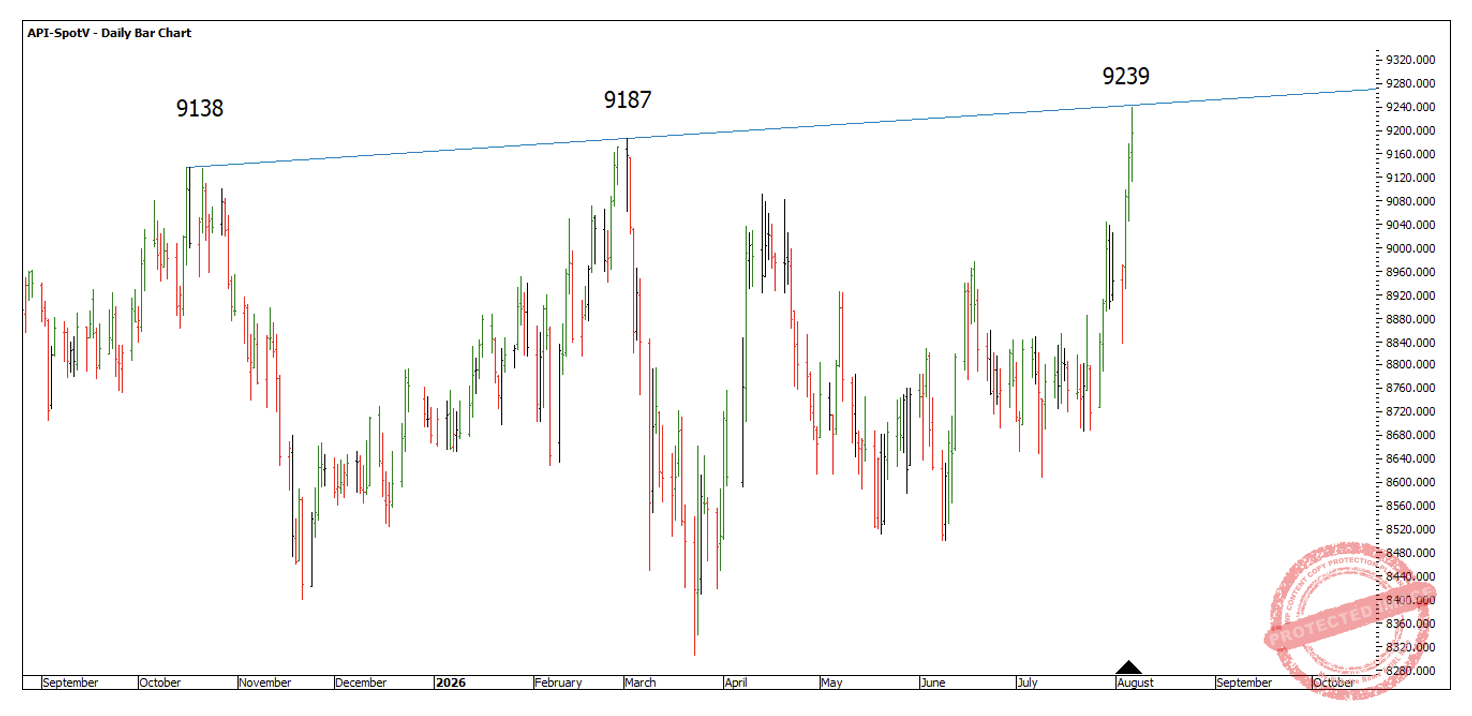
Chart 1
Two trading days later and the SPI pushes up and hits 9266 on 10 August. This day was an outside reversal signal day with a low close, closing lower than the previous two trading days and closing below the previous high of 9187. This is a textbook signal bar on price resistance.
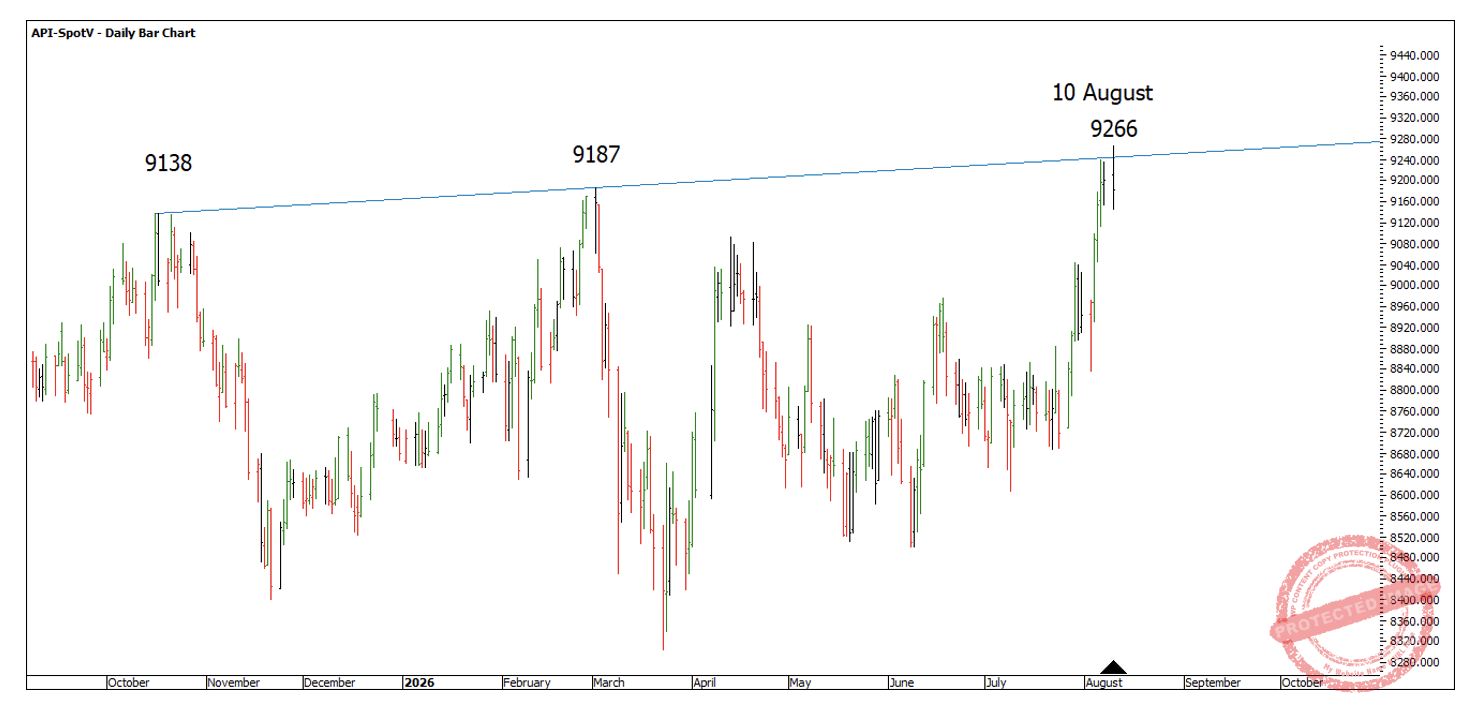
Chart 2
The market ran down into an 18 August low at 8947, then rallied back up into a lower top on 26 August at 9176. Often, it’s the lower top that can have better price pressure harmony, so we can now examine 26 August to see if the rules of W.D Gann can call the lower top.
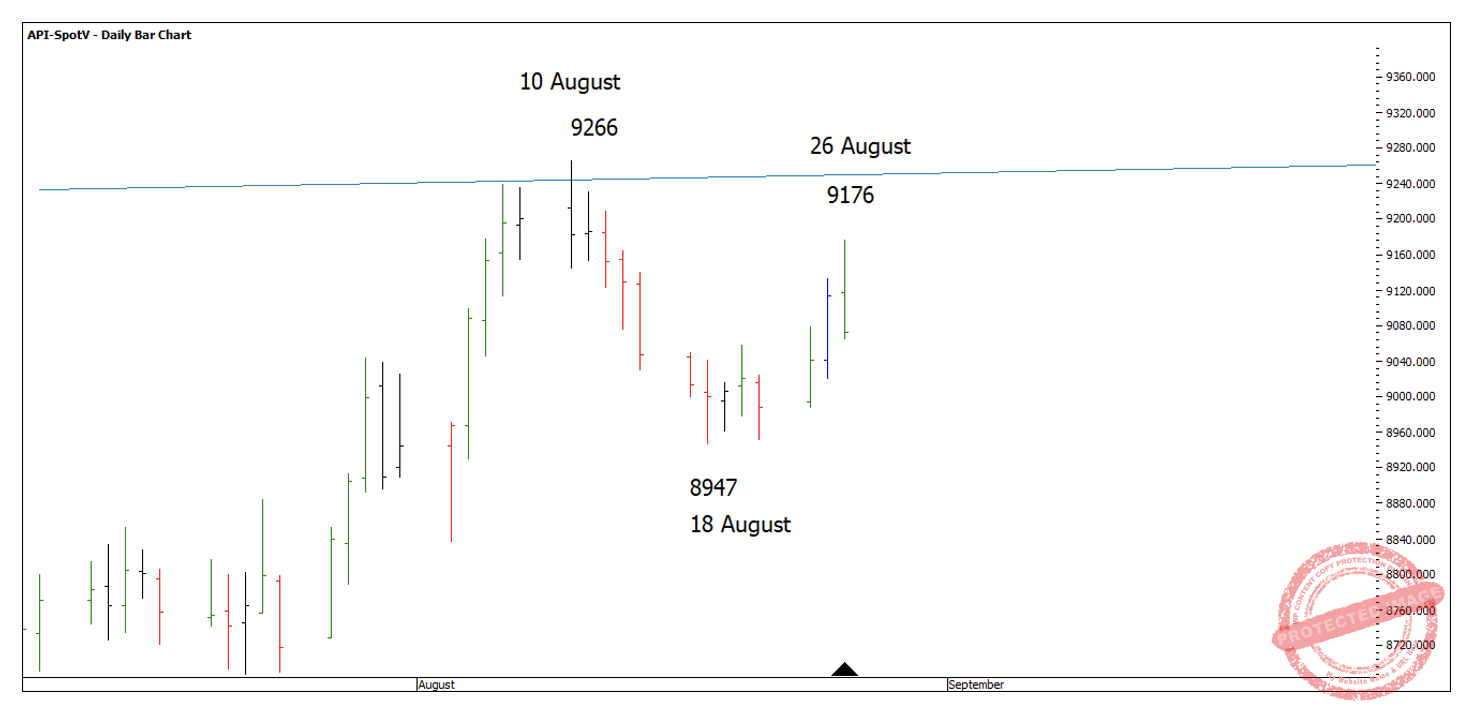
Chart 3
One of my favourite price milestones is the 200% and coincidently it’s 200% of the First Range Out that I love the most. This is because the probability of a swing range going past 200% decreases. If I run the 200% of the First Range Out from the 18 August low, we see it called for a price of 9174, and within 2 points of the top.
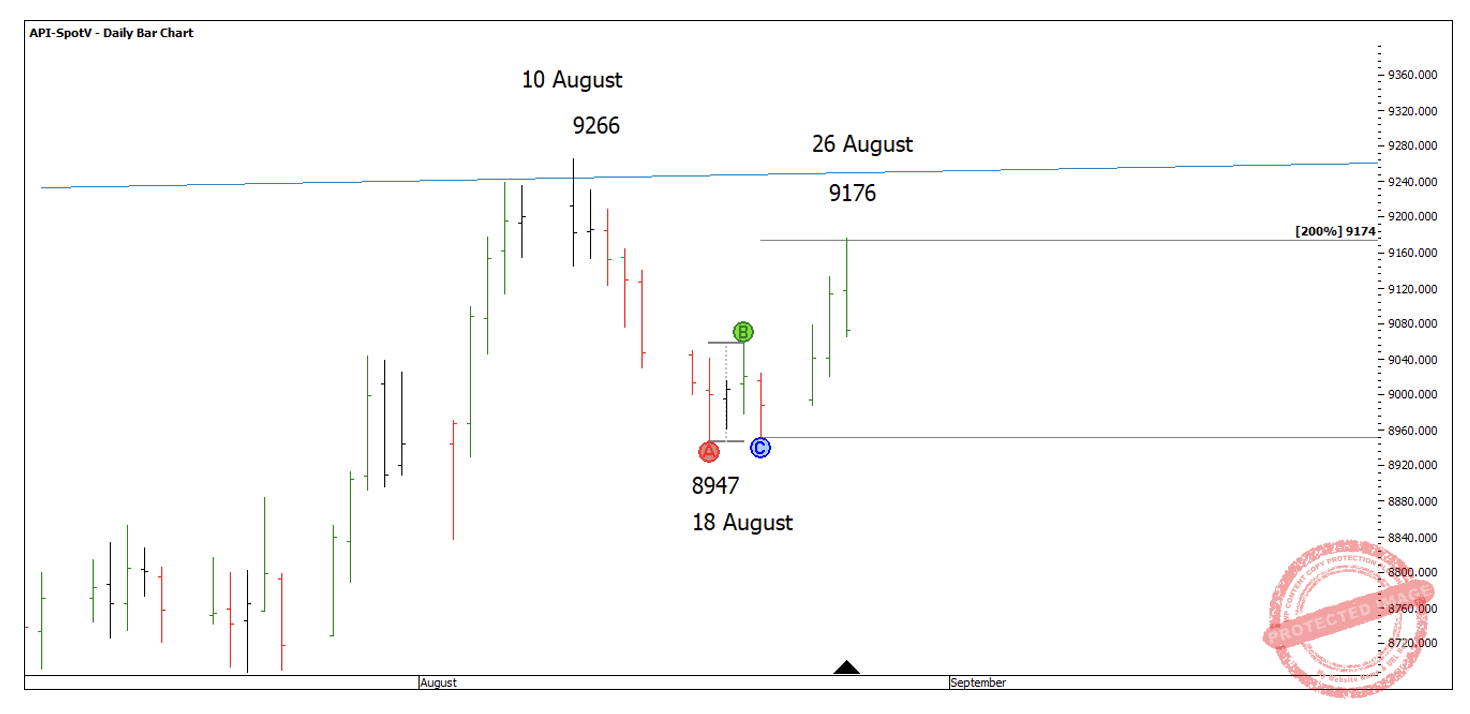
Chart 4
Then if you run the last daily swing range up you will see this price of 9174 also clusters with 50% at 9161.
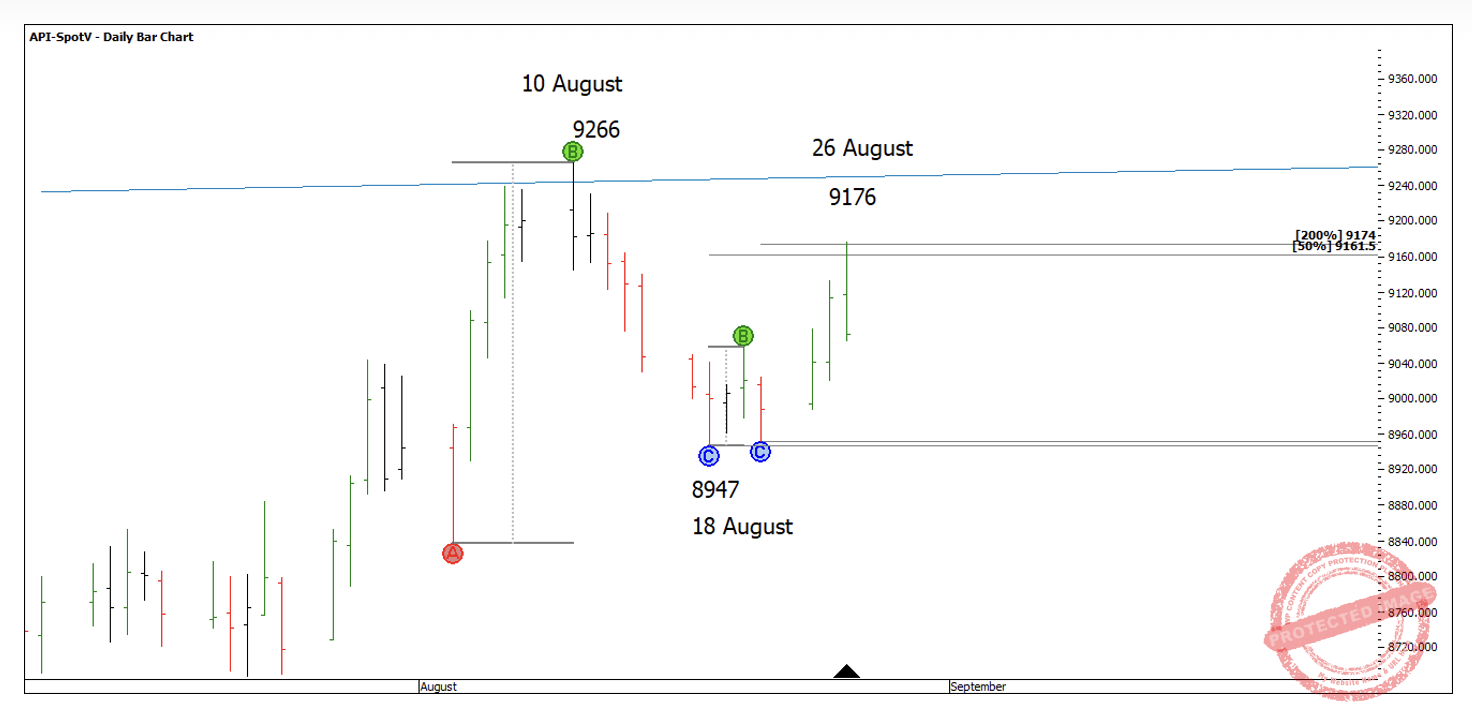
Chart 5
Now if you add the recent Ranges Resistance Card, you will also see these two price milestones clustering with the two thirds milestone or 66.6% at 9159.
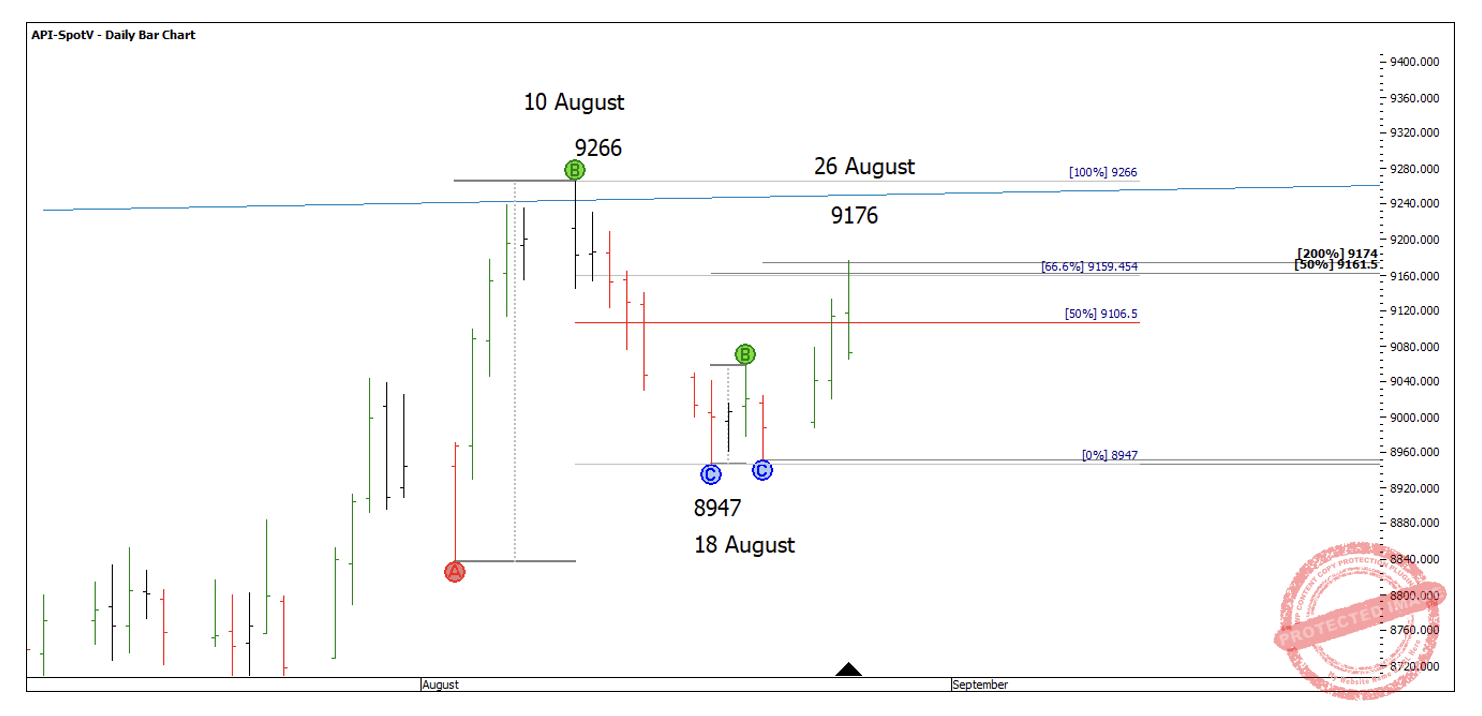
Chart 6
Now that I have three good price milestones that cluster tightly together, I can look for an entry. The first thing I’m sure you have already noticed is the signal bar on the day of the top which gave you a very low close and well under the 50% retracement level of 9106.
Depending on your risk tolerance and what kind of time frames you like to enter on, you could have entered the following day as the daily swing chart turned back down. The only problem is the low risk to reward ratio return you would have got if you had an exit plan for the 100% milestone.
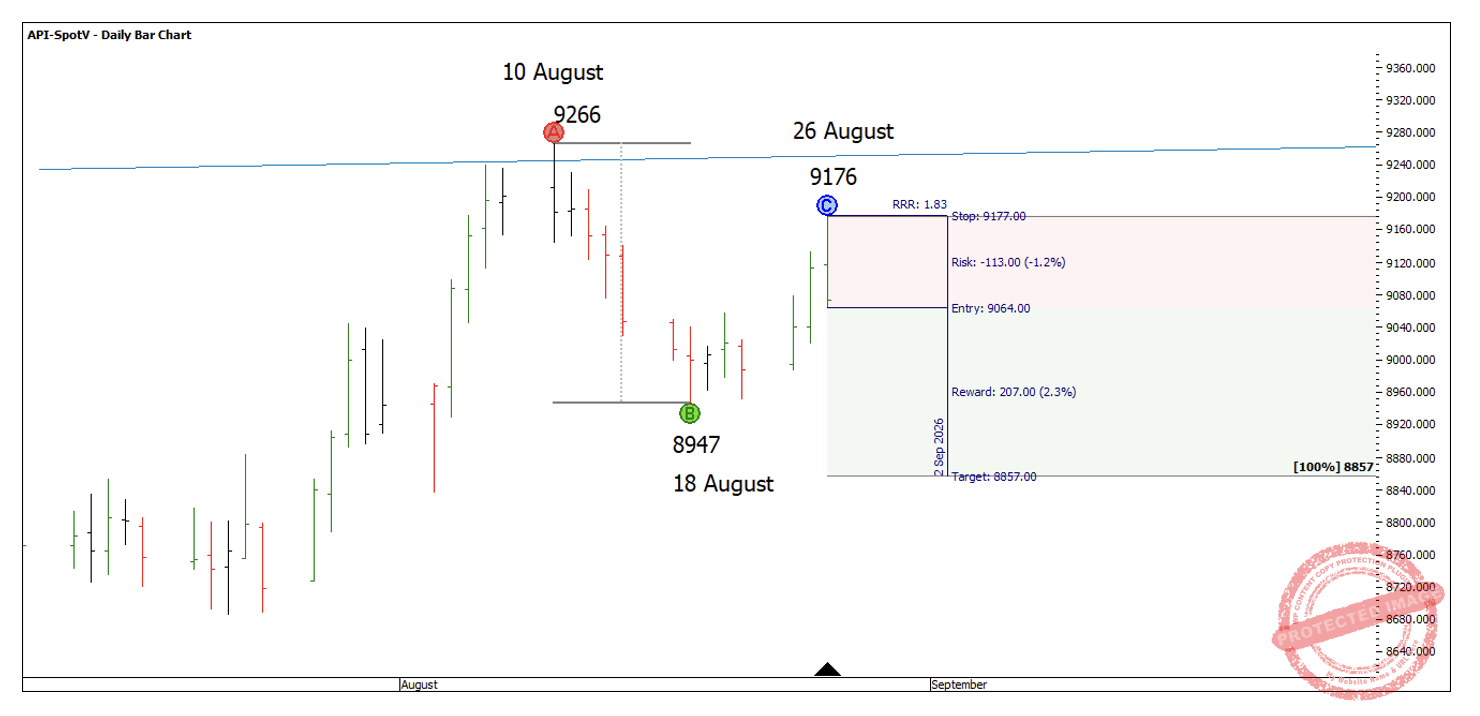
Chart 7
In this case you may have wanted to look at the 1-hour intraday chart to get an entry where your initial stop isn’t as far away. Barchart.com below shows the September contract (APU26) and a clear signal bar with a risk of 53 points which more that halves the risk from the daily bar.
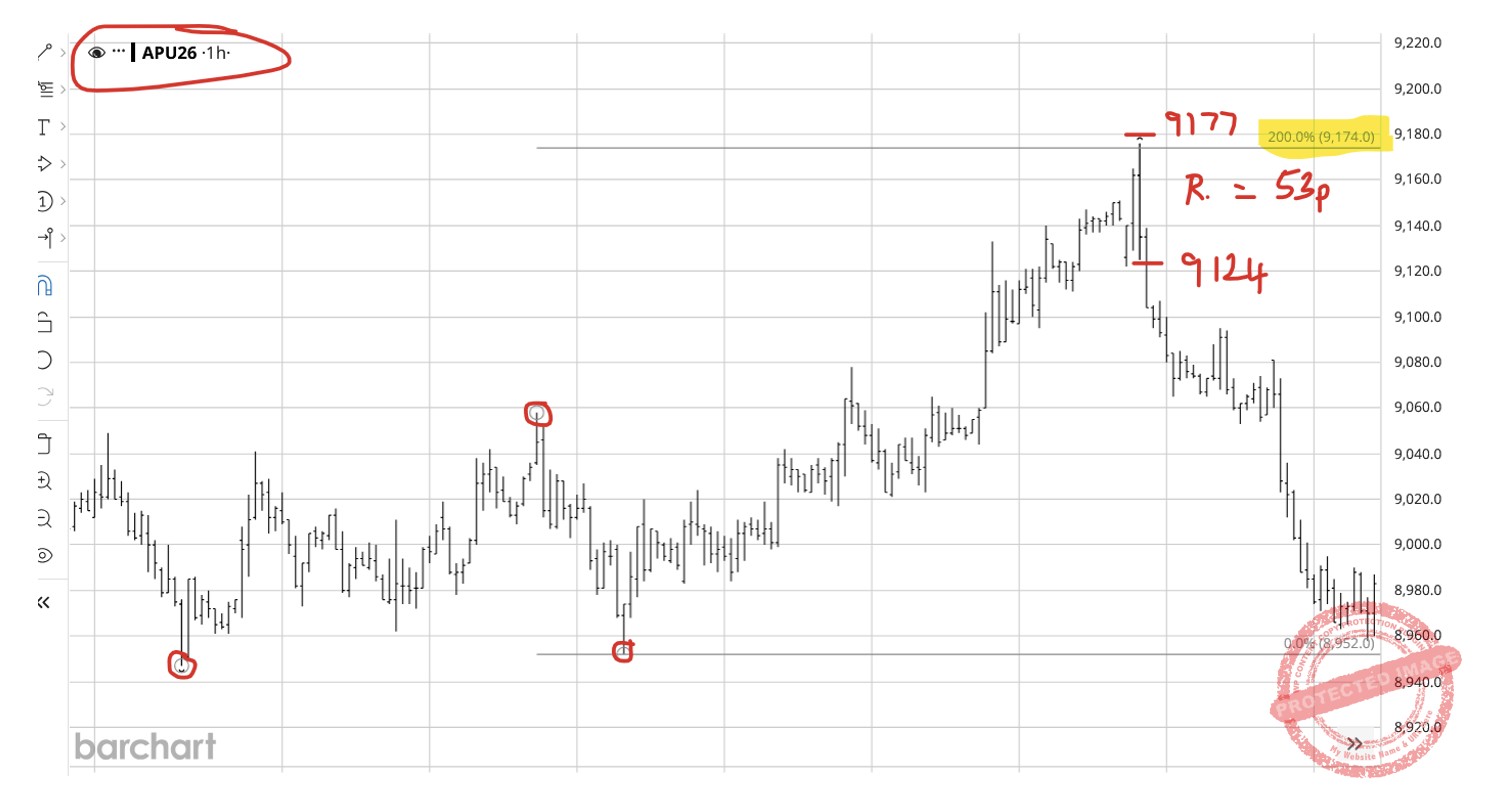
Chart 8
This now bumps up the reward to risk ratio to a 5 to 1 if looking to exit at the 100% milestone.
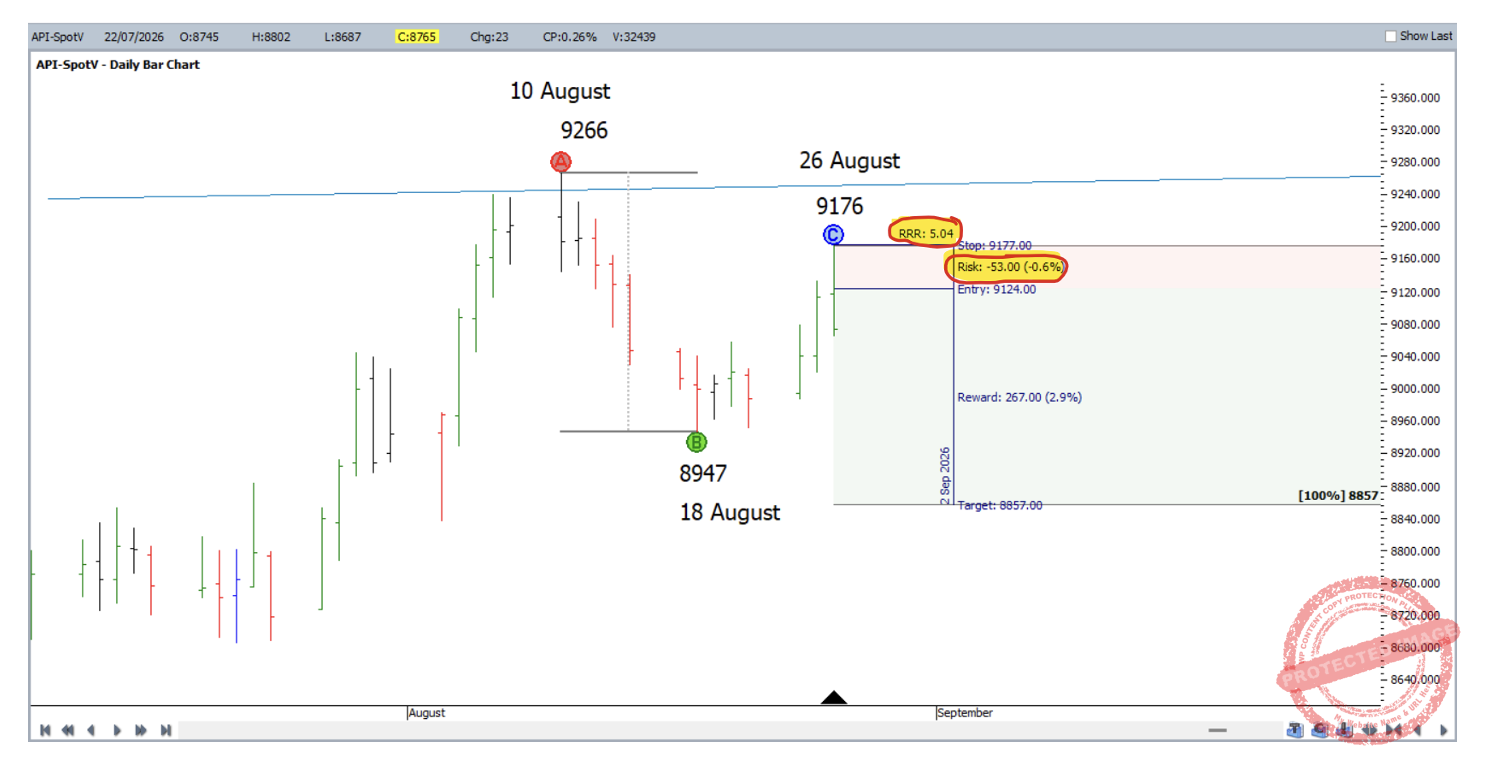
Chart 9
The SPI200 has since made a low on the September contract at 8604 which is a double bottom with the 9 July weekly swing low. Keep in mind the September contract is at expiration and the API-SpotV doesn’t show this 8604 low as the December contract is now trading with more volume.
If I run the major milestones from the most previous ranges combined with the monthly Ranges Resistance Card, I can see two areas where price milestones cluster together. For this I’ve used the API-Spot1 chart to include the 8604 low, as the market has traded at that level.
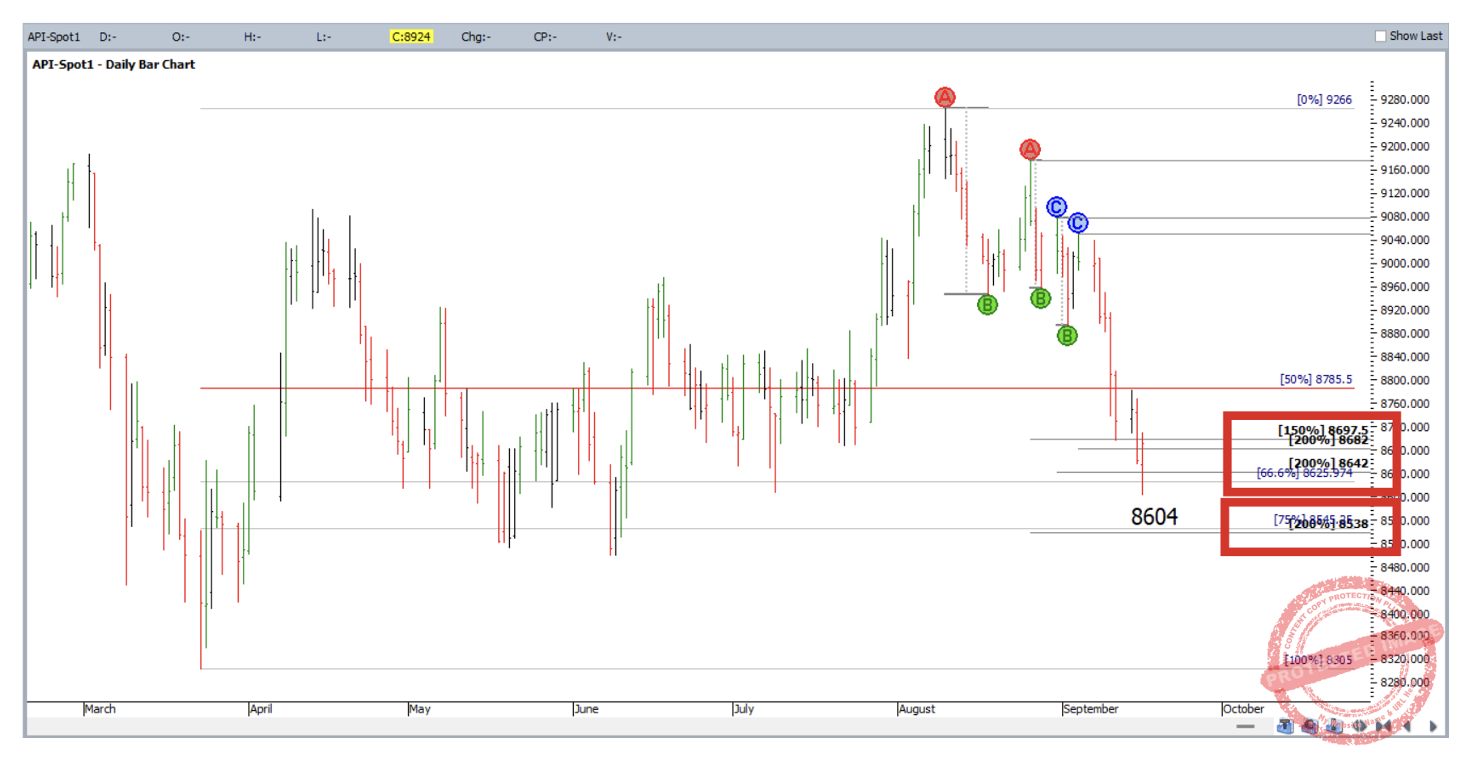
Chart 10
Due to the market putting in a big expanding weekly and daily swing down, the 50% Ranges Resistance Card milestone of 8785 may be key to watch to see if it either acts as support or resistance.
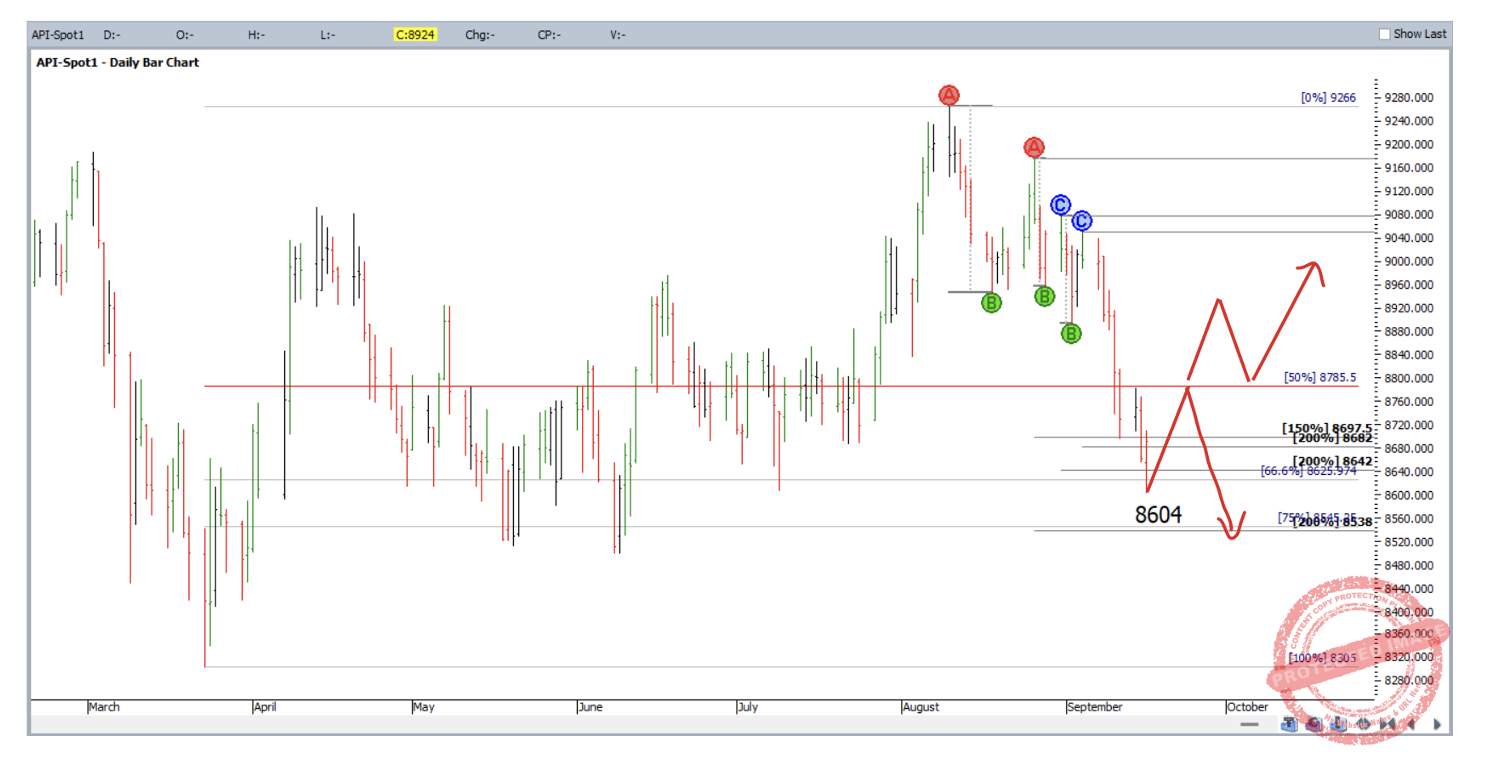
Chart 11
Happy trading,
Gus