One From the Metals
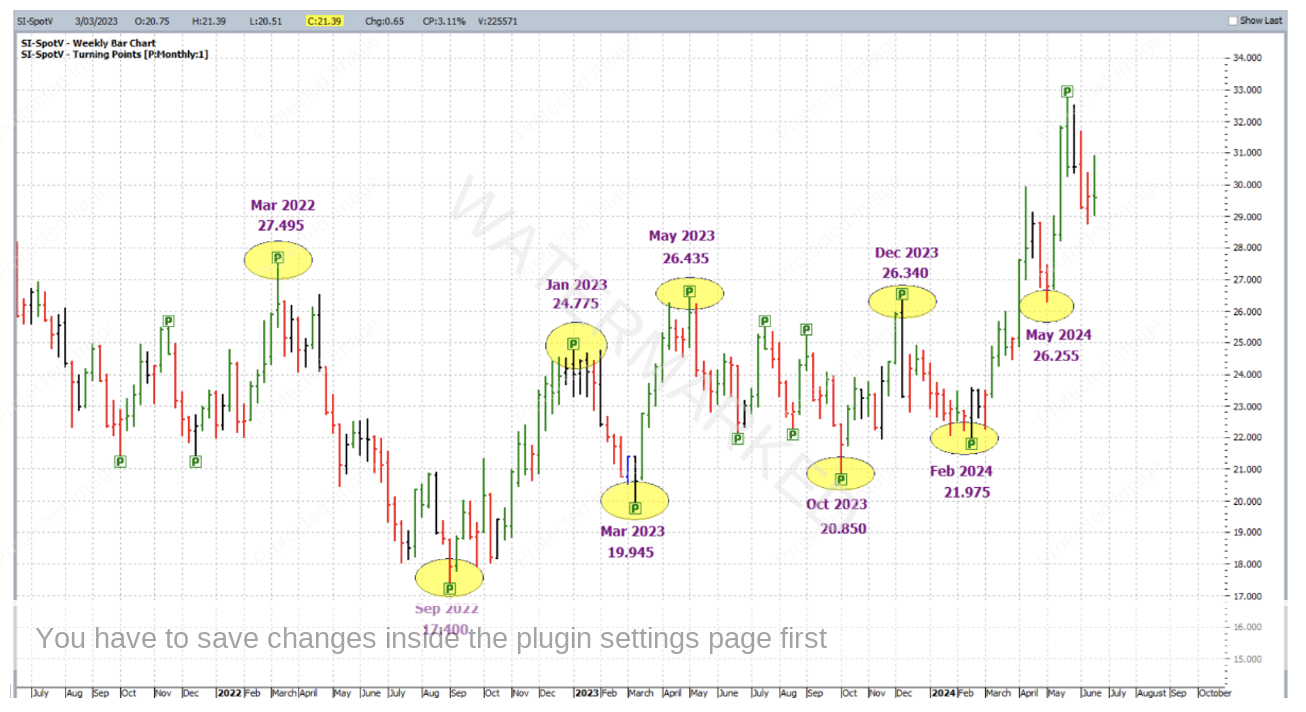
Quite recently, constituents of the metals sector, which includes Copper, Platinum, Gold and Silver, have presented some clear turning points and reasonably strong trends. For example below is the weekly barchart of Silver futures, from ProfitSource, chart symbol SI-SpotV. Most of the recent monthly turning points have been highlighted.
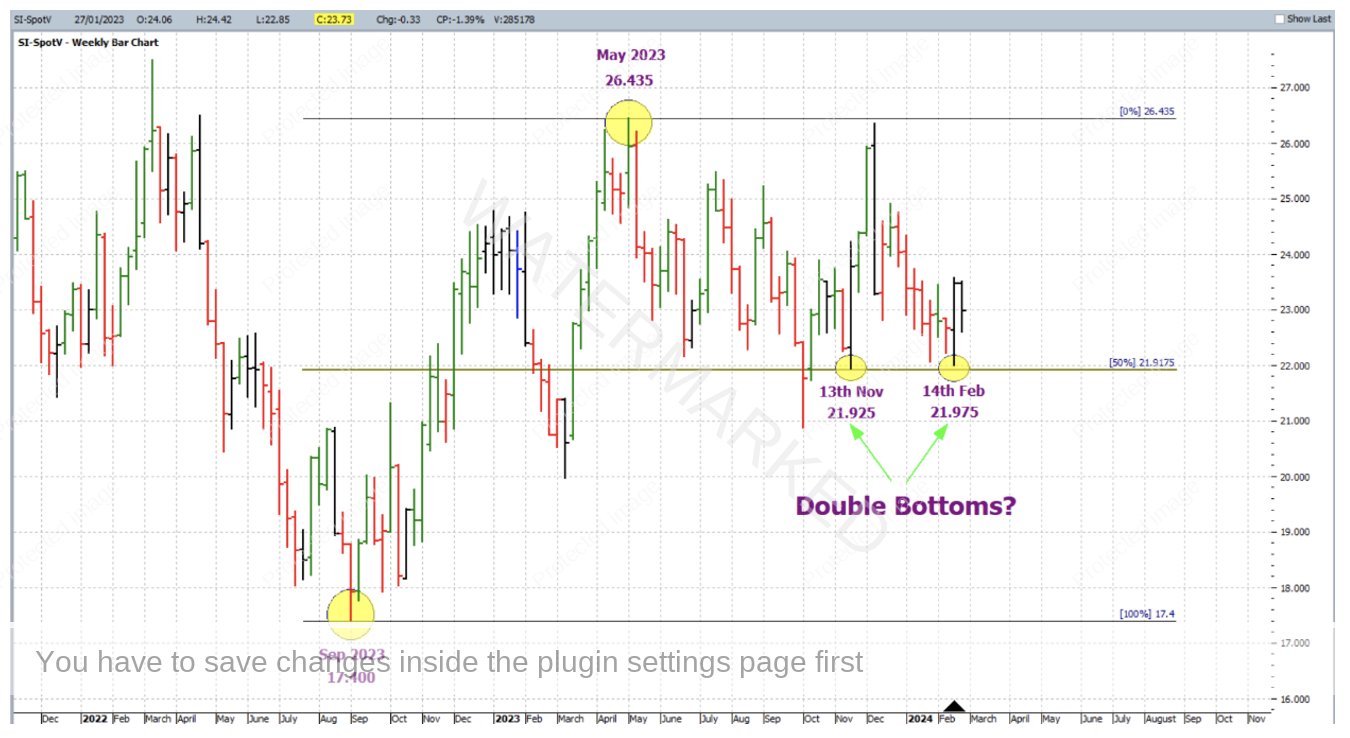
Diving straight into some analysis, as at 14 February 2024, the market had reached a low of 21.975 USD per troy ounce – close to making an exact double bottom pair with the 13 November 2024 low of 21.925, and to back it up, this was extremely close to the 50% resistance level (approximately 21.920) of the Ranges Resistance Card applied to the range from the September 2022 low (17.400) to the May 2023 high (26.435). This is shown below on the same chart in ProfitSource’s Walk Thru mode.
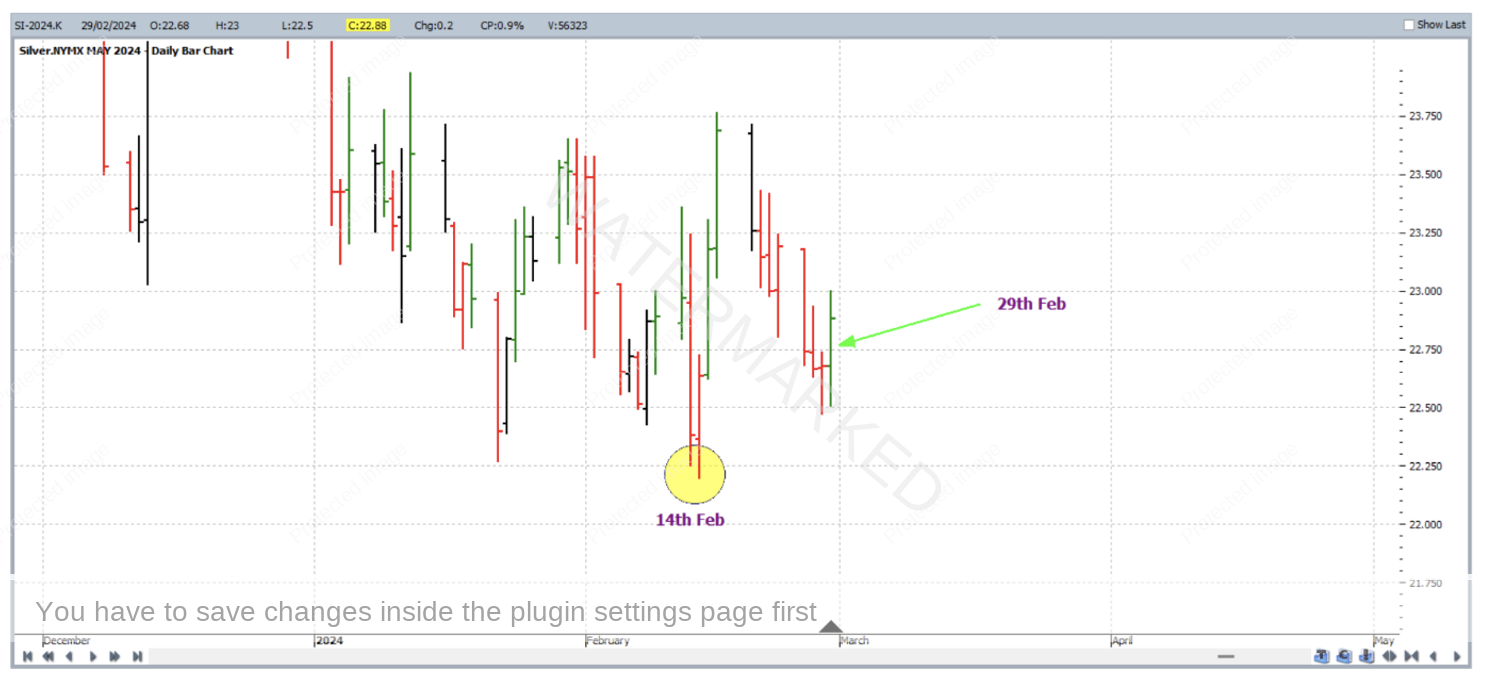
As for a trade entry, confirmation of the first higher swing bottom on 29 February 2024 would have had you long the May 2024 Silver contract at 22.740, with an initial exit stop at 22.465; this is shown in the chart below of the individual contract for May 2024 silver (chart symbol SI-2024.K) because the entry was taken just as the May contract took over the March contract in terms of volume. That being said, the SpotV chart is still the basis of trade analysis and subsequent trade management in this article.
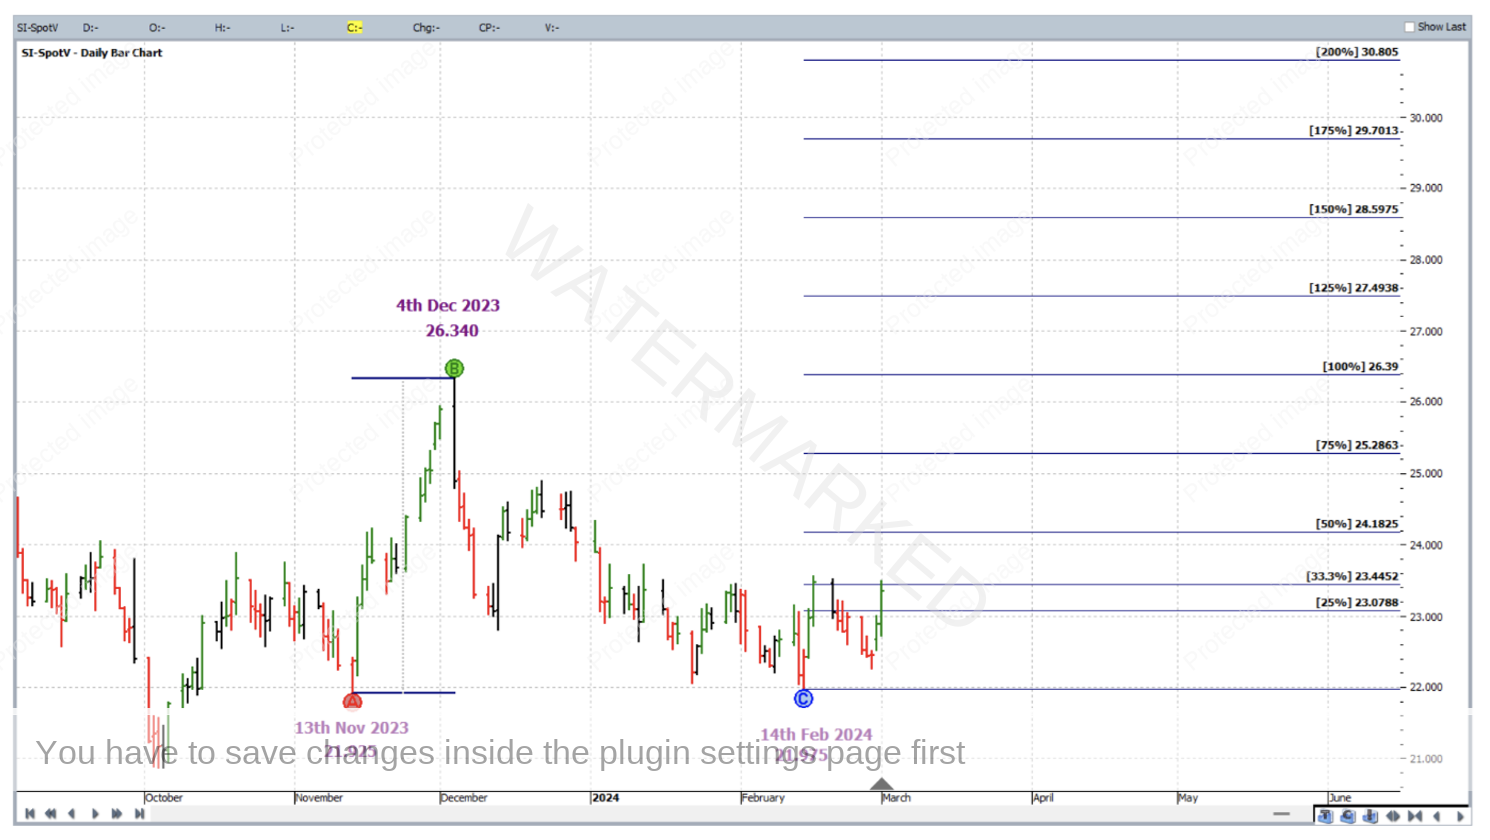
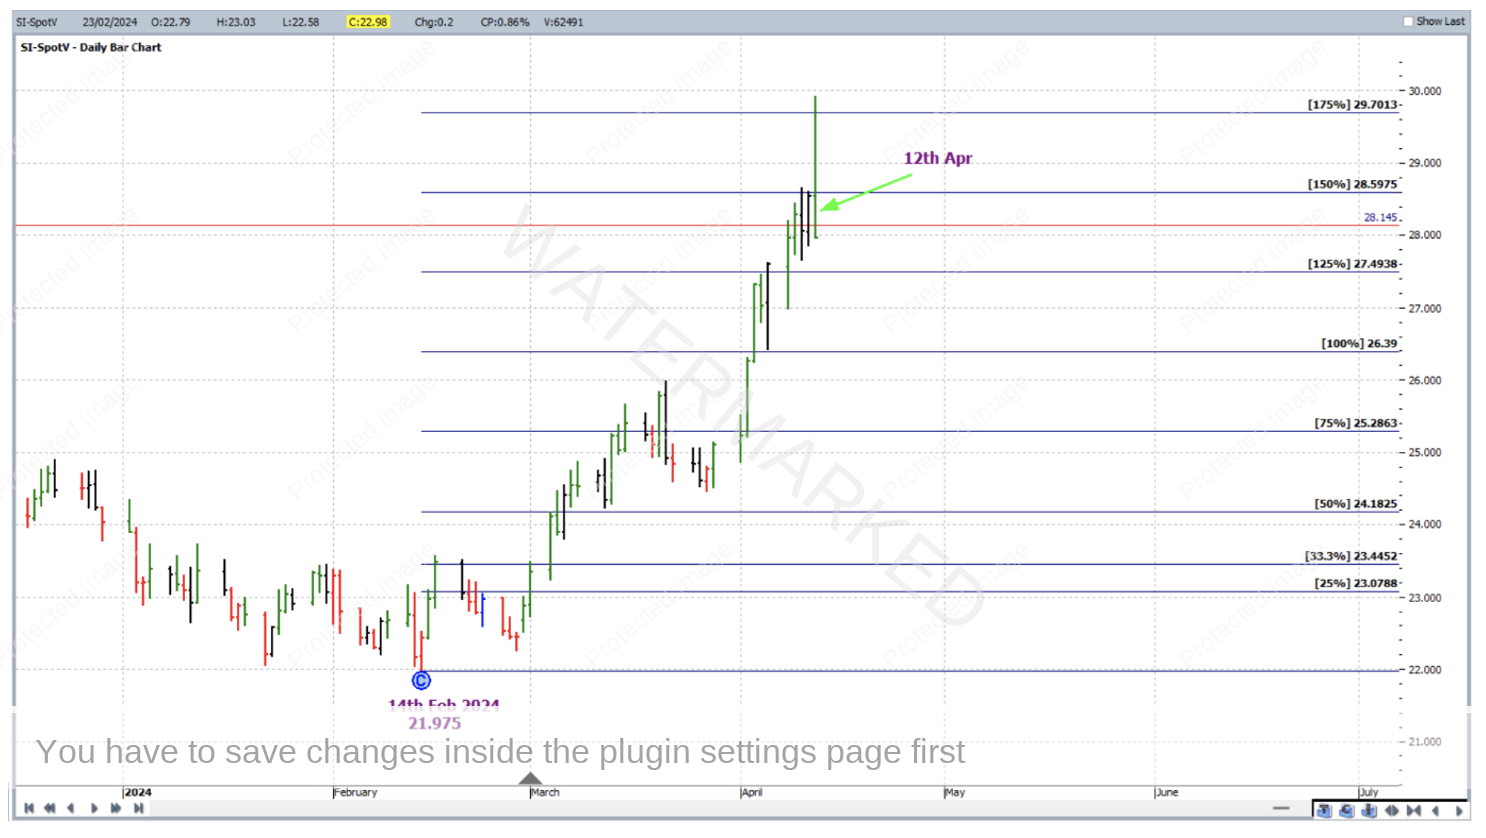
More specifically with regards to trade management, with Points A, B and C applied as per the chart below, exit target was set to the 200% milestone of the double bottoms, with stops to be managed currency style. This means that as each multiple of 25% was reached, stops were moved up to one third of the average weekly range (based on the last 60 weekly bars) below the previous milestone.
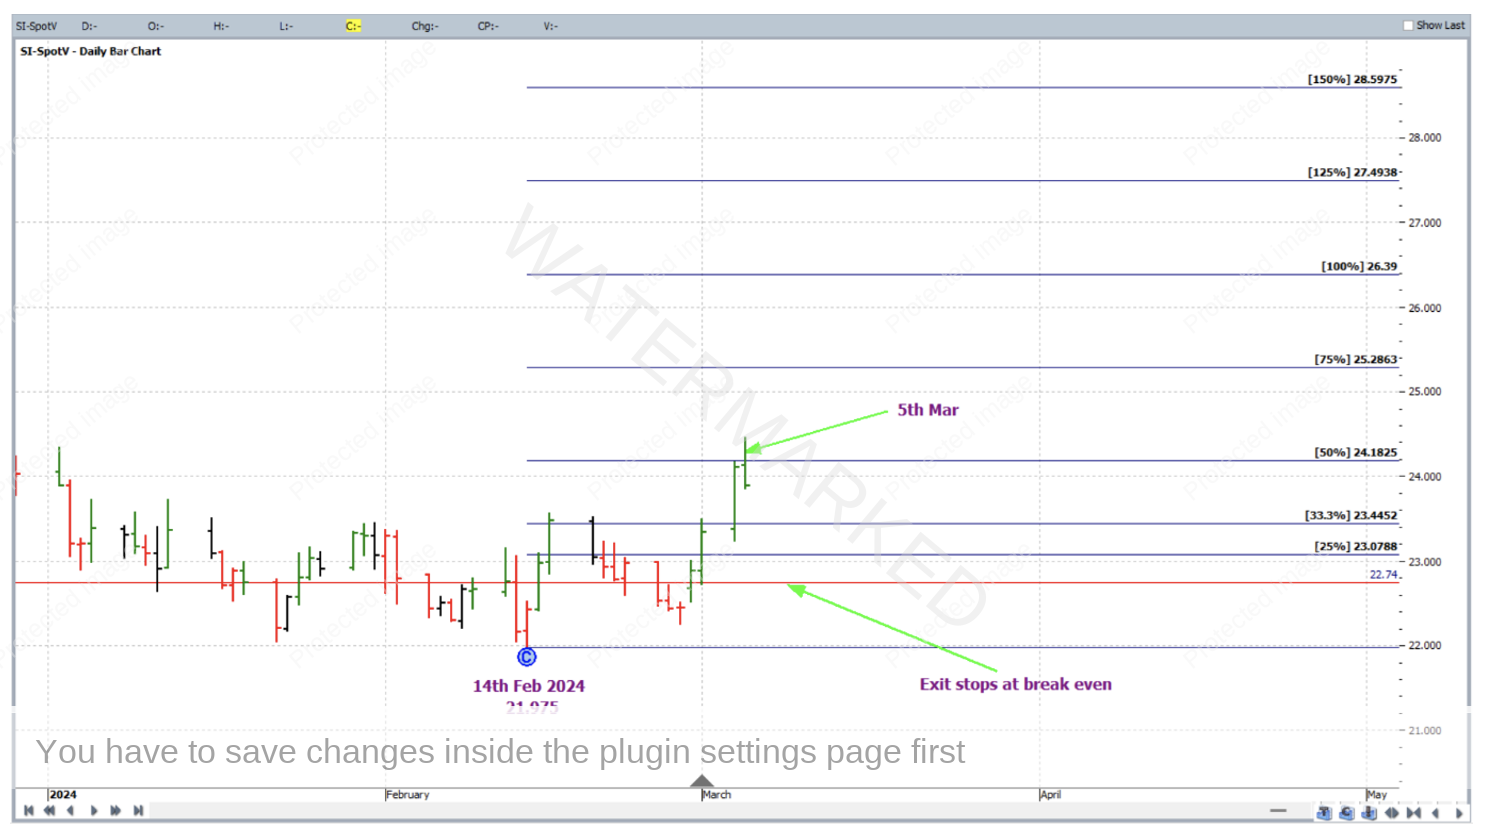
On 5 March 2024, the market reached the 50% milestone and stops were moved to break even.
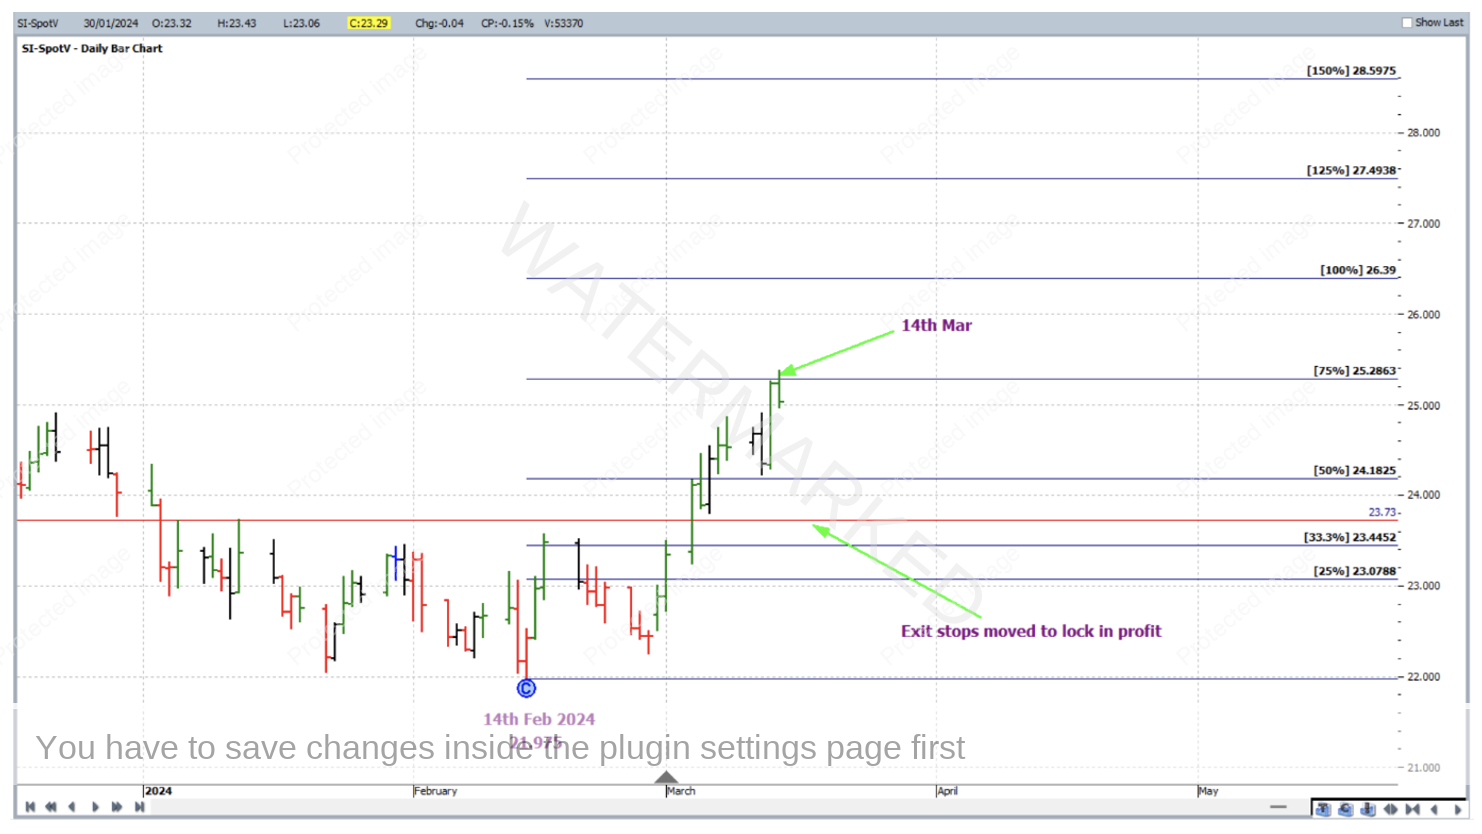
On 14 March 2024, the 75% milestone was reached and exit stops were moved to one third of the average weekly range (approximately 0.450) below the 50% milestone (i.e. to 24.180 – 0.450 = 23.730) to lock in some profit.
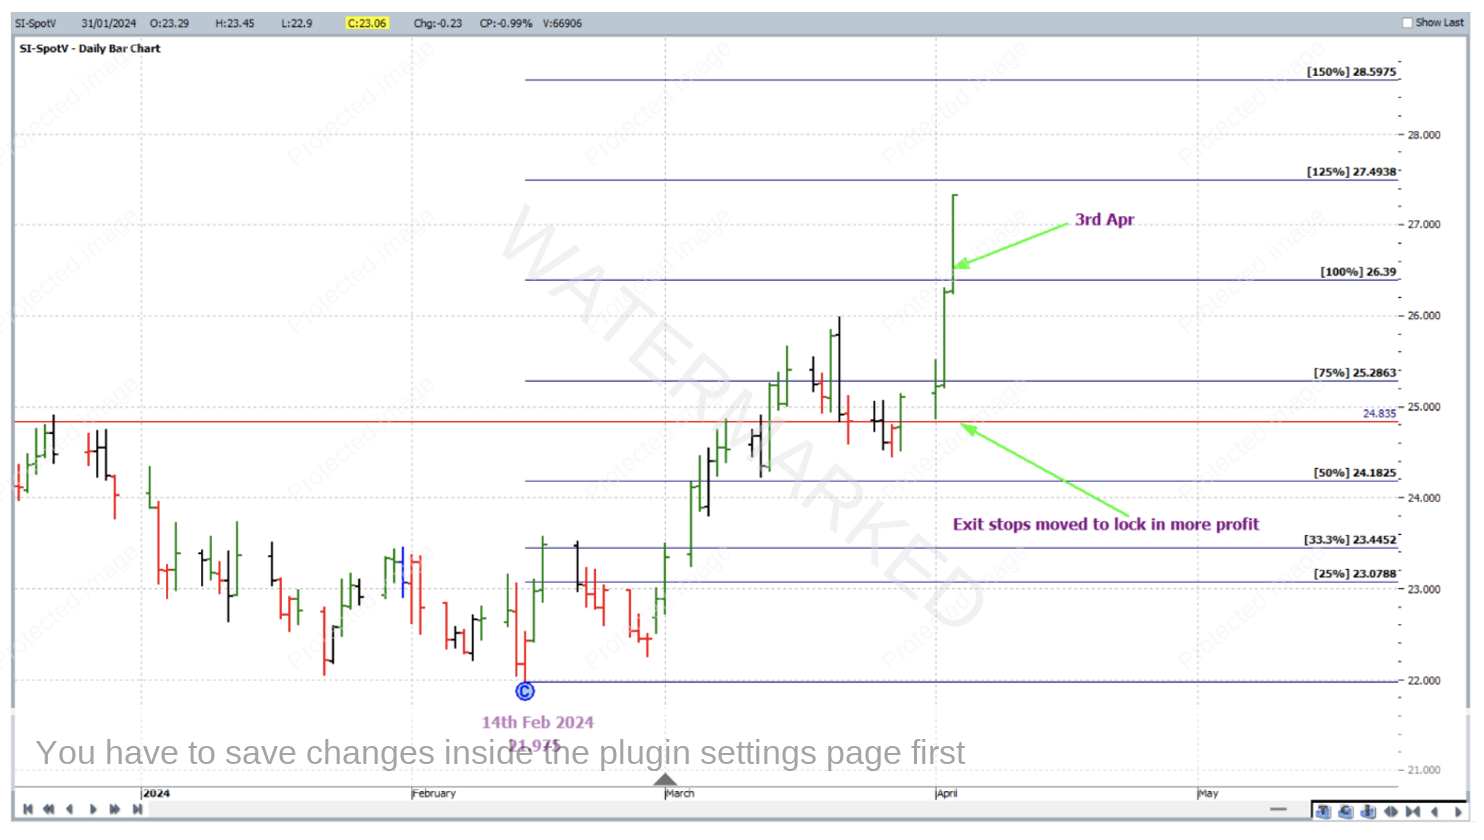
On 3 April 2024, the 100% milestone was reached and exit stops were moved to one third of the average weekly range behind the 75% milestone to lock in more profit.
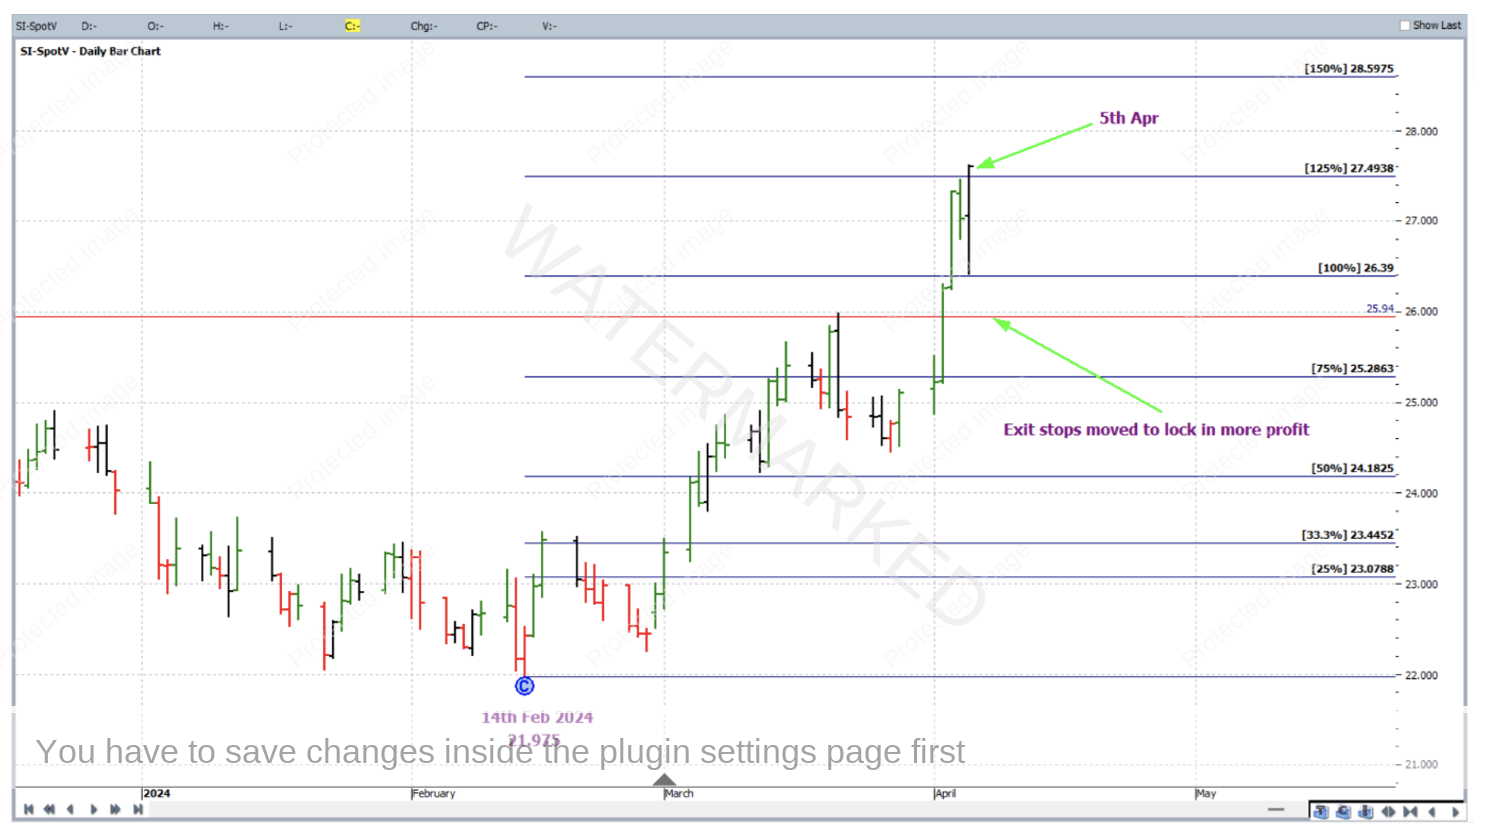
On 5 April 2024, the 125% milestone was reached and exit stops were moved to one third of the average weekly range behind the 100% milestone to lock in more profit.
Continuing with trade management in this way, on 12 April 2024, as soon as the market reached the 175% milestone, stops were moved to below the 150% milestone and were triggered when the market reacted back down to hit that exit stop – all on the same day. Trade exit was at 28.145.
Now to break down the rewards. First of all, let’s take a look at the Reward to Risk Ratio:
Initial Risk: 22.740 – 22.465 = 0.275 = 55 points (point size is 0.005)
Reward: 28.145 – 22.740 = 5.405 = 1081 points
Reward to Risk Ratio = 1081/55 = approximately 20 to 1
Assuming that a maximum 5% of the account size was risked across the range of the daily bar at entry, the gain in account size would be as follows:
20 x 5% = 100% – that’s a doubling of the account!
Each point of price movement changes the value of one Silver futures contract by $25USD, so in absolute USD terms the risk and reward for each trade of the contract was determined as:
Risk = $25 x 55 = $1,375
Reward = $25 x 1081 = $27,025
At the time of taking profit this reward was approximately $41,500 AUD. This market can also be accessed via CFDs where much smaller minimum positions sizes are available.
Even though this trade didn’t make it to the 200% milestone, sticking to the plan would have had you still exiting with a high Reward to Risk Ratio and considerable percentage gain to the account size.
Work hard, work smart
Andrew Baraniak
