Panic Buying
It’s not only happening with oil this month! I’m back to the commodities space with a great looking long trade from the Soybean Oil futures market. Before analysing, let’s talk about which chart. Most trading software offers more than one version of chart for each of the main commodities, which begs the question, which chart should be used? And fair enough, due to price differences between successive contracts not every chart gives us the exact same analysis.
In ProfitSource for example, for Soybean Oil futures there is NBO-SpotV (which continuously draws price data from the contract trading with highest volume at the time), and then it has price charts for individual contracts (e.g. NBO-2026.H for the March 2026 contract), which run from the birth of that contract, and discontinue at its expiry.
Due to the seasonal nature of the commodities, at any one time the current and various Soybean Oil futures contracts can definitely be trading a different prices to one another. Sometimes these differences are significant enough to have a bearing on the outcome of the analysis. To answer the question though, we keep an eye on all of charts, and look among them for reasons to trade.
Now for the analysis. First of all, in ProfitSource applying a Gann Retracement tool to the weekly bar chart of the March 2026 contract, we implement a Ranges Resistance Card and note that around the middle of December the market came to sit on the all-important 50% resistance level (approximately 48.15 US cents/pound). The December low at that point was at 48.05; a false break of only 10 points.
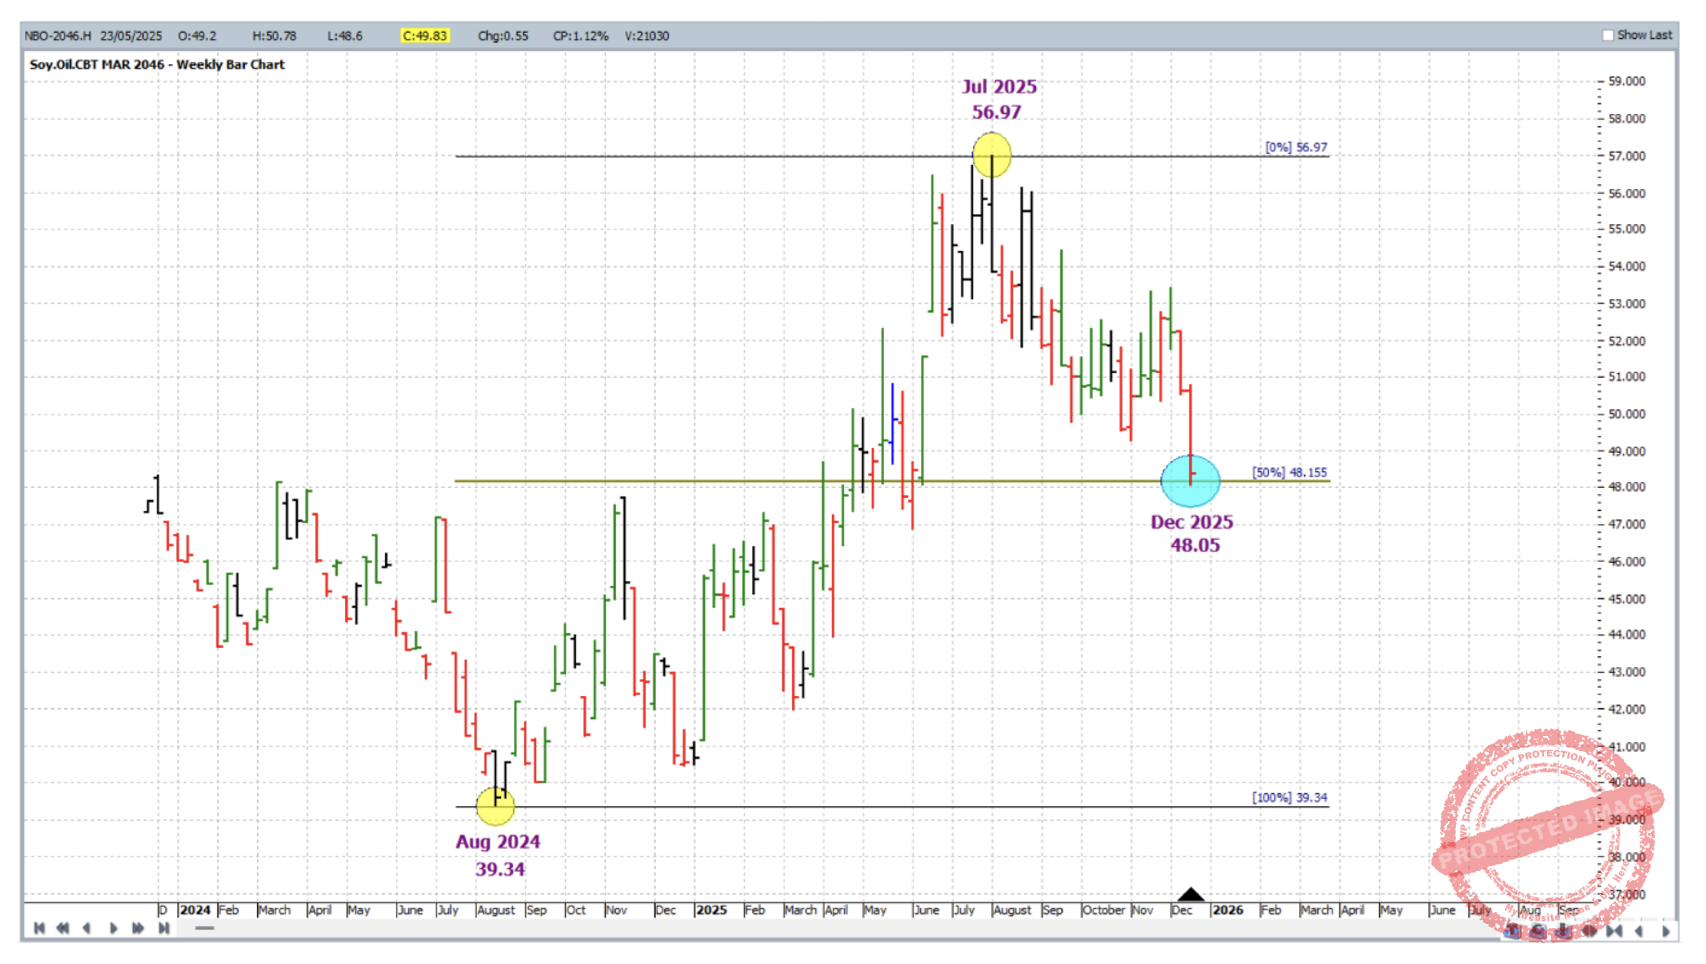
Obviously the range from the August 2024 low to the July 2025 high is a significant one, and the 50% level the most important. While this makes for a very strong analysis input, it’s almost essential to have more than one reason to call for a reversal in the market. So what else was there?
Zooming into the daily chart, and running the analysis down from the July high, we notice a price range that this market kept giving us: 516 to 534 points.
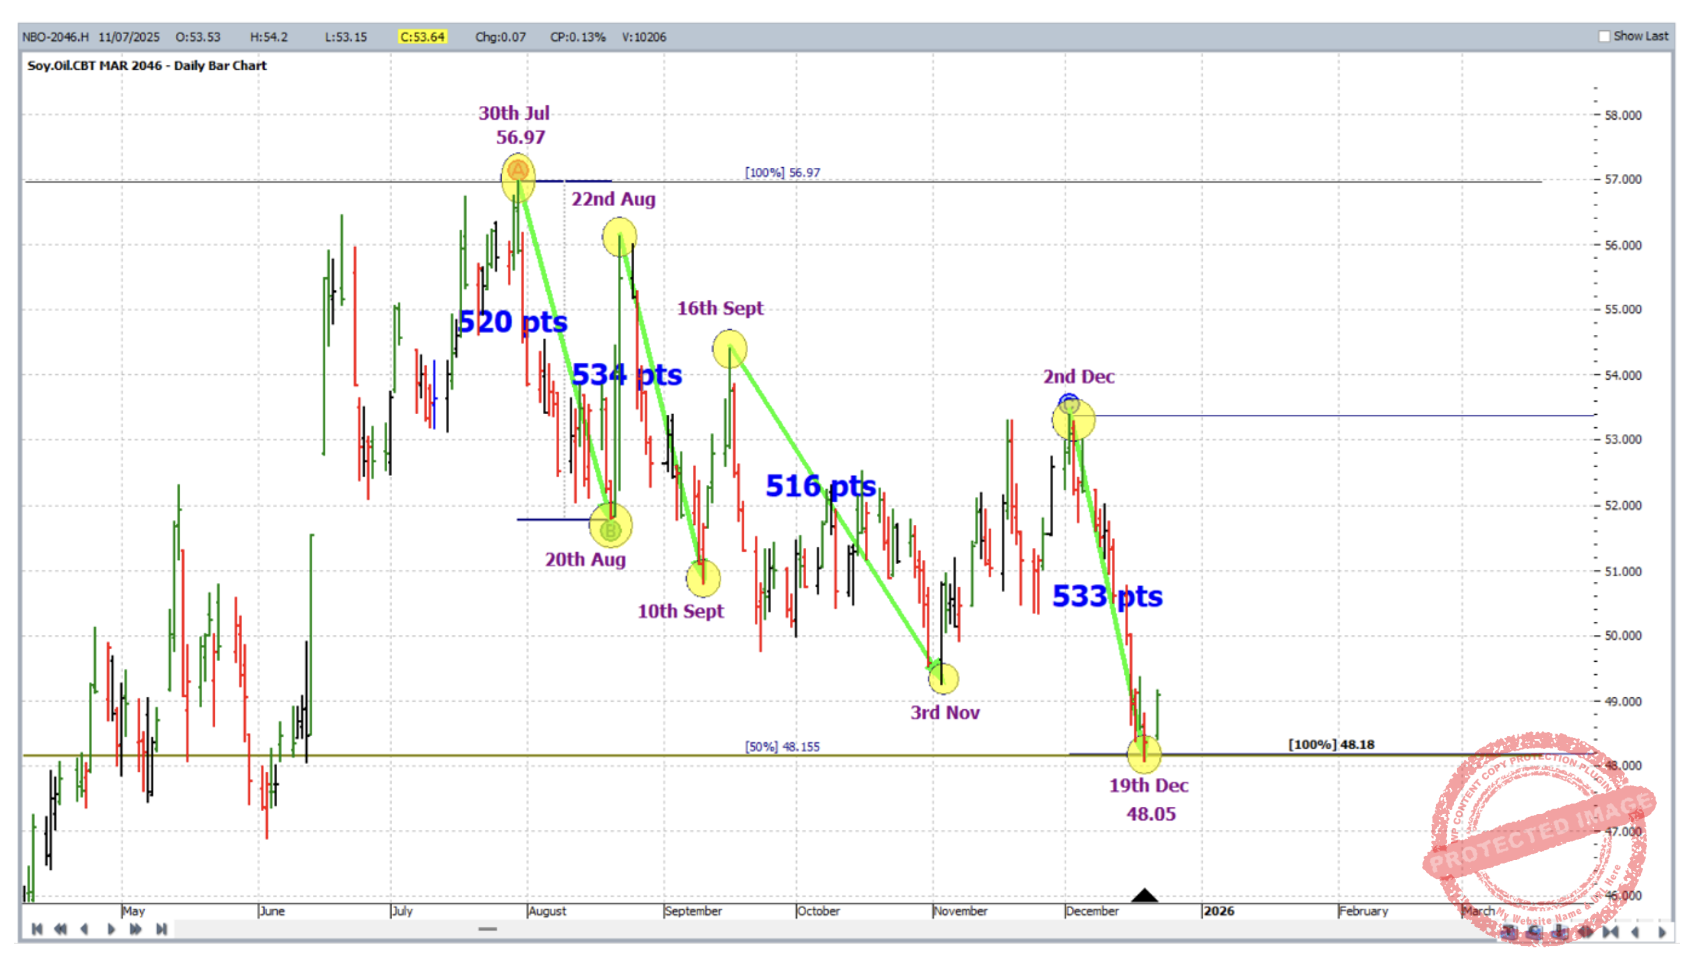
In terms of Safety in the Market analysis, you could say the above chart is an application of a few things. First and foremost – repeating ranges and the concept of the ABC. Then, First Range Out or Prime Numbers. Then, Gann’s lesson on “Sections of the Market”. Between them, these price analysis concepts are drawn from the Smarter Starter Pack, the Number One Trading Plan and the Ultimate Gann Course.
As a reader of this article feel free to look for a third reason to take this trade. And normally we would look for a third reason to call for a reversal in the market. Failing that, the two charts above are strong enough together in their own right if we are ever to call a reversal with two reasons alone.
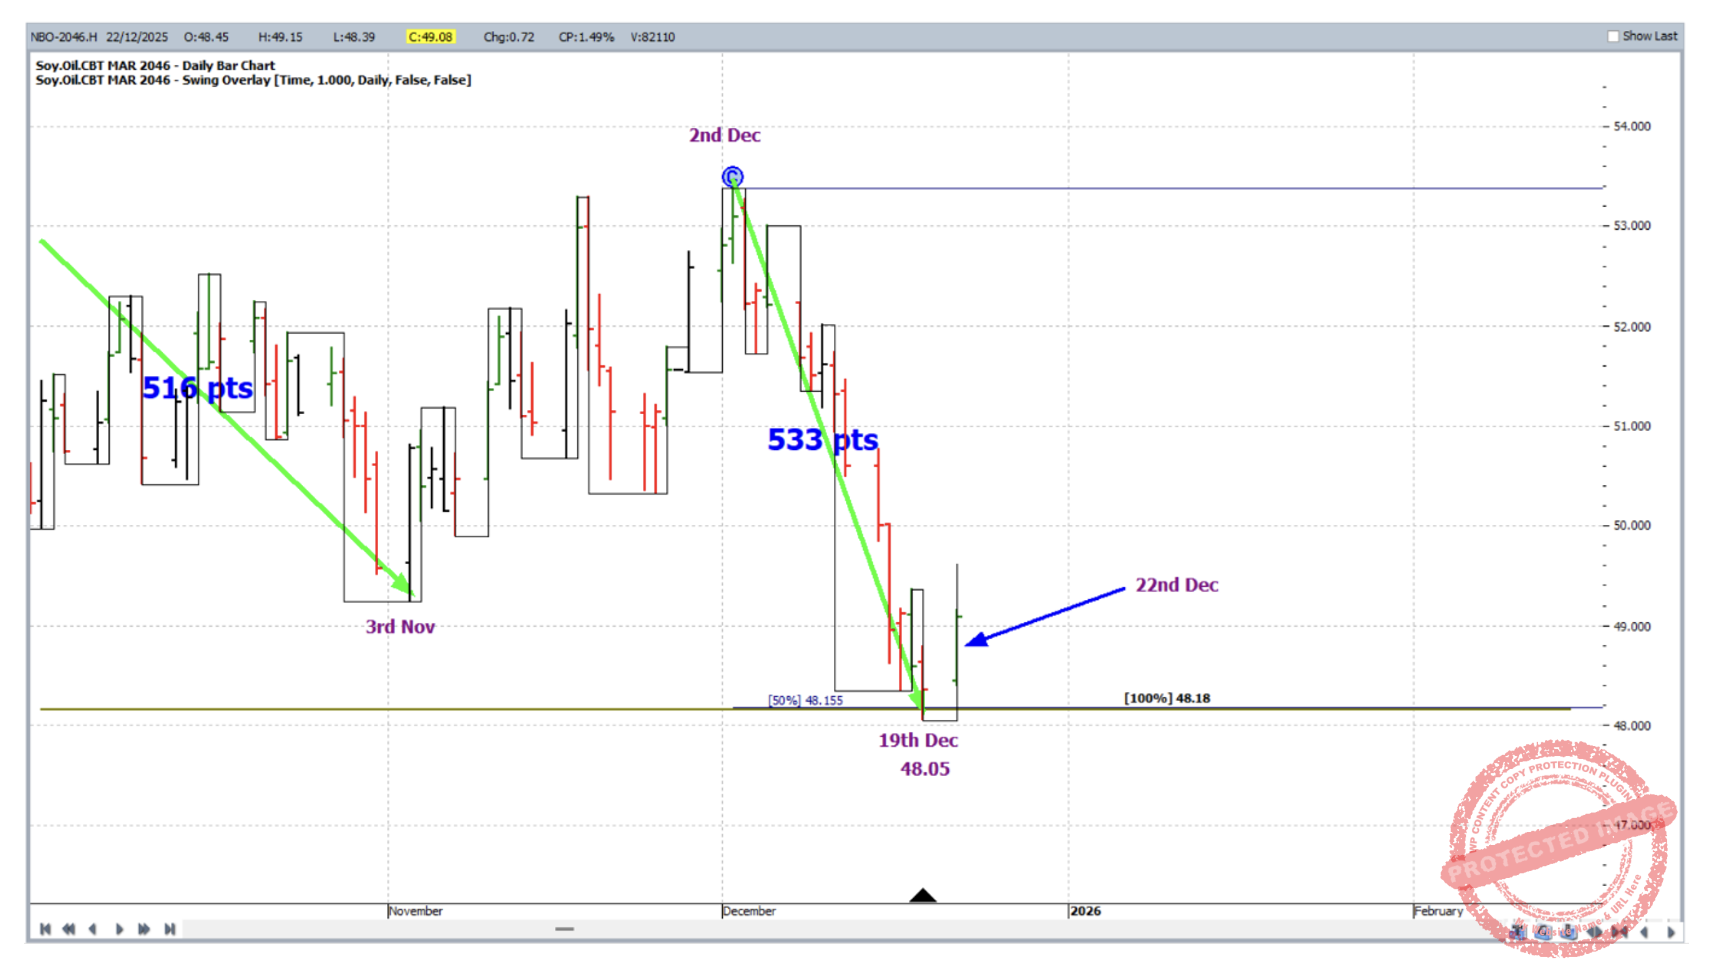
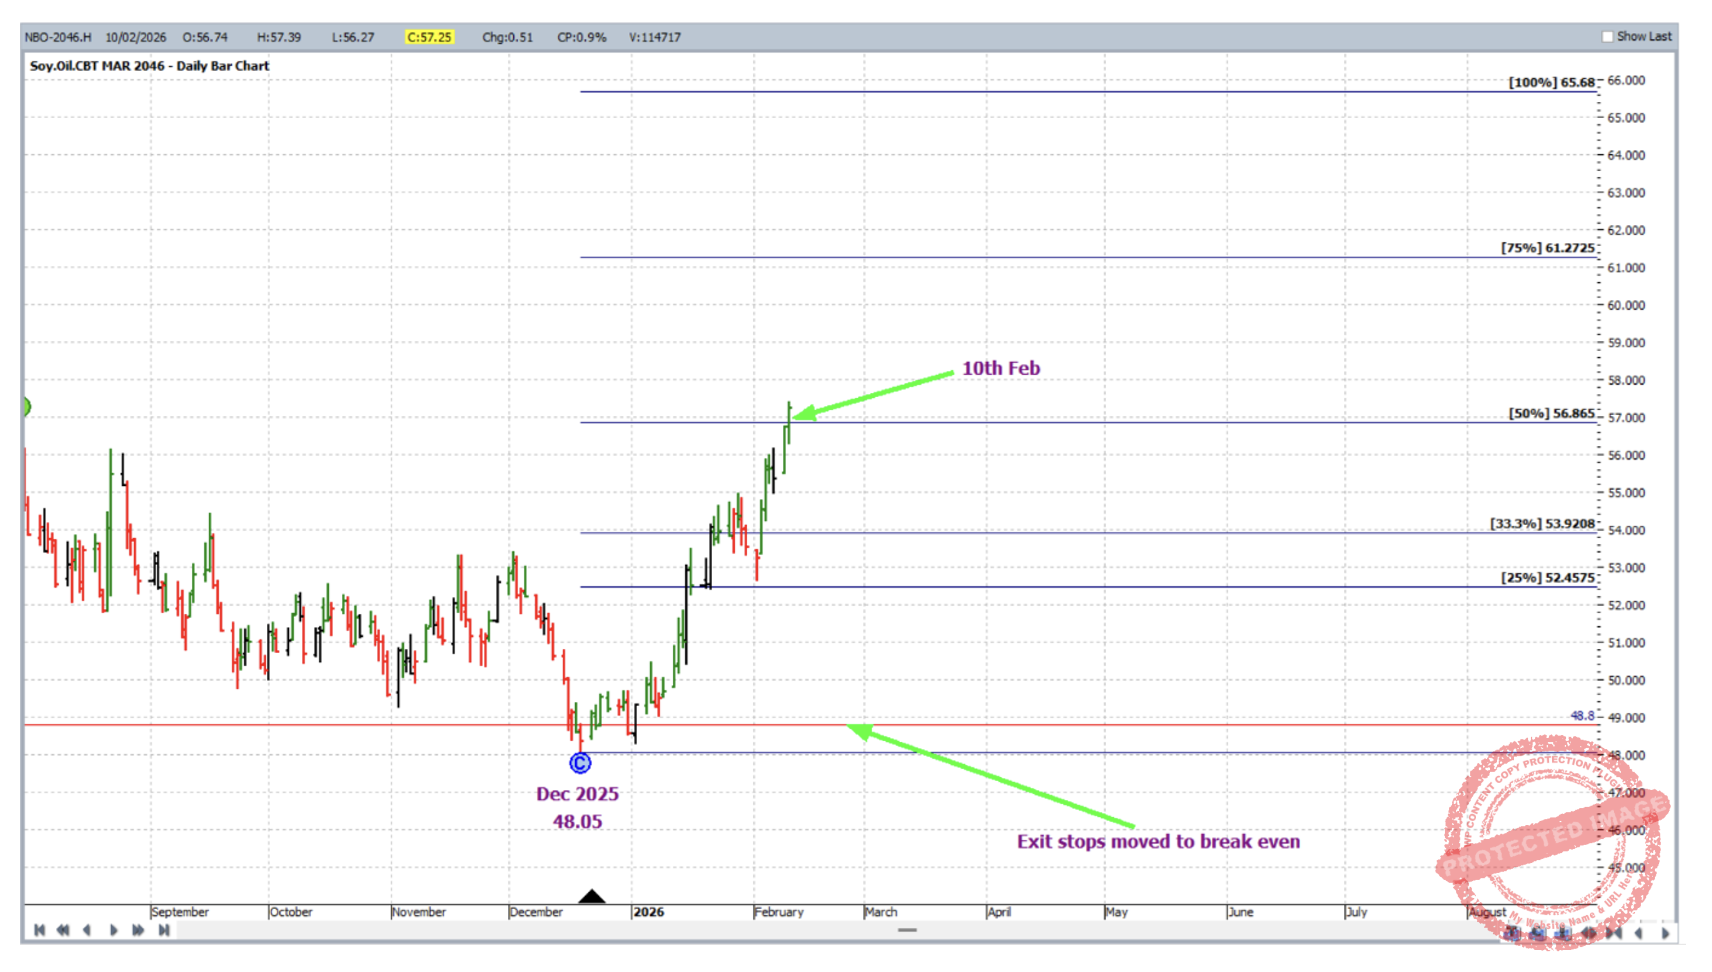
For a long trade entry, the up turning of the daily swing chart on 22 December 2025 had you long Bean Oil at 48.80 with initial exit stop loss at 48.04.
As for trade management, the trade was managed as though a large ABC with AB reference range from the August 2024 low to the July 2025 high; this is shown below followed by the ABC Details window.
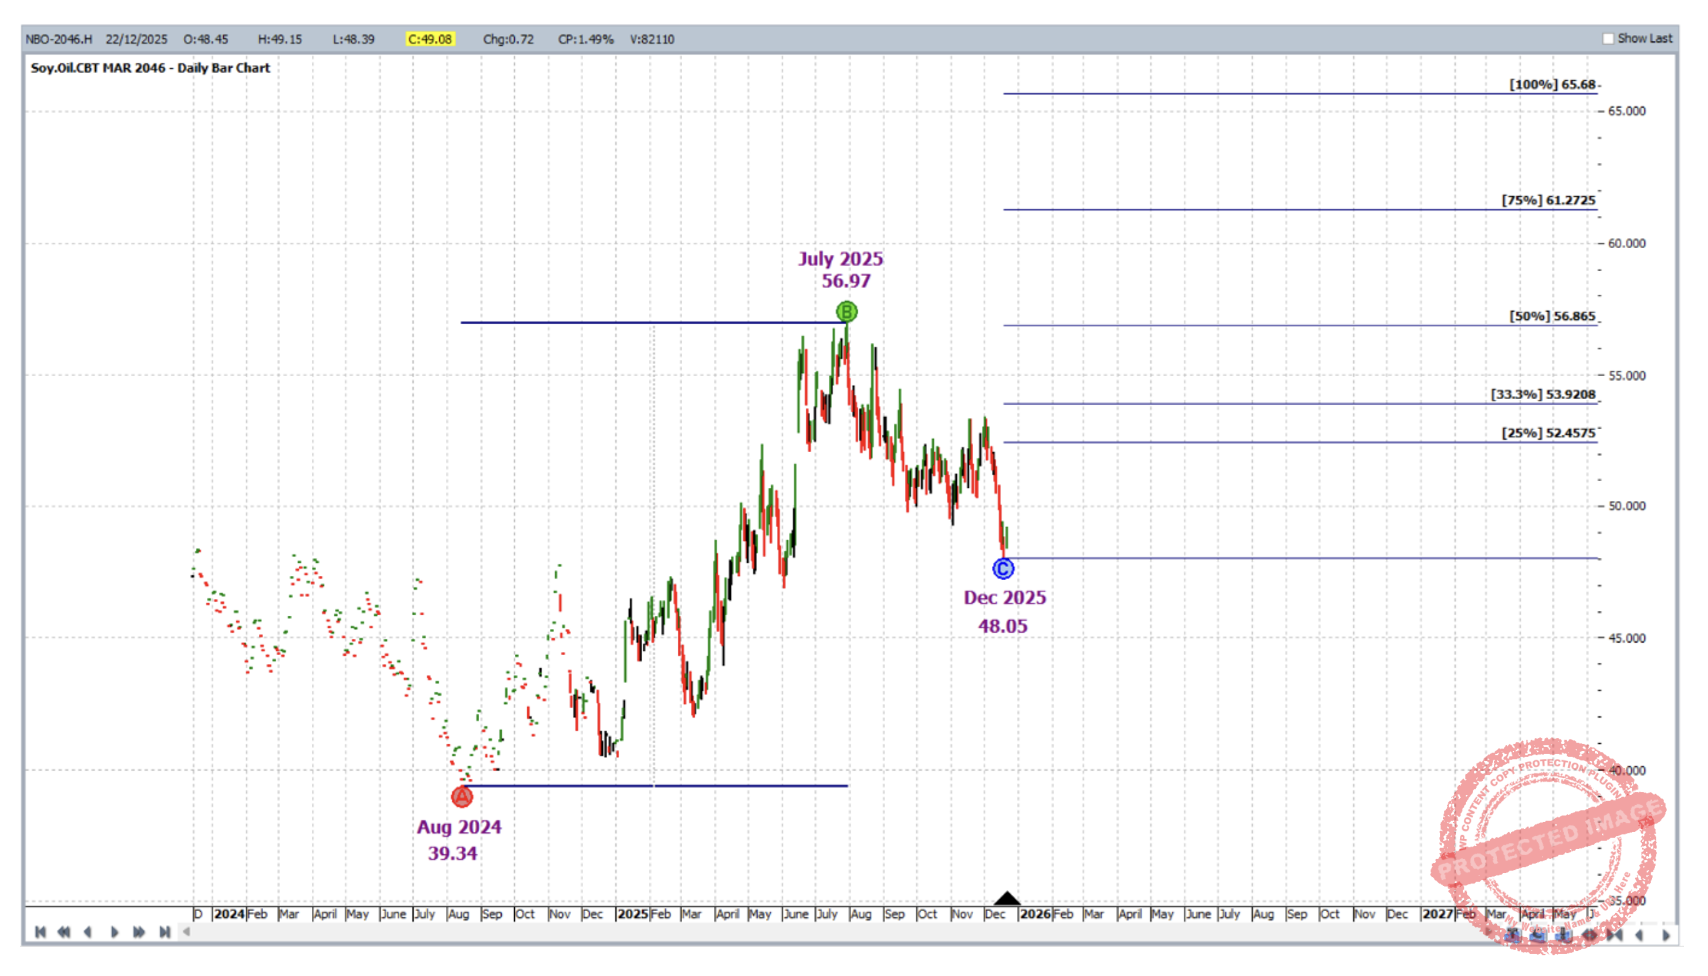
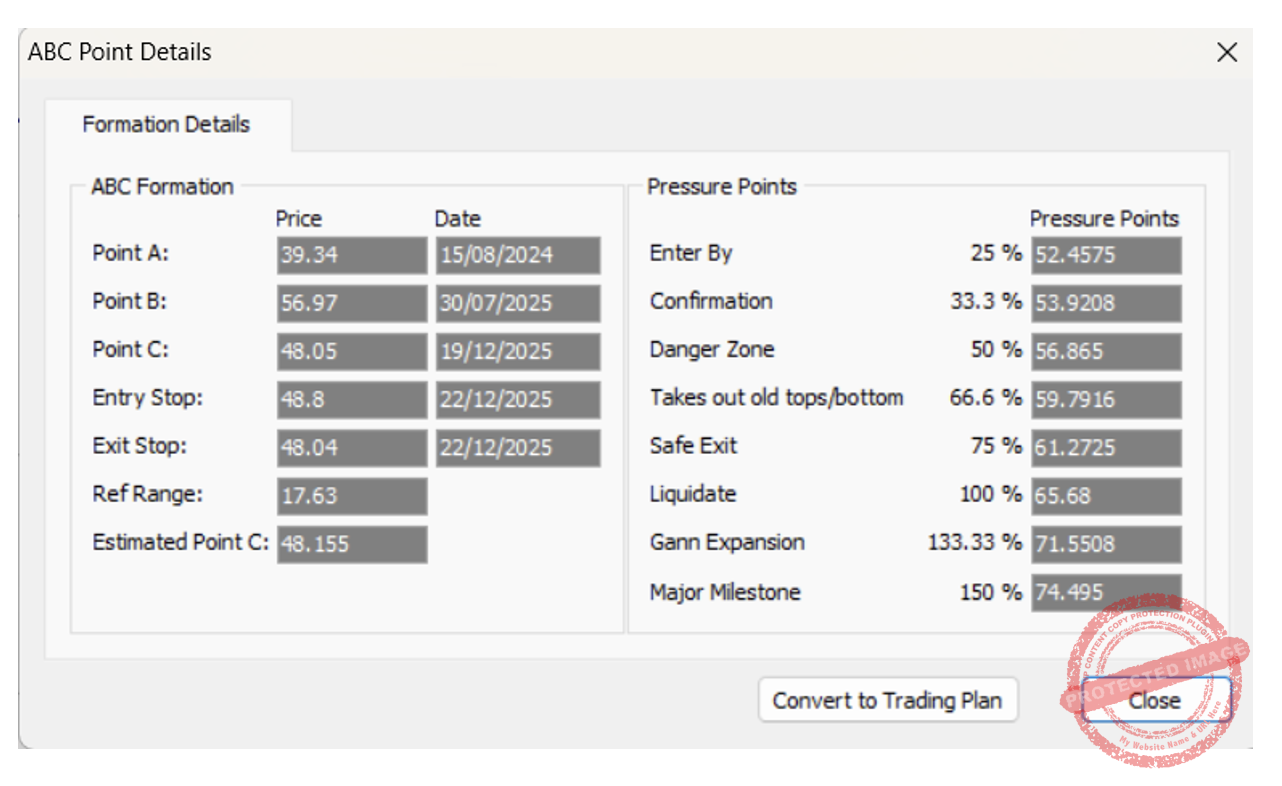
On 10 February 2026, the market reached the 50% milestone and exit stops were moved to break even.
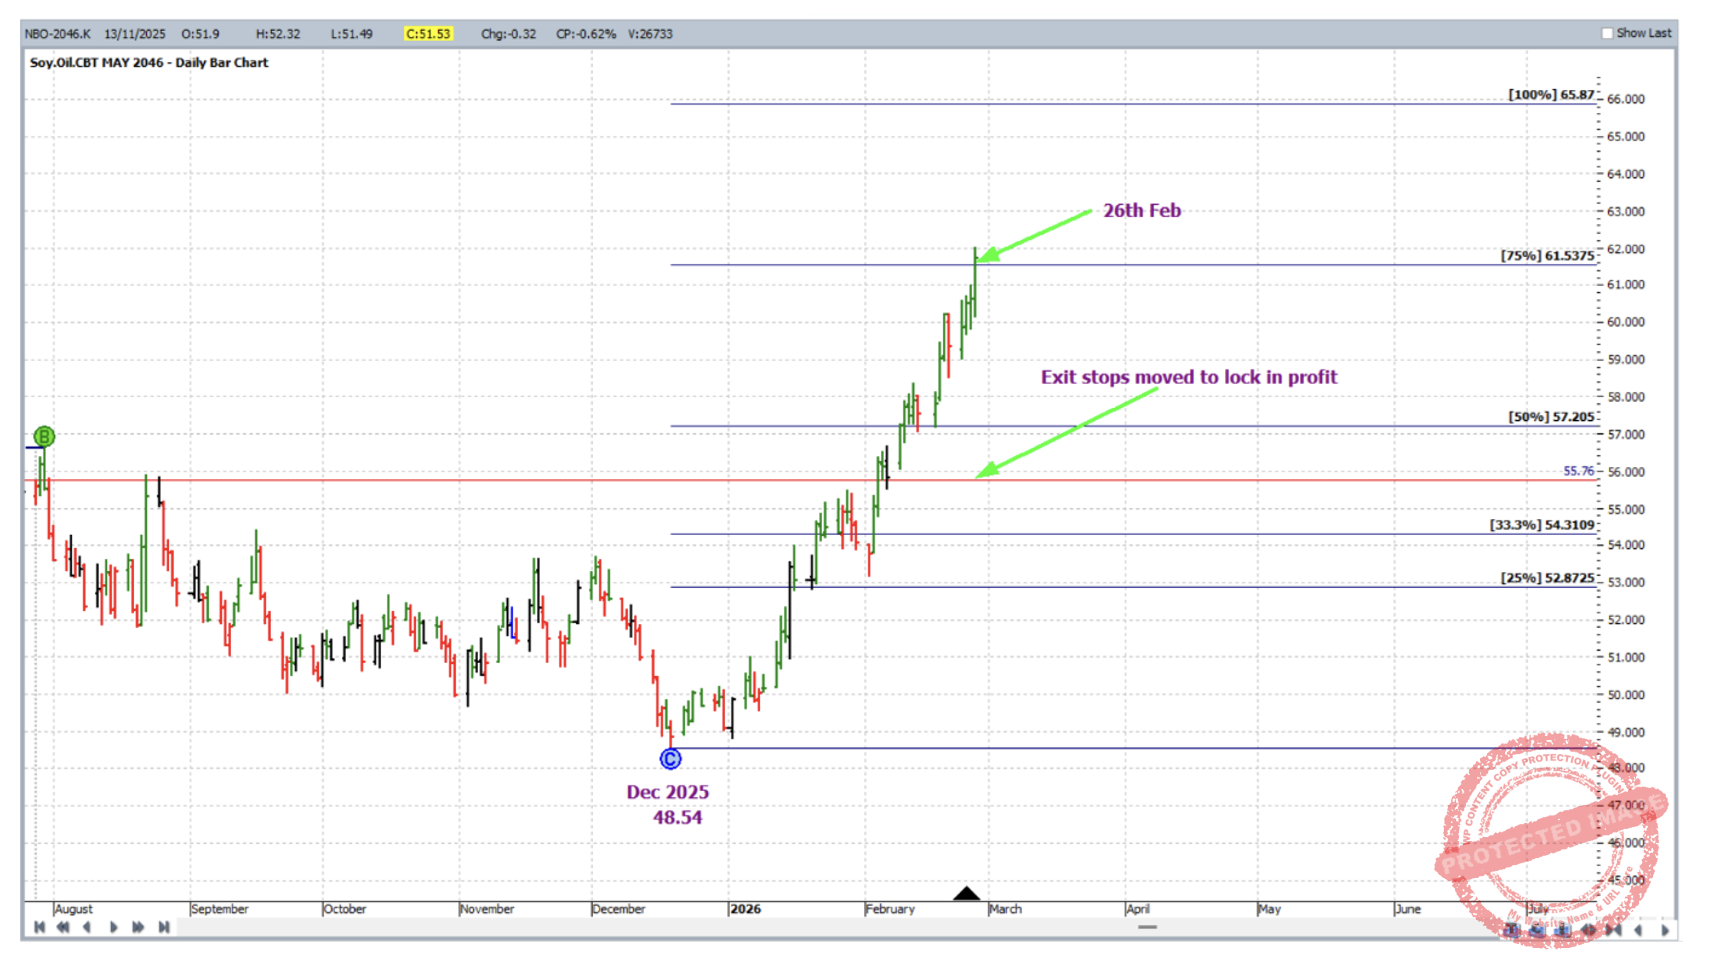
In early February of each year, by volume this market rolls from its March contract to its May contract, therefore the remainder of this trade would be managed on the May contract chart.
On 26 February 2026 the market reached the 75% milestone and exit stops were moved to roughly one third of the average monthly range (144 points on the May contract chart) behind the 50% milestone.
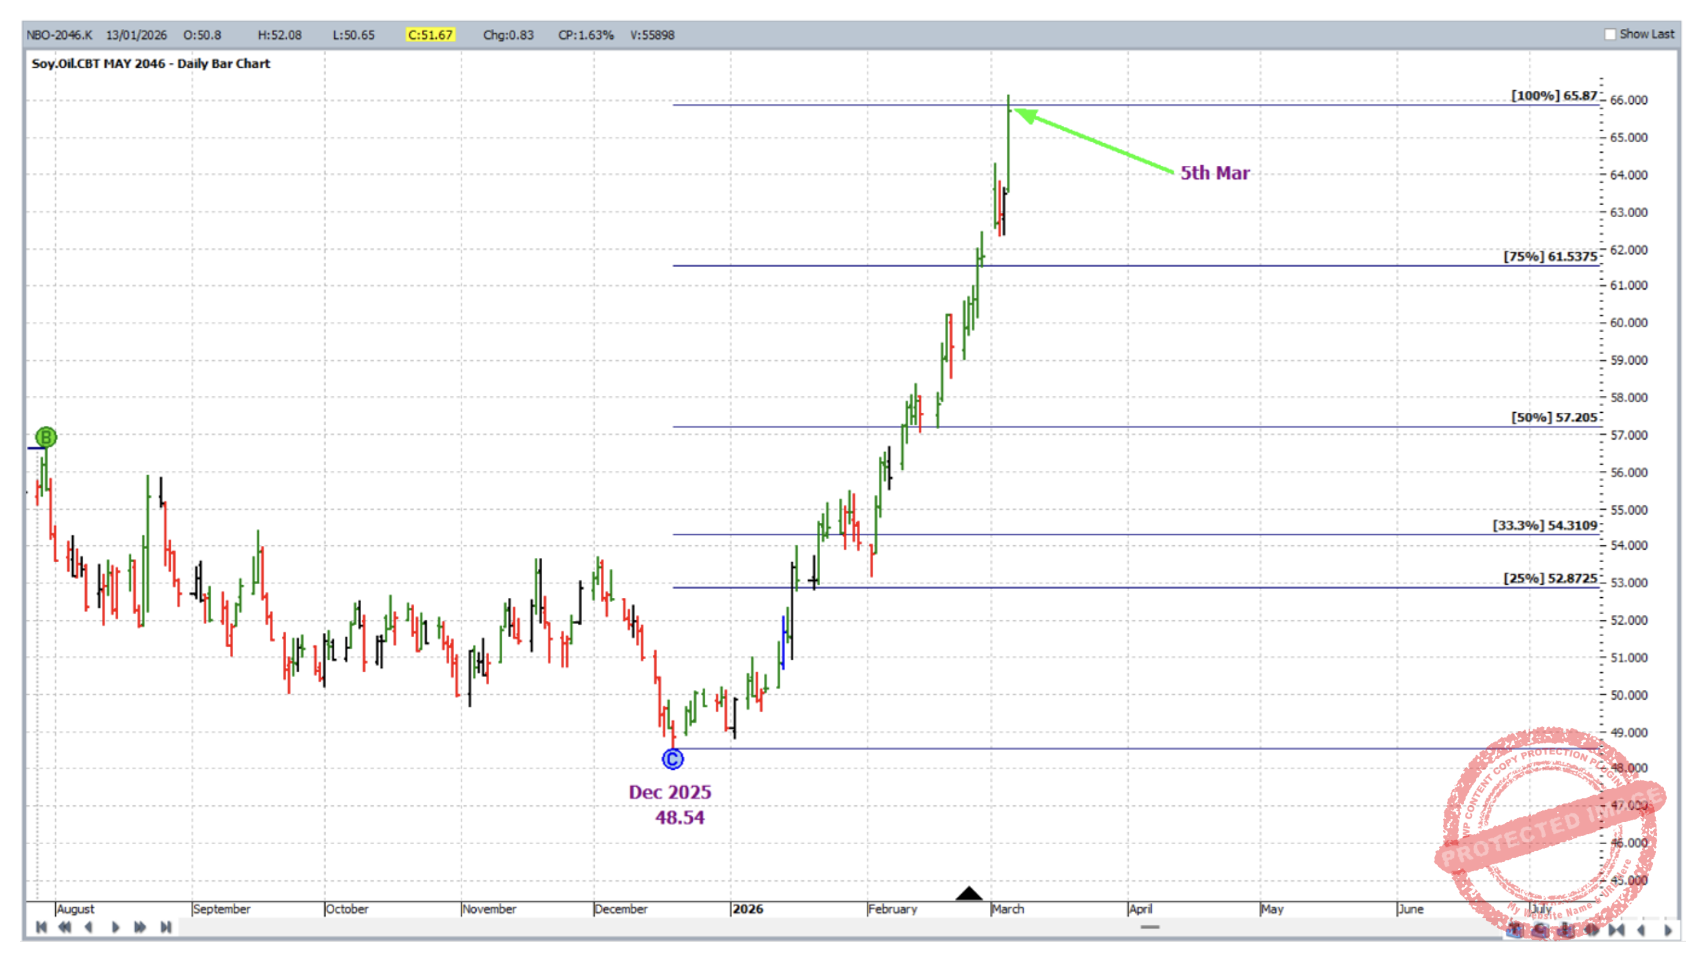
Then on 5 March 2026 the 100% milestone was reached. Watching the chart alone during this run up, the sense of fear and panic buying was obvious.
In order to keep simple the breakdown of the rewards, the details of exit/entry at rollover will be left out below, but note the outcome of the calculations would be very similar either way in this case. In terms of the reward to risk ratio:
Initial risk: 48.80 – 48.04 = 0.76 = 76 points (point size is 0.01)
Reward: 65.87 – 48.04 = 17.07 = 1707 points
Reward to Risk Ratio = 1707/76 = approximately 22.5 to 1
According to the contract specifications on the CME group website each point of price movement changes the value of one Soybean Oil futures contract by $6USD. So in absolute USD terms the risk and reward for each trade of the contract is determined as:
Risk = $6 x 76 = $456
Reward = $6 x 1707 = $10,242
At the time of taking profit, in AUD terms this reward was approximately $14,631.
If 5% of the trading account was risked at entry the gain in account size would be as follows:
22.5 x 5% = approx. 113%
This market is also accessible with much smaller position sizes by way of a CFD.
Work Hard, work smart.
Andrew Baraniak