Panic Buying – Q&A
We all know about the panic buying that took place in our local supermarkets earlier this year. And we all know why it was going on. And fair enough – it’s a natural way to react when so much uncertainty surrounds our basic necessities. The whole ordeal has had me thinking, where else might we find panic buying? And when will we find it?
What stage are we at in terms of the current global pandemic? Is it almost over, are we somewhere in the middle or are we still just at the beginning? Is a genuinely huge wave of panic buying still yet to come? Being a technical analyst of the markets, I’m always keen to look to the charts for an answer. Let’s take a look.
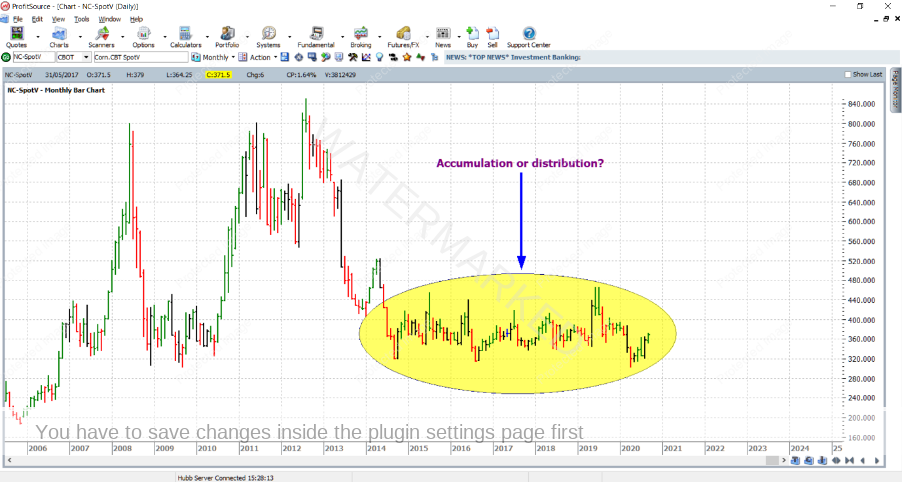
Below is a monthly bar chart for Corn – chart symbol NC-SpotV in ProfitSource. As you can see for the better part of the last 5 or 6 years this market has been locked in a very sideways pattern. In other words, we might just have a fairly serious case of either accumulation or distribution. Sooner or later a breakout will have to occur.
Chart 1 – Corn Monthly Bar Chart
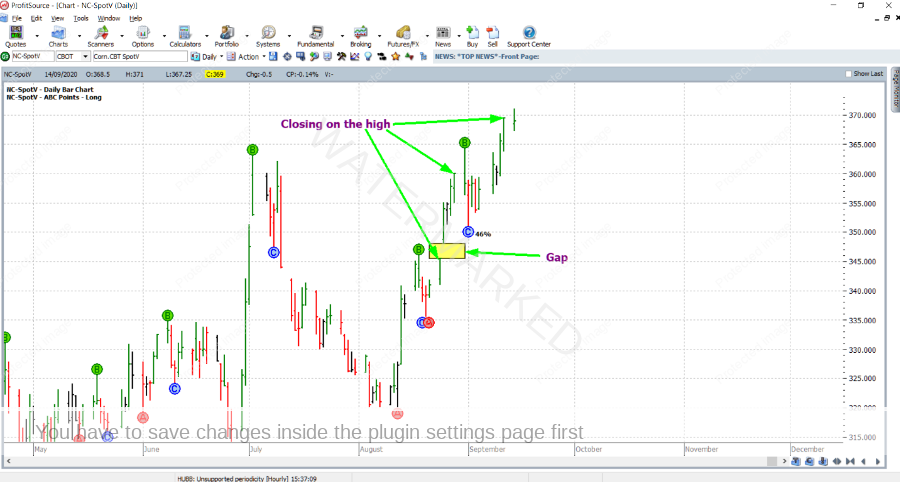
But that’s only where the form reading begins. Let’s zoom in a little more, to the daily bar chart. As you can see so far, August and September have produced a very strongly trending market, with a couple of ABC long trades, with a series of higher swing lows on the daily chart.
Chart 2 – Corn Daily Bar Chart
As you can also see in the chart above there has been a gap up in the middle of the run. This was a genuine gap during the trading week, not one due to contract rollover or build-up of sentiment over a weekend. Also, there were three trading days when the market closed on its high. Could all of this be a sign of the fresh and energetic bulls which have been absent from this market for so long? Does this add to the case for accumulation rather than distribution? Is the real panic buying yet to occur? What other evidence do we have…?
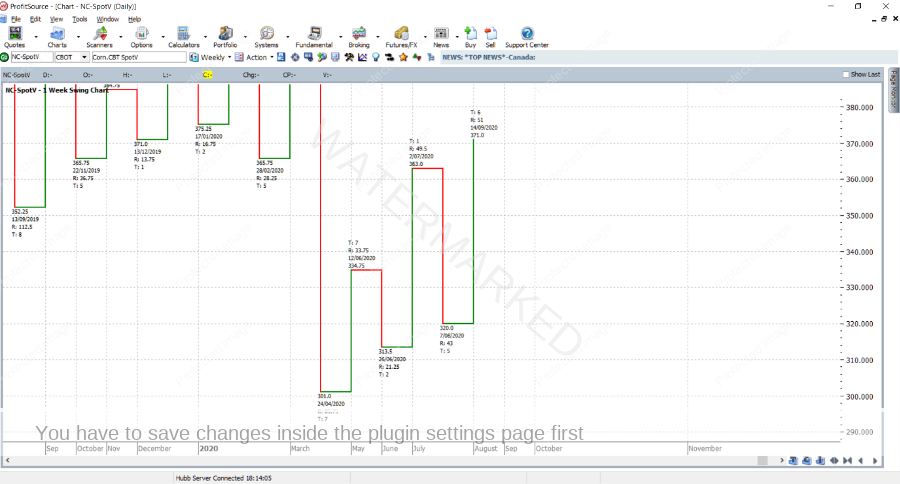
Let’s take a look at the current weekly swing chart. In Chart 3 below, we can see higher tops and bottoms, meaning the main trend is up.
Chart 3 – Corn Weekly Swing Chart
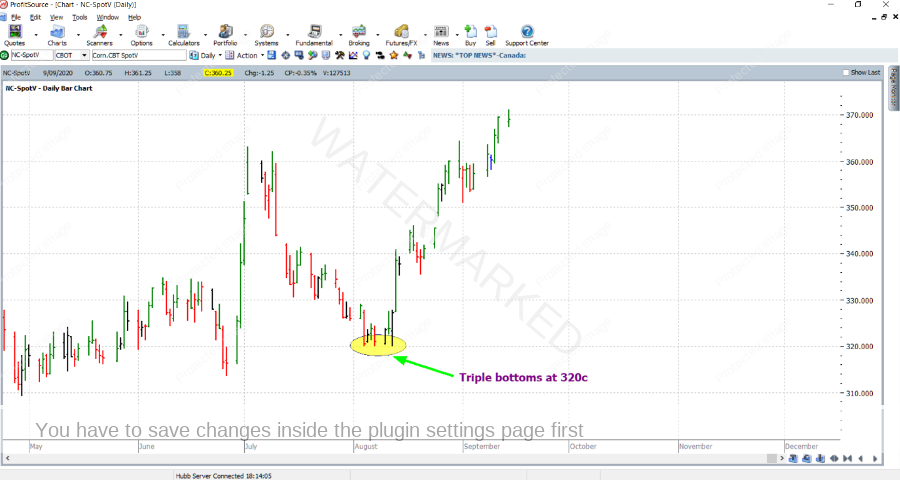
In addition, we can see in Chart 4 below that in early August this market gave triple bottoms each exactly at 320.00c.
Chart 4 – Corn Daily Bar Chart
The commodity markets can meander sideways for lengthy periods of time. But give them reasons to move, and the move can be very, very strong and fast. We must be ready before the event happens. Keep an eye on your charts.
Work hard, work smart.
Andrew Baraniak


