Patience for Gain
This month’s article brings together a few key elements from the Number One Trading Plan manual. We will observe the case study of a share CFD trade on Aussie top 200 constituent, ARB:ASX (ARB Corporation Limited) with the key parts of analysis prior to trade entry being Double Bottoms and the Highs Resistance Card. In terms of trade implementation the First Higher Swing Bottom entry signal is engaged and milestones are used to manage the trade as it progresses.
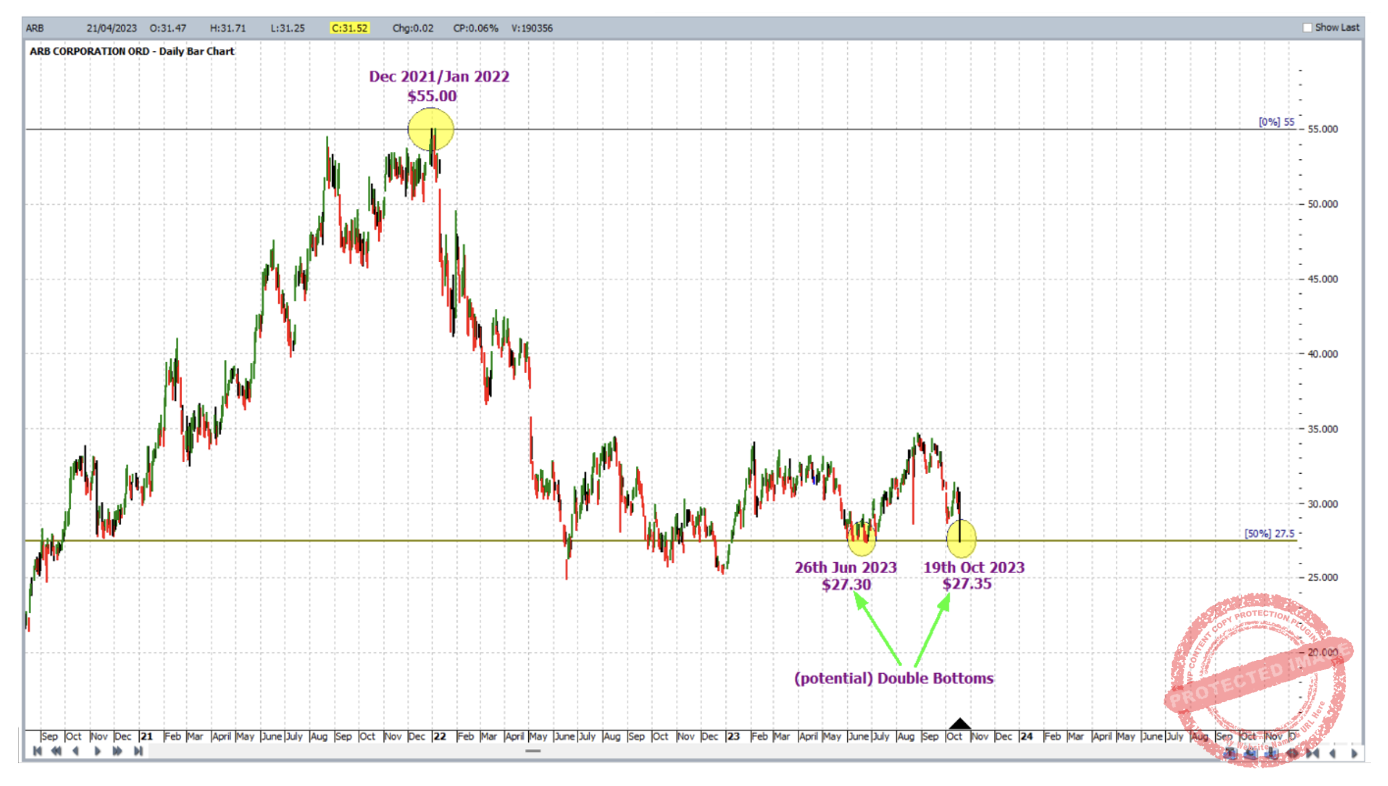
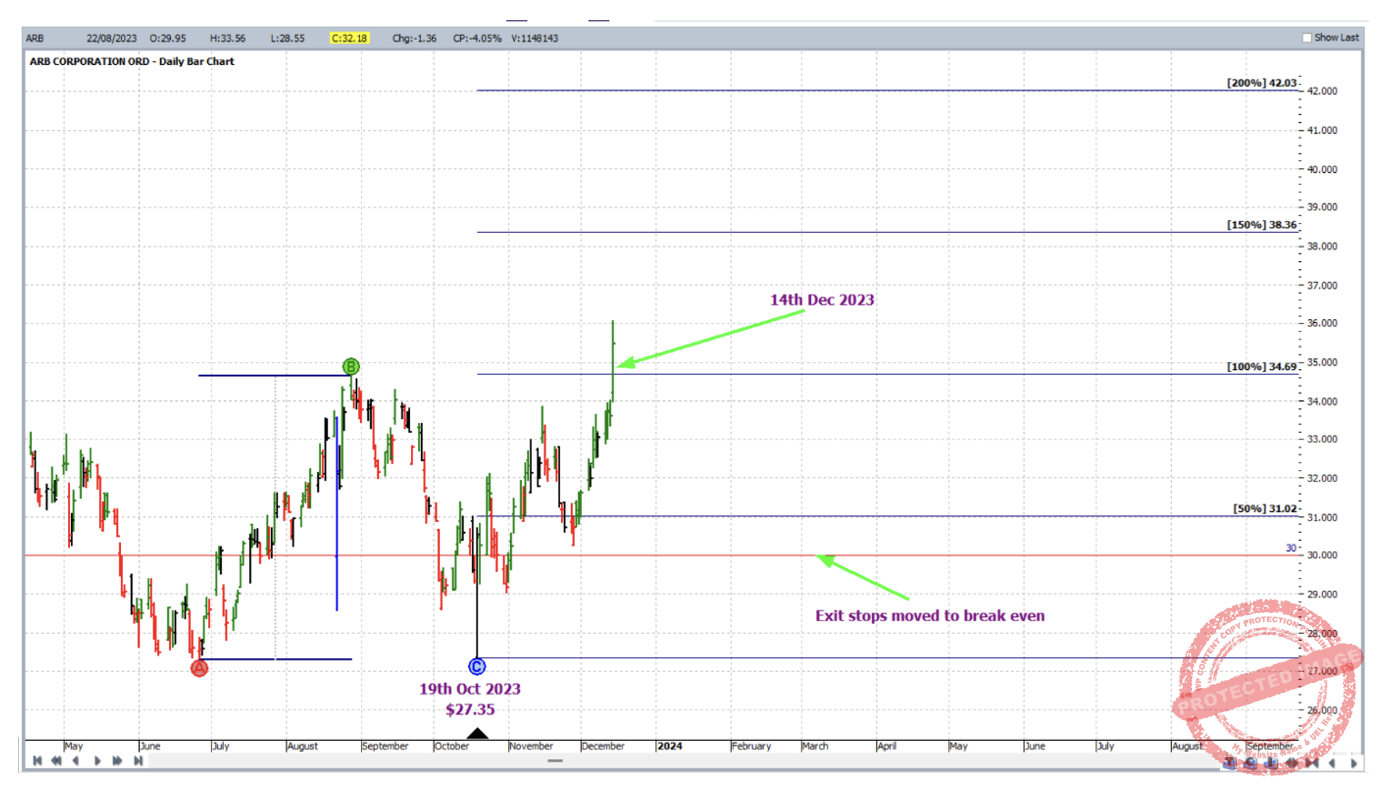
A screenshot of the analysis is shown below, with the ARB’s daily bar chart in Walk Thru mode, with data up to and including 19 October 2023 at a low of $27.35 – the second of two potential double bottoms, the first being 26 June 2023 at $27.30; and we note that both rested, within tolerable error, on the all-important 50% resistance level of the Highs Resistance Card applied to the All-Time High of $55.00 from late 2021/early 2022.
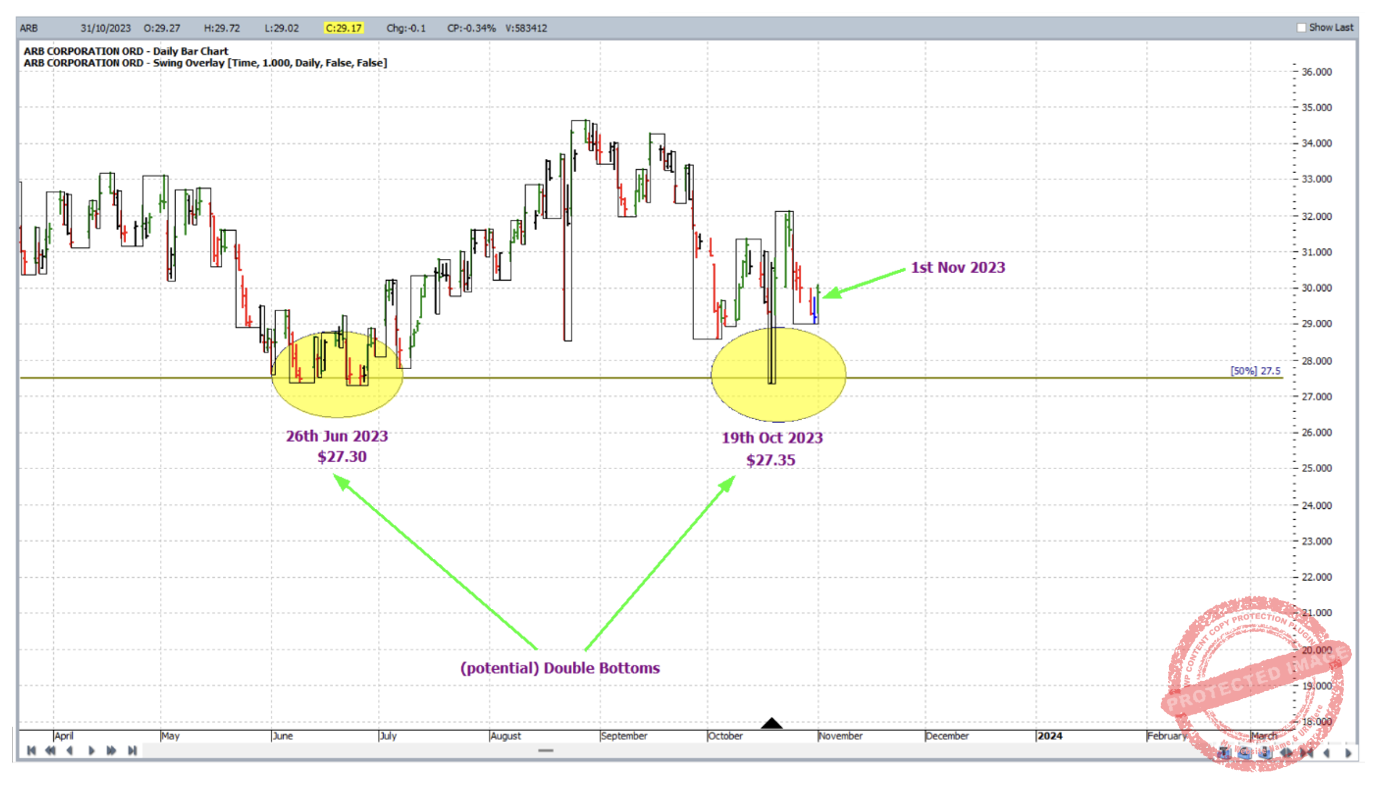
With a classic set up like this being enough reason to trade, a first higher swing bottom entry signal was triggered on 1 November 2023, with entry at $30.00, and initial exit stop at $29.01; this is shown below in Walk Thru mode and with the aid of the daily swing chart overlay.
As for trade management, the AB reference range was that from the 26 June 2023 low ($27.30) to the 28 August 2023 high ($34.64) and Point C the second of the two double bottoms. And this being a double bottom formation, the 200% milestone is the exit target.
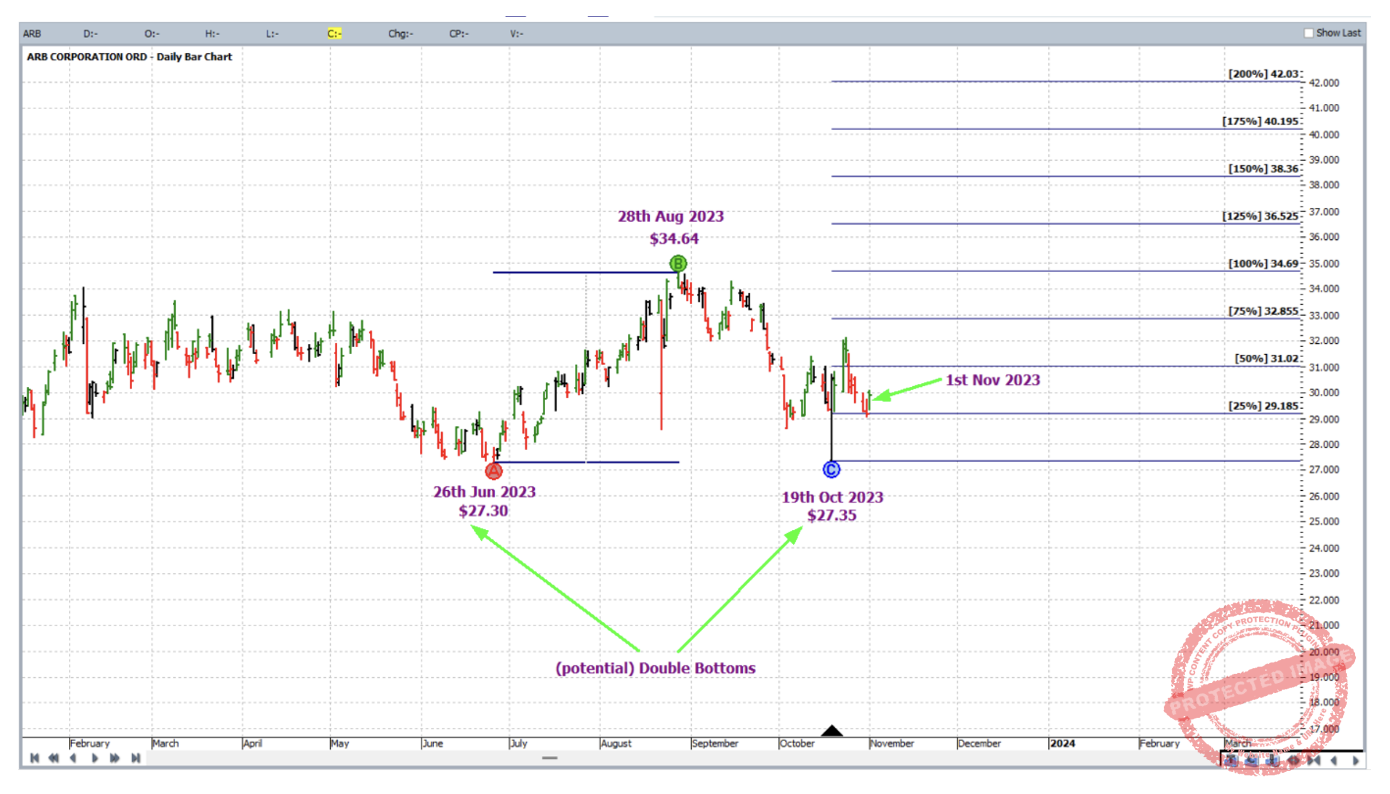
The chosen AB range is not a particularly big one for this market, and we may also notice that in the chart above the 25% multiples are relatively close together; therefore a smart trade management could be to act less frequently while in the trade. Let’s say only move stops when the very most, major i.e. 100% and 150% milestones are reached. This can and will give the market more room to breathe on its way up. After all, those two milestones (if the market is to run to 200%) are, respectively, half way and three-quarters of the way through the expected run and therefore, effectively we will still mimic the actions taken when a standard ABC trade is managed currency style.
As now shown in the chart below, the market can have more space to breathe between the milestones to be engaged in the trading plan.
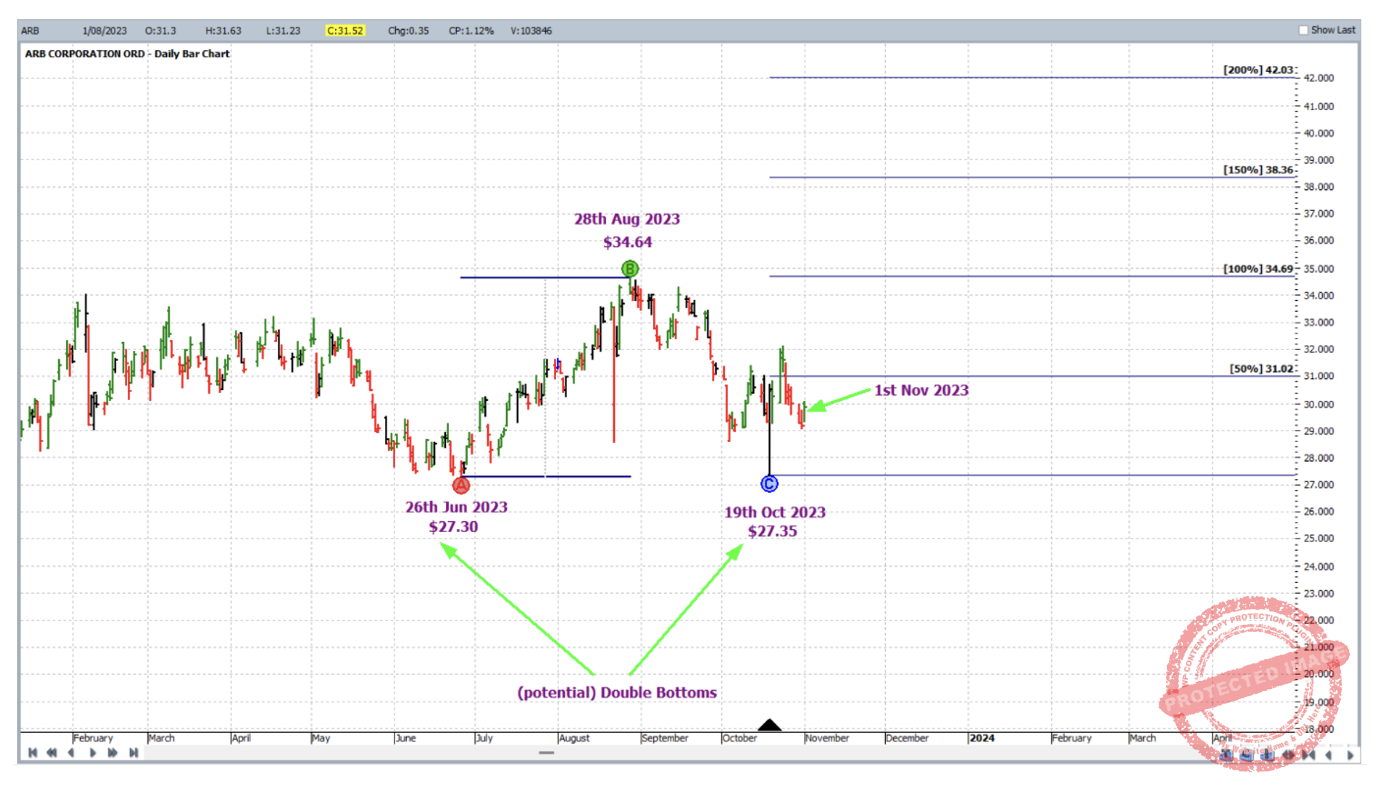
On 14 December 2023, the market broke through the 100% milestone and exit stops were moved to break even.
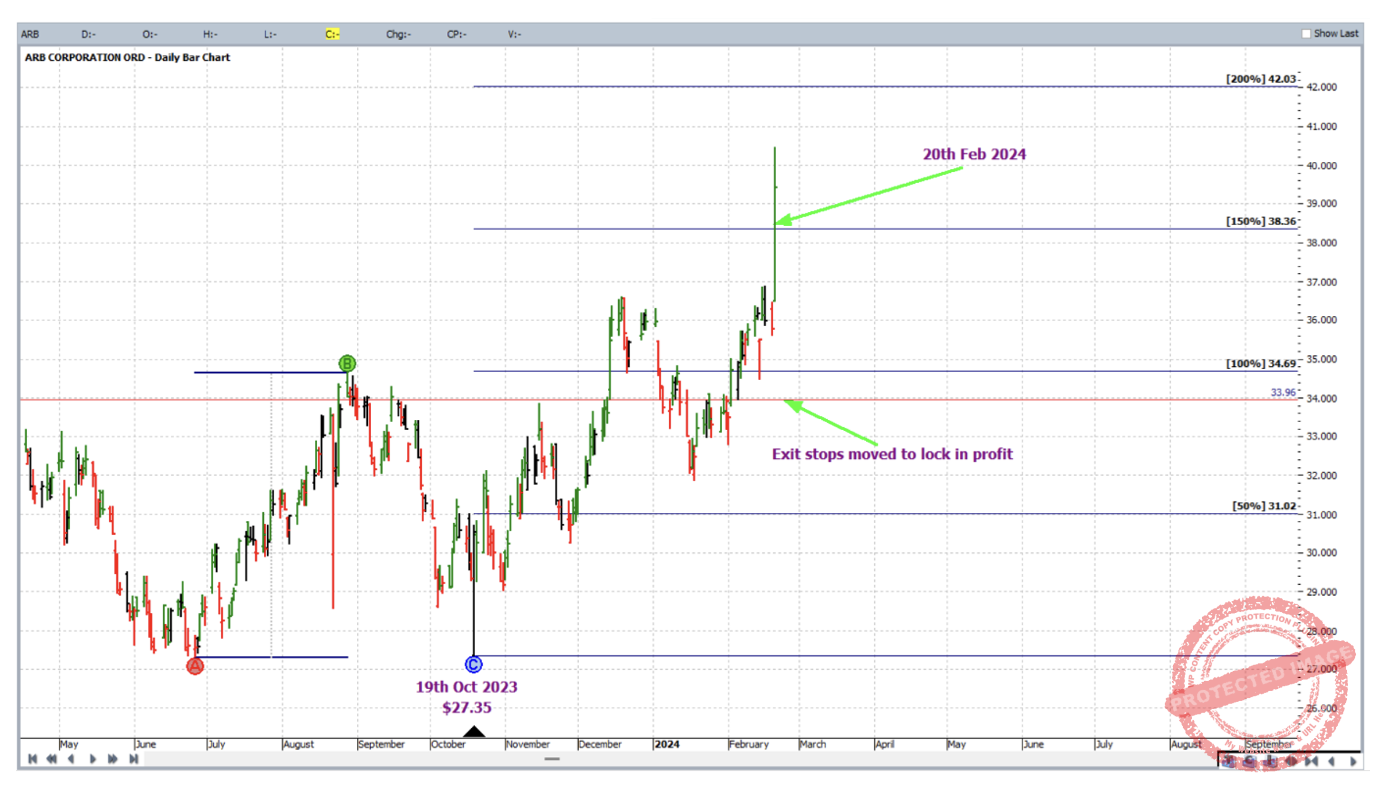
On 20 February 2024, the market broke through the 150% milestone and exit stops were moved to one-third of the average weekly range (approximately 73c at the time) below the 100% milestone, to lock in some profit.
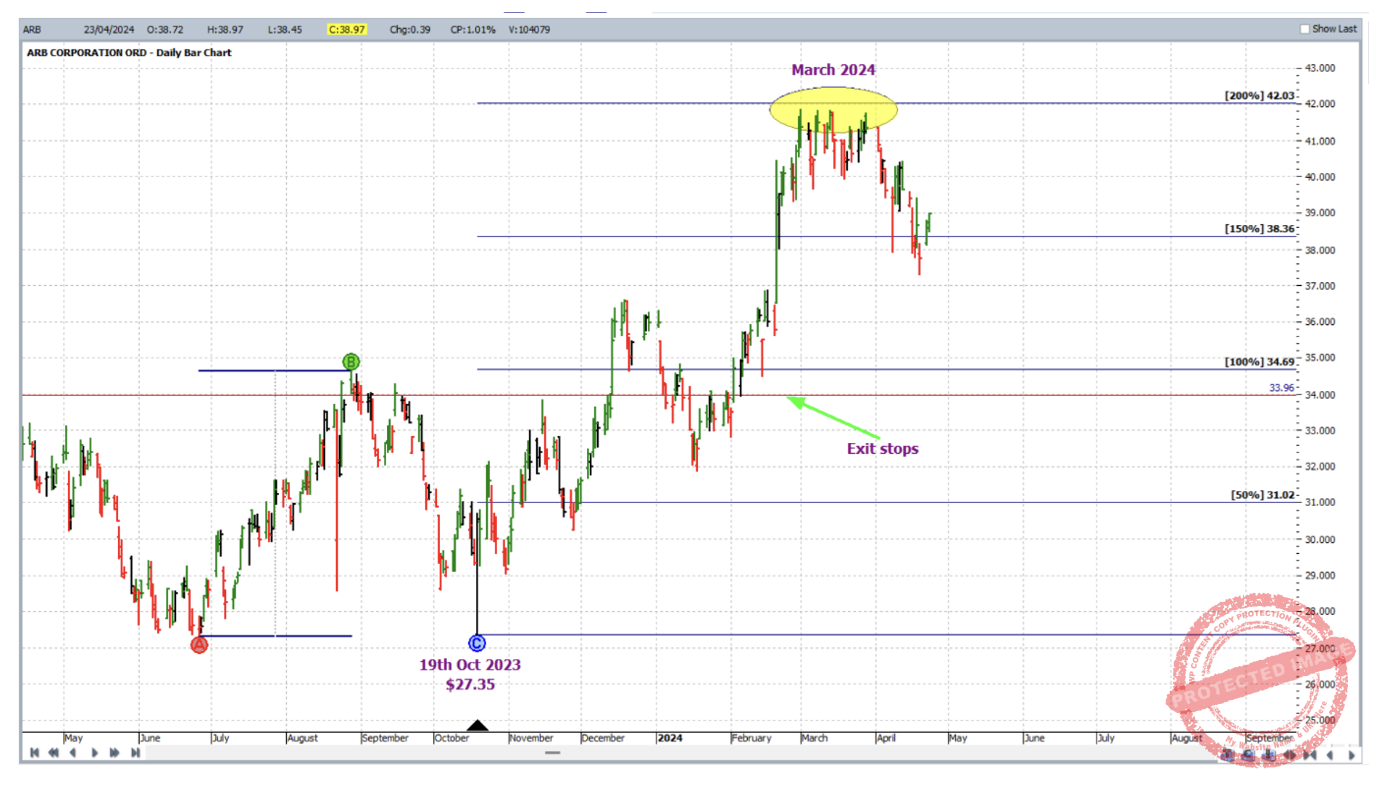
With the rate of ascent through the last major milestone, this market would have you thinking not long till stumps, but as it turned out the market had another idea – to test our patience! For the greater part of March 2024, the market hovered just below the exit target, forming a minor distribution pattern, before selling off!
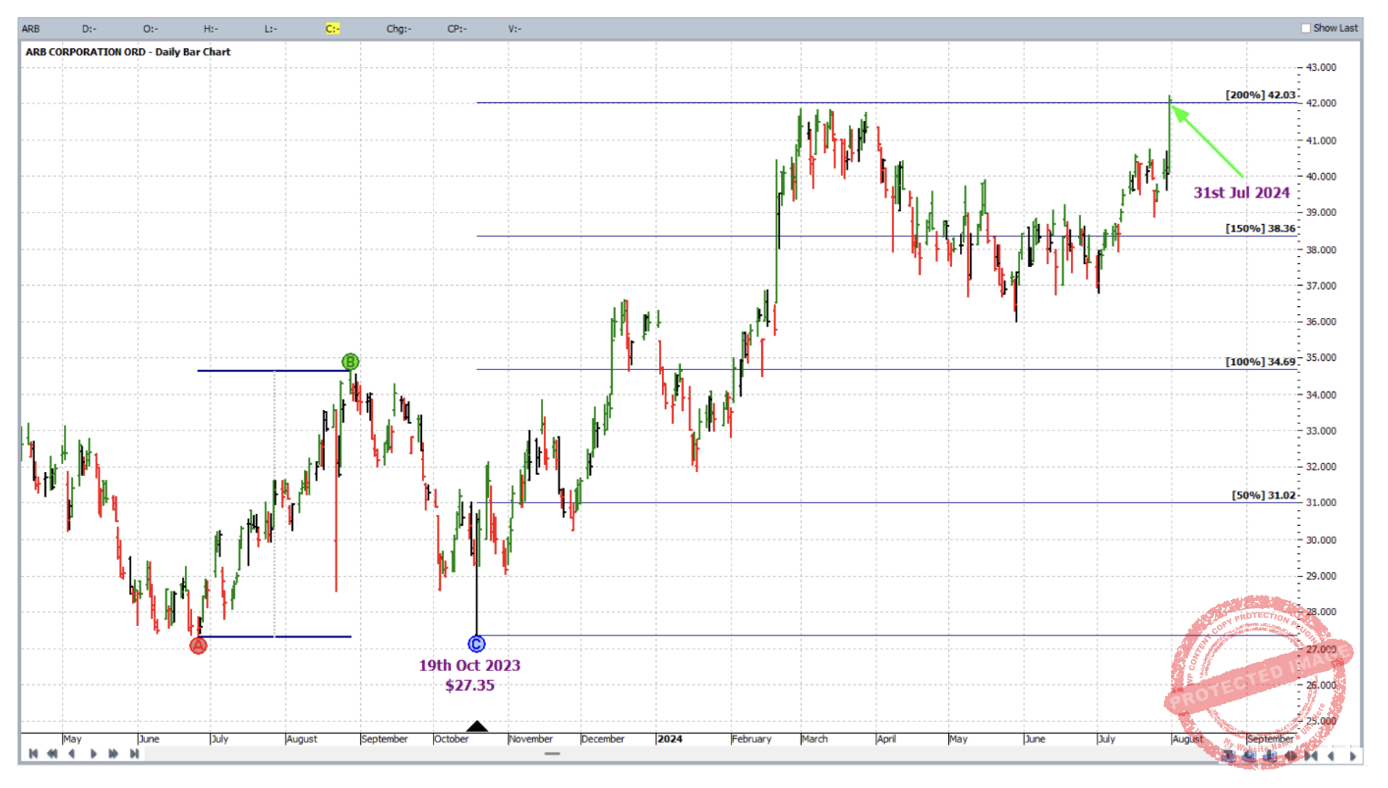
Definitely a trade to thoroughly test the emotions and the discipline! Then finally on 31 July 2024, the 200% milestone was reached and profit taken at $42.03; This was a slow trade, and probably one better suited to the trader who is ok to engage with their market on a less frequent basis.
Now for a breakdown of the rewards and gains for those patient enough!:
Initial Risk: 30.00 – 29.01 = $0.99 = 99 points (point size is 0.01)
Reward: 42.03 – 30.00 = 12.03 = 1203 points
Reward to Risk Ratio = 1203/99 = approximately 12 to 1
If 5% of the account size was risked at entry, the growth in account size from this trade alone would be as follows:
12 x 5% = 60%
More than six months in a trade is really pushing for what are generally short term affairs, but a 60% increase in any financial asset over that period of time outperforms the vast majority of investment alternatives.
With 5% of a $10,000 account risked at entry, the reward in Australian dollars would be:
12 x $500 = $6,000
Work hard, Work smart.
Andrew Baraniak